Amino Acid Requirements of Young Adults
R U T H M. LEVERTON
Institute of Home Economics, U. S. Department of Agriculture, Washington, D. C.
Page
I. Introduction 477 II. Background 477
A. Classification of Amino Acids 477 B. Quantitative Studies — Men 478 III. Quantitative Studies of Young Women 479
A. Procedure 479 B. Results 486 IV. Conclusion 503
A. Minimum Requirements 503 B. Amino Acids in Self-chosen Diets 503
C. Further Needs in Research 503
References 505 I. INTRODUCTION
Purified amino acids and nitrogen balance methodology have made it possible to study the qualitative and quantitative amino acid require- ments of man. These tools in the hands of specialized research workers, together with the cooperation of many young men and women who served as subjects, have yielded much basic information on amino acid requirement during the last two decades and promise to yield still more in the future.
Threonine was the last of the essential amino acids to be isolated and identified. When its nature and importance were known, mixtures of amino acids including threonine could be used in place of proteins to support the growth of rats. Quantitative studies followed the qualitative ones, and then studies with human subjects followed those with animals.
II. BACKGROUND
A. CLASSIFICATION OF AMINO ACIDS
In 1941, Holt and his co-workers reported the necessity of supplying certain amino acids preformed in the food in order to maintain human subjects in nitrogen equilibrium. Negative nitrogen balances inevitably occurred when the diet was deficient in tryptophan (Holt et ah, 1941), or lysine (Albanese et al., 1941), or methionine (Albanese et al., 1943).
Nitrogen equilibrium was re-established when the missing acid was added.
477
478 RUTH M . LEVERTON
In 1942, Rose et al. published a note stating that valine and isoleucine were indispensable for the maintenance of nitrogen equilibrium. In 1943, he added threonine, leucine, and phenylalanine to this list of essen- tial amino acids for man.
In 1944, Albanese et al. reported that methionine alone could supply the need for sulfur-containing amino acids, and cystine was retired to the group of dispensable amino acids for man. Arginine and histidine were found to be dispensable also (Holt et al., 1942; Rose et al., 1943).
The complete list of essential amino acids—those which must be sup- plied preformed to maintain nitrogen equilibrium in man—was given by Dr. Rose in 1949 and included: isoleucine, leucine, lysine, methionine, phenylalanine, threonine, tryptophan, and valine.
The classification of "essential or indispensable" for these amino acids and "nonessential or dispensable" for all of the other amino acids does not refer to the body's need for the different acids but only to the body's need to have certain ones supplied preformed. Amino acids which can be formed within the body, when the appropriate materials are supplied, have important functions and are essential. Their classification as non- essential can be misleading, especially in nontechnical circles.
B. QUANTITATIVE STUDIES—MEN
The studies of the quantitative requirement for these amino acids which followed their identification called for a relatively new idea in human feeding studies—the use of purified or semi-synthetic diets. In such diets pure chemicals supplied the minerals and vitamins, amino acids were used in place of proteins, and sucrose, cornstarch, and butter- fat were the chief sources of energy. Only in this way could the com- position of the diet be kept constant while a single amino acid was quantified.
Tryptophan was the first amino acid for which quantitative results were reported from studies of human subjects (Holt et al., 1944, and Baldwin and Berg 1949). However, from 1942 through 1952 Rose and his associates at the University of Illinois were making a systematic study of the requirement of young men for each of the 8 essential amino acids. In 1949 he (Rose, 1949) reported tentative values for minimum requirements and recommended intakes of these acids. In the detailed reports the term "recommended intake" was changed to safe "intake"
(Rose et al., 1954) but by either designation it was twice the minimum requirement. The minimum requirement was the amount needed by the subject who required the largest quantity of an amino acid to maintain a "slight but distinctly positive nitrogen balance as measured by the average for a period of several days." A thorough recounting of these
important, and now published, results has been made recently by Rose (1957) and is recommended to the reader.
III. QUANTITATIVE STUDIES OF YOUNG WOMEN
Early in the 1950's plans were made jointly by research workers in human nutrition in the United States Department of Agriculture and in the Home Economics departments of three universities to study the amino acid requirements of young women. The research leaders, their university locations, and the amino acids they studied were: Dr. Ruth Leverton at the University of Nebraska studied threonine, valine, trypto- phan, phenylalanine with and without tyrosine, and leucine; Dr. Marian Swendseid at the University of California (Los Angeles) studied methi- onine and cystine, and isoleucine; and Dr. May Reynolds at the Uni- versity of Wisconsin studied lysine and methionine and cystine. The research studies were supported in part by U. S. Department of Agri- culture contracts sponsored by the Human Nutrition Research Division of the Agricultural Research Service. In addition, Dr. Helen Clark at Purdue University has investigated the lysine requirement of both men and women as one phase of the North Central regional project on the nutritional status of adults.
A. PROCEDURE
1. General Principle
The procedure used by Leverton and her associates at the University of Nebraska will be discussed in some detail because it was also fol- lowed in general by the other researchers. The method was patterned after that of Rose (1949) and was based on the fact that when one or more essential amino acid is absent from the diet, or present in insuf- ficient amounts, the nitrogen excretion exceeds the intake and a negative nitrogen balance occurs. To determine the quantitative requirement for an essential amino acid it was necessary to find the least amount of that acid which would maintain nitrogen equilibrium in the subjects, when the other essential amino acids were present in adequate amounts.
2. Vlan of Studies
The first step in the experimental procedure was to feed each subject a ration adequate in the known dietary essential and generous in all of the essential amino acids until she had been in nitrogen equilibrium for at least 7 days. The second step was to reduce stepwise the intake of the amino acid to be measured until the subject went into negative nitrogen balance for at least 4 days. Finally, the intake was then increased step- wise until nitrogen equilibrium was again established. The least amount
480 RUTH M . LEVERTON
which maintained a subject in nitrogen equilibrium was regarded tenta- tively as her requirement.
The other investigators chose to reduce the quantity of the amino acid sharply or omit it entirely after the subjects had established nitrogen equilibrium on the complete mixture of amino acids. This induces neg- ative balance more quickly than reducing the intake gradually.
Five separate studies were conducted at the University of Nebraska between September 1951 and April 1954. The major part of each time period was devoted to work with one amino acid. Following this, except in the first study, there was an ancillary study to repeat some level of an amino acid previously studied, or to try a level of one which was to be quantified later.
After the requirement for each of the 5 amino acids, threonine, valine, tryptophan, phenylalanine, and leucine, had been studied separately, they were all fed, together with the other acids in the amino acid ration, in the least amounts which had been found capable of maintaining nitrogen equilibrium in all of the subjects. This was called the Test Mix ration.
In this way the adequacy of the minimum amount of each of the 5 amino acids measured separately was tested in the presence of minimum amounts of the other four.
Finally, in the last study made by Swendseid and Dunn (1956) it was possible for her to feed minimum amounts of all 8 of the essential amino acids.
3. Subjects
In the Nebraska studies 35 college girls who ranged from 19 to 26 years of age served as subjects (one of them served in two studies).
Fifteen similar subjects in the California studies ranged in age from 20 to 36 years. In the Wisconsin studies the 24 women subjects (2 of them served in each of two studies) were both students and staff members;
12 subjects were from 18 to 29 years, 9 subjects were from 30 to 39 years, and 3 subjects were 43, 47, and 64 years of age.
At the beginning and end of the studies, each subject had a medical examination including routine laboratory tests of blood and urine. All of the subjects were considered healthy, within normal limits of weight for height, and had metabolic rates within the normal range for their ages.
4. Preliminary Period
During the first days of each study, the subjects were given a weighed diet composed of ordinary foods. The kind and amount of food were the same each day, except for the amounts of fat and sugar which were
adjusted to meet the caloric requirements of the individual subjects.
This period gave the subjects time to adjust physiologically and psycho- logically to the experimental set-up, which was to become more rigid and increasingly tiresome. The subjects usually came into nitrogen equilibrium during this period of controlled food intake, which varied in length from 8 to 14 days in the different studies.
5. Experimental Period
The experimental period included all the days following the pre- liminary period until the end of the study. The diet was semi-purified and included a limited number of foods which were extremely low in nitrogen, mineral, and vitamin supplements, and amino acids in purified form.
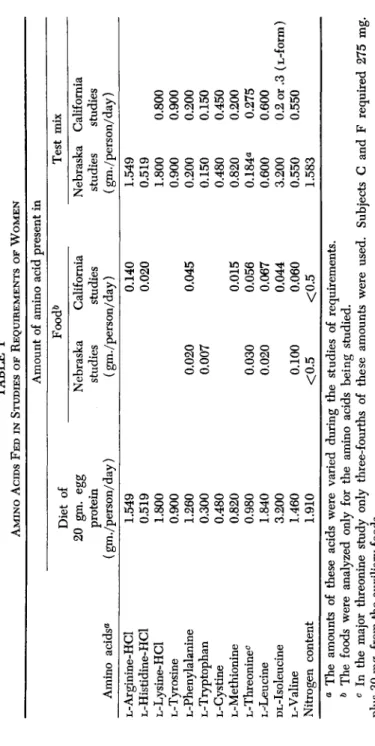
a. Amino Acids. The amounts of the 12 amino acids, which were fed daily in the same ratio as they occur in whole egg protein (Mitchell and Block, 1946), and the nitrogen supplied by them are shown in Table I. Egg protein was chosen as the reference or pattern for the amounts of the different amino acids to be fed because of its recognized high bio- logical value. The amino acids were tested for purity by nitrogen anal- ysis, optical rotation, and microbiological assay. The L-form of each of the acids except isoleucine was used; DL-isoleucine was used.
All of the amino acids except cystine, tyrosine, and the one being tested, were ground together in a ball mill. The mixture was then ana- lyzed for nitrogen to check its total nitrogen content against the sum of the results of the nitrogen analysis of each component.
The total daily nitrogen intake was 6.2 gm. for the first threonine study, 8.5 and 9.5 gm. for the valine study and for repeating certain levels of threonine, and 9.5 gm. for the last three studies. Glycine or glycine plus diammonium citrate was the chief source of nitrogen, and made up the difference between the nitrogen supplied by the 12 amino acids and the desired nitrogen intake.
The level of total nitrogen used in the California studies was 6-7 gm., and in the Wisconsin studies 10-11 gm. In the study of the sulfur- containing amino acids Swendseid supplied a portion of the amino acids from 2 gm. of nitrogen as peanut protein and added purified amino acids to bring the intake up to the equivalent of 20 gm. of egg protein.
Each subject's daily portion of the amino acid mixture was divided into three portions and one portion was fed at each of the three meals.
The appropriate amount was weighed into a tumbler and dissolved in water prior to mealtime. The amino acid being tested was in a separate solution and was added to this solution. The diammonium citrate solu- tion was also added to the dissolved acids. Because of their relative in-
TABLE I AMINO ACIDS FED IN STUDIES OF REQUIREMENTS OF WOMEN Amount of amino acid present in Amino acids0 L-Arginine-HCl L-Histidine-HCl L-Lysine-HCl L-Tyrosine L-Phenylalanine L-Tryptophan L-Cystine L-Methionine L-Threoninec L-Leucine DL-Isoleucine L-Valine Nitrogen content
Diet of 20 gm. egg protein (gm./person/day) 1.549 0.519 1.800 0.900 1.260 0.300 0.480 0.820 0.980 1.840 3.200 1.460 1.910
Food0 Nebraska California studies studies (gm./person/day)
Test mix Nebraska California studies studies (gm./person/day) 0.020 0.007 0.030 0.020 0.100 <0.5
0.140 0.020 0.045 0.015 0.056 0.067 0.044 0.060 <0.5
1.549 0.519 1.800 0.900 0.200 0.150 0.480 0.820 0.184« 0.600 3.200 0.550 1.583
0.800 0.900 0.200 0.150 0.450 0.200 0.275 0.600 0.2 or .3 (L-form) 0.550 a The amounts of these acids were varied during the studies of requirements. & The foods were analyzed only for the amino acids being studied. c In the major threonine study only three-fourths of these amounts were used. Subjects C and F required 275 mg. plus 30 mg. from the auxiliary foods.
solubility, cystine and tyrosine were mixed with a portion of the butterfat fed at each meal.
b. Foods. The basal ration included: (1) white sugar, cornstarch, especially prepared butterfat and corn oil made into wafers and pudding,
(2) butterfat, corn syrup, and jelly served as spreads on the wafers, and (3) white sugar and lemon juice mixed with the amino acid solutions.
Pure sugar candies and a bottled soft drink were used for additional calories.
Wafers or pudding or both supplied one-fourth to one-half of the calories in this semi-purified diet. The ingredients—cornstarch, sugar, butterfat, corn oil, and agar flakes, plus the special baking powder and part of the mineral supplement—could be mixed with a small amount of water and baked into a crisp wafer, or cooked with a large amount of water into a soft pudding. When a subject became tired of chewing the wafers, she could choose to have the caloric equivalent in pudding. Extra wafers and pudding without the baking powder and minerals were used to help raise caloric intakes to individual needs.
Small amounts of a few other foods—canned orange juice, tomato juice, grape juice, applesauce, peaches, pineapple, and raw carrots and lettuce—were added to improve the palatability of the diet. All of these were not fed in any one study but the foods (plus the liver extract) which were fed in each study were assayed microbiologically for the amino acid being measured. The auxiliary foods used with the Test Mix were assayed for all 5 of the amino acids being measured. Small amounts of decaffeinated coffee and weak green tea, which were low in nitrogen, were optional. The auxiliary foods used in each study supplied less than 5% of the total daily nitrogen intake. The individual foods as well as the chemicals were always analyzed for nitrogen before being fed.
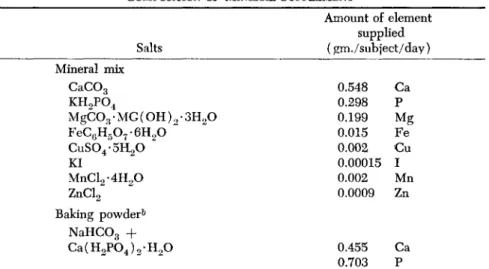
c. Supplements. The composition and daily intake of the mineral supplements are shown in Table II. Half of the daily portion of the daily portion of the mineral mixture was baked in the wafers or cooked in the pudding, and the other half was dissolved in the lemon juice. The baking powder was used to make the wafers porous but could be added to the pudding when no wafers were used. The mineral supplement used by Swendseid in the California studies supplied about 0.7 gm. phosphorus per person per day as compared with 1.0 gm. supplied by the supplement used in the other studies.
One multivitamin capsule was given daily and supplied the follow- ing: vitamin A 5000 USP units, vitamin D 500 USP units, and thiamine 3 mg., riboflavin 2.5, nicotinamide 20, pyridoxine 0.5, pantothenic acid 5, and ascorbic acid 50 mg. Further supplements included vitamin B12, 20 μ^ daily, added to the amino acid solution at each meal; liver extract,
484 RUTH M. LEVERTON
5 ml. containing 10 USP antipernicious anemia units, was given every third day during the first four studies. During the leucine study, how- ever, 0.5 gm. of liver concentrate 1:20 was given daily. Mixed tocopherol acetates, 38 I.U., were given every third day during the last two studies.
The vitamin concentrates which were used in the three locations dif- fered slightly but in each study supplied ample amounts of those known to be required.
TABLE II
COMPOSITION OF MINERAL SUPPLEMENT0
Amount of element supplied
Salts (gm./subject/day) Mineral mix
CaCOs
KH2P04
MgCOs· MG (OH) 2 · 3H20 FeC6H507-6H90 CuS04-5H20 KI MnCl2-4H20 ZnCl2 iking powder0
NaHCOs + Ca(H2P04)2H20
0.548 0.298 0.199 0.015 0.002 0.00015 0.002 0.0009
0.455 Ca P Mg Fe Cu I Mn Zn
0.703 P Ca
a Leverton et al. (1956a).
0 Rose et al. (1950) also included 2.69 gm. cornstarch.
d. Caloric Intake. Calculated daily caloric intakes during the ex- perimental periods ranged from 2,200 to 2,900, or from 35 to 54 calories per kilogram of actual body weight. The mean daily caloric intake for the 36 subjects was 2,500 calories or 42 calories per kilogram.
It was recognized that calorie requirements would probably be in- creased when the subjects were on the semi-purified diet. Therefore, much attention was given to preventing the subjects from losing weight, and also in preventing them from gaining more than 2 or 3 pounds in weight during the studies. The subjects were weighed daily before breakfast and caloric intakes were adjusted upward or downward, as seemed necessary. However, the caloric intake was kept as high as pos- sible without causing a gain of more than 2 or 3 pounds during any study; it was just under the amount that would have resulted in a definite gain. On the basis of previous experience we knew that this level of caloric intake was considerably higher than one which was just sufficient to prevent weight loss. Keeping the caloric intake this high
helped to prevent the oxidation of body tissue for energy and a replace- ment of this tissue with water without a noticeable change in body weight. However, maintenance of weight is not as sensitive a measure of calorie requirement as would be desirable for such rigidly controlled studies of nitrogen balance. A very practical aspect of this concern with energy intake in any metabolism study is the attitude of subjects them- selves. They will not volunteer for a study which will result in a weight gain over a period of 50 to 60 days. If they begin to gain weight during a study they become apprehensive and uncooperative, and may even withdraw from the study.
The mean caloric intake of the Nebraska subjects was higher than for the group of Wisconsin subjects who needed a mean intake of only 2286 calories, or 37.8 calories per kilogram to maintain constant weight.
In methionine-cystine studies at California, 7 of the 8 subjects main- tained weight during the period of the semi-synthetic diet on the same caloric intake as they had had during the preliminary period when or- dinary foods supplied a mean daily intake of 2030 calories or 34.6 calories per kilogram. One subject had required additional calories. During the study of isoleucine, however, the subjects' caloric intake had to be in- creased above what they had had in the preliminary period. During the semi-synthetic diet regimen their caloric intake averaged approximately 2520 calories per day or 43.6 calories per kilogram.
6. Metabolism Study and Nitrogen Balance
Urine and feces were collected for the entire period of study, from the first day of the preliminary period through the last day of the semi- purified diet. Urine was acidified, except during the tryptophan study, and refrigerated under toluene until a 24-hour collection was complete.
Nitrogen and creatinine determinations were done on the urine within 4 hours after the completion of each 24-hour collection.
Carmine was given to mark the feces when the level of amino acid intake was changed. The fecal collections were frozen until combined into a composite for a period, and then made into a digest with 20%
HC1 for nitrogen analysis.
Nitrogen was determined by the macro-Kjeldahl method (Assoc.
OfBc. Agr. Chemists, 1950, p. 13) and the ammonia was collected in boric acid (Markley and Hann, 1925). Creatinine was determined by the Folin method using picric acid (Assoc. OfBc. Agr. Chemists, 1950, p. 368), and the intensity of the color was measured photometrically.
Different subjects were not always on each level of amino acid intake the same number of days, but in general for 6 days or longer. The sub- jects who had the greatest daily variation in urinary nitrogen were kept
486 RUTH M. LEVERTON
on each level of intake longer than the subject who showed little varia- tion. In a few cases the time had to be reduced to less than 6 days be- cause symptoms of ill-health in the subjects were suspected, or too severe negative nitrogen balances occurred.
The nitrogen balance, or the intake minus the excretion, was cal- culated for each subject each day as the study progressed. The cumu- lative nitrogen balance of each subject, as she continued on a given in- take, was reviewed daily and used as the basis for deciding when to change the level of amino acid intake, and whether to increase or de- crease it. Because of the time lag in securing the values for the fecal nitrogen, the figures from the preceding period were used temporarily to add to the analyzed urinary values.
Because of the inherent variations, both human and technical, in human metabolism studies the Nebraska authors have preferred to define nitrogen equilibrium as a zone in which the excretion and intake closely approximate each other, rather than a single point at which they are numerically identical. In these studies of amino acid requirements, therefore, nitrogen equilibrium is defined as the zone in which the difference between the intake and excretion does not exceed ± 5%, i.e., the excretion is within 95-105% of the intake. Nitrogen loss from the body, ordinarily referred to as "negative balance," is considered to exist when the excretion is more than 105% of the intake, conversely, nitrogen retention or positive balance is considered to exist when the excretion is less than 95% of the intake. The reader, however, need not be limited by this interpretation. The results are presented in sufficient detail to permit him to use any criterion he prefers for judging nitrogen equilib- rium and minimum requirements.
Studying the amino acid requirements from the standpoint of the minimum amounts needed for maintaining nitrogen equilibrium was not meant to imply that nitrogen storage was not important for young women in the age range of many of these subjects. It seemed, however, that nitrogen equilibrium rather than nitrogen storage would come closer to being a common denominator to the nitrogen metabolism of all of the subjects.
B. RESULTS
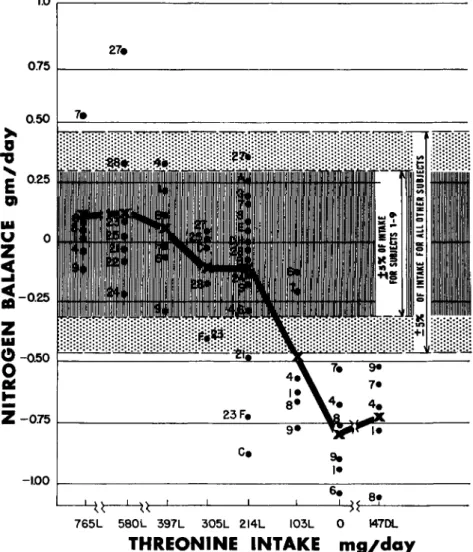
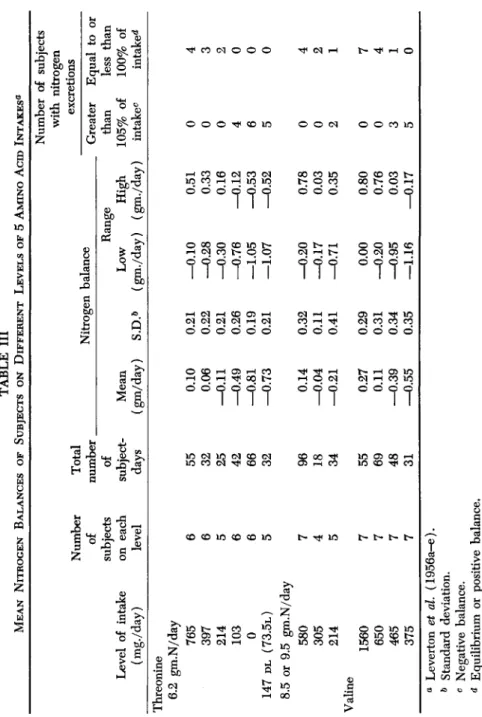
1. Threonine, Valine, Tryptophan, Phenylalanine, and Leucine The data for the five studies have been reported by Leverton et ah (1956a-e). The mean daily nitrogen balances of each subject on the various levels of intake of each of the amino acids studied are charted in Figs. 1 to 5. The performance of each subject may be followed as her intake was changed from one level to another. The solid line joins the
means of the balances of all the subjects on each level and denotes the increase in nitrogen loss with decreasing intakes. The zone of equihbrium ( ± 5% of the intake) is shown by the shaded area. The balances of subjects A to H who were on the Test Mix are shown on each graph for the appropriate intake of each of the amino acids studied.
The data have been summarized in Table III to show the mean daily
I
4 e i H. 1 . ί^£_??
765L 580L 397L 305L 2I4L I03L 0 I47DL
THREONINE INTAKE mg/day
FIG. 1. Threonine intakes and nitrogen balances of 21 subjects for 467 subject- days. Each subject is identified by her code which appears beside her retention for each level on which she was studied. X = mean balance of all subjects on each level of intake. Intake includes 30 mg./day supplied by auxiliary foods. (From Leverton et al, J. Nutrition 58, 71, 1956.)
488 RUTH M . LEVERTON
nitrogen balance, the standard deviation and the range in the balances for each group of subjects on each level of these different amino acids.
Also shown are the number of subjects with nitrogen excretions which are: (1) greater than 105% of the intake, and (2) greater than 100%
of the intake.
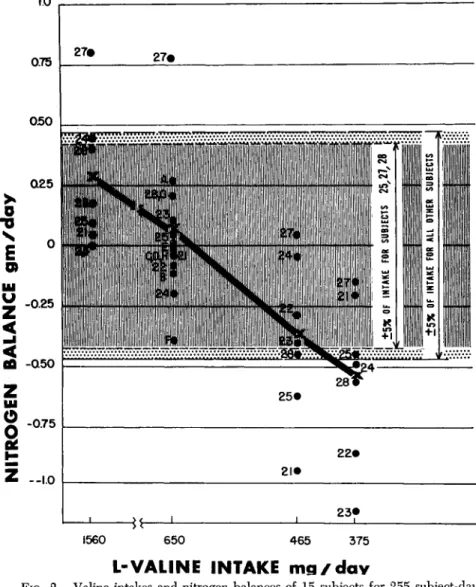
1560 650 465 375
L-VALINE INTAKE m g / d a v
FIG. 2. Valine intakes and nitrogen balances of 15 subjects for 255 subject-days.
Each subject is identified by her code which appears beside her retention for each level on which she was studied. X = mean retention of all subjects on each level of intake. Intake includes 100 mg./day supplied by auxiliary foods. (From Lever- ton et al, J. Nutrition 58, 86, 1956.)
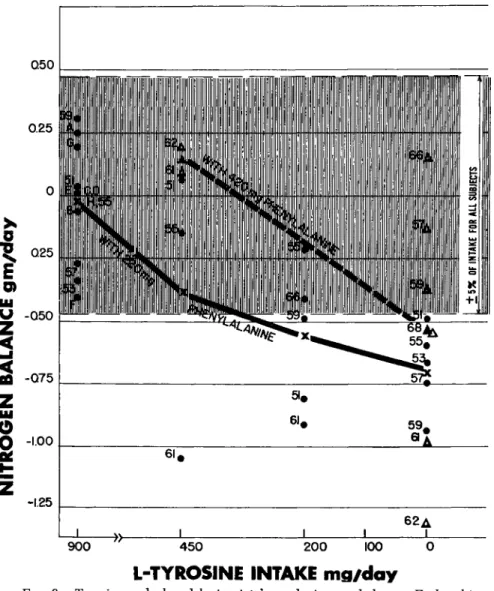
The results of an auxiliary study of different levels of tyrosine and phenylalanine are shown in Fig. 6 and Table IV.
In the Nebraska studies two features of the nitrogen balances of the subjects were considered in suggesting tentative minimum requirements for each of the 5 amino acids studied: (1) whether the nitrogen balances of the subjects were in the zone of equilibrium (or positive), and (2) whether the subjects had significantly better nitrogen balances when the next higher level of intake was fed. Table V has shown the nitrogen
0.75
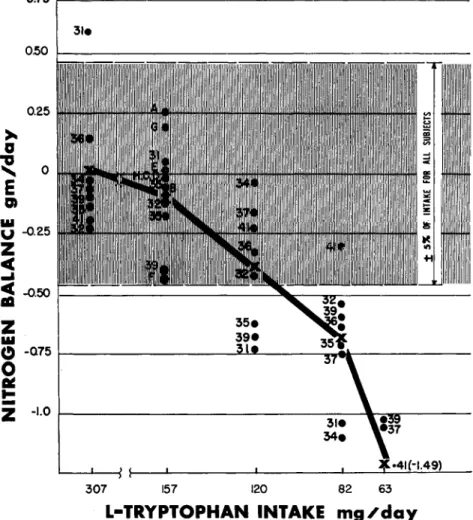
L-TRYPTOPHAN INTAKE m g / d a y
FIG. 3. Tryptophan intake and nitrogen balance. Sixteen subjects for 285 subject-days. Each subject is identified by her code which appears beside her re- tention for each level on which she was studied. X = mean retention of all sub- jects on each level of intake. Intake includes 7 mg./day supplied by auxiliary foods.
(From Leverton et al., J. Nutrition 58, 222, 1956.)
490 KUTH M. LEVERTON
0.50
0.25
σ
Ε
111 Ο)
U
Ζ
<
-0.25
-0.50
Ο -0.75
2
Ζ
-LOO-1.25
WITH NO TYROSINE^ ^ ^ j k
§7fr
* 5 3 · \
1
§eV
6IA 59A
51·
62Δ
1280 620 420 320 220 J_ _L
120 70
L-PHENYLALANINE INTAKE mg/day
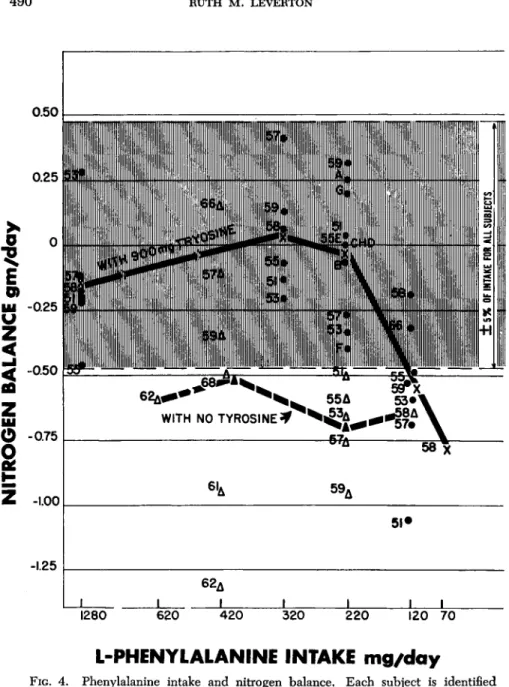
FIG. 4. Phenylalanine intake and nitrogen balance. Each subject is identified by her code which appears beside her retention for each level on which she was studied. Intake includes 20 mg./day of phenylalanine from auxiliary foods.
• Represents subjects receiving 900 mg. of tyrosine, mean = X. Δ Represents subjects receiving no tyrosine, mean = A. (From Leverton et al., J. Nutrition 58, 344, 1956.)
balances of the group and the number of subjects in nitrogen equilib- rium. Table V shows (1) the level of intake of each acid which yielded a significantly better mean daily nitrogen balance than the levels below it, and (2) the level above which there was no significantly better mean daily nitrogen balance.
When the subjects were receiving 214 mg. threonine daily, the mean nitrogen balance was significantly better than when the intake was 103
0.50
0.25
D
£
D) HIU
Z
<<
00 0.25
-0.50
-Q75
o o
at 1.00
-1.25
6 2 . 38»
69· 6 5 γ X 63#
6 I.
I860 -> >- 710 620 480 370 270 170
L-LEUCINE INTAKE mg/day
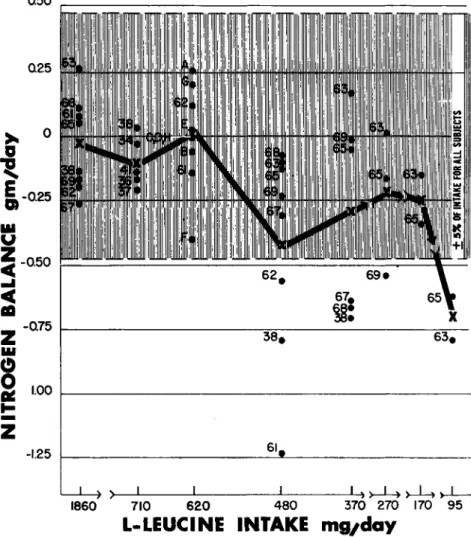
95FIG. 5. Leucine intake and nitrogen balance, 13 subjects for 334 subject-days.
Each subject is identified by her code which appears beside her retention for each level on which she was studied. X = mean retention of all subjects on each level of intake. Intake includes 20 mg./day supplied by auxiliary foods. (From Lever- ton et al., J. Nutrition 58, 358, 1956.)
492 RUTH M . LEVERTON
mg.; but when the intake was 305 mg. daily, the balance was not sig- nificantly better than on an intake of 214 mg. However, when 8 subjects were placed on the Test Mix which supplied 214 mg. threonine, 2 sub- jects were in negative balance until their threonine intake was increased to 305 mg. For this reason 305 mg., rounded to 310 mg., rather than 214
L-TYROSINE INTAKE mg/day
FIG. 6. Tyrosine and phenylalanine intake and nitrogen balance. Each subject is identified by her code which appears beside her retention for each level on which she was studied. · Represents subjects on 220 mg. of phenylalanine, mean = X.
Δ Represents subjects on 420 mg. of phenylalanine, mean = A. (From Leverton et al, J. Nutrition 58, 349, 1956.)
TABLE III MEAN NITROGEN BALANCES OF SUBJECTS ON DIFFERENT LEVELS OF 5 AMINO ACID INTAKES0 Level of intake (mg./day) Threonine 6.2 gm.N/day 765 397 214 103 0
147 DL (73.5L) 8.5 or 9.5 gm.N/day 580 305 214 Valine 1560 650 465 375
Number of subjects on each level
6 6 5 6 6 5 7 4 5 7 7 7 7
Total number _ of subject- days
55 32 25 42 66 32 96 18 34 55 69 48 31
Mean (gm/day) 0.10 0.06 —0.11 —0.49 —0.81 —0.73 0.14 —0.04 —0.21 0.27 0.11 —0.39 —0.55
Nitrogen S.D.» 0.21 0.22 0.21 0.26 0.19 0.21 0.32 0.11 0.41 0.29 0.31 0.34 0.35
balance Range Low (gm./day) —0.10 —0.28 —0.30 —0.76 —1.05 —1.07 —0.20 —0.17 —0.71 0.00 —0.20 —0.95 —1.16
High (gm./day) 0.51 0.33 0.16 —0.12 —0.53 —0.52 0.78 0.03 0.35 0.80 0.76 0.03 —0.17
Number of subjects with ] nitrogen excretions Greater than 105% of intake0
0 0 0 4 6 5 0 0 2 0 0 3 5
Equal to or less than 100% of intake«*
4 3 2 0 0 0 4 2 1 7 4 1 0
a Leverton et al. (1956a-e). h Standard deviation. c Negative balance. d Equilibrium or positive balance.
TABLE III (Continued) CO Level of intake (mg./day)
Number of subjects on each level
Total number of
subject- day
s
Number of subjects with nitrogen excretions Nitrogen balance Mean (gm/day) S.D.»
Range Low High (gm./day) (gm./day)
Greater than 105% of intake0
Equal to or less than 100% of intake** Tryptophan 307 157 120 82 63
Phenylalanine (With 900 mg. tyrosine) 1280 320 220 120 70 (With no tyrosine) 620 420 220 120
6 6 5 7 1 1 6 5 1
56 38 73 56 11
0.01 —0.13 —0.39 —0.70 —1.19
0.26 0.16 0.26 0.26 0.26
—0.21 —0.39 —0.73 —1.10 —1.49
0.59 0.05 —0.04 —0.30 —1.02
0 0 3 7 3
45 38 43 56 5 5 38 34 7
—0.15 0.03 —0.05 —0.56 —0.76 —0.59 —0.52 —0.69 —0.63
0.24 0.22 0.26 0.28 0.46 0.34 0.54 0.17 0.46
—0.45 —0.21 —0.33 —1.07 —1.17 —1.00 —1.31 —0.94 —1.53
0.27 0.41 0.32 —0.18 0.02 —0.17 0.16 —0.50 —0.13
0 0 0 5 1 1 3 5 1
1 3 3 0 0 0 1 0 0
H X
3
o 2TABLE III (Continued) Level of intake (mg./day) Leucine 1860 710 620 480 370 270 170 95
Test mix (Minimum of all 5 acids)
Number of subjects on each level
8 5 2 8 6 3 2 2 8
Total number of subject- days
57 39 12 88 43 21 11 11 52
Mean (gm/day) —0.03 —0.12 —0.01 —0.43 —0.32 —0.23 —0.25 —0.71 0.00
Nitrogen balance Range Low High S.D.0 (gm./day) (gm./day) 0.18 0.20 0.52 0.41 0.39 0.28 0.13 0.12 0.19
—0.26 —0.27 —0.14 —1.35 —0.70 —0.54 —0.34 —0.79 —0.40
0.25 0.46 0.12 —0.08 0.17 0.01 —0.15 —0.62 0.25
Number of subjects with nitrogen excretions Greater than 105% of intake0
0 0 0 3 3 1 0 2 0
Equal to or less than 100% of intake0
4 1 1 0 1 1 0 0 6
TABLE IV MEAN NITROGEN BALANCES OF SUBJECTS ON DIFFERENT LEVELS OF TYROSINE AND PHENYLALANINE INTAKE« Number of subjects with nitrogen excretions Equal to or Greater less than than 105% 100% of of intake0 intake^
Level Level of of L-phenyl- L-tyro- alanine sine mg./day) (mg./day)
Number of subjects on each level
Total number of subject- days
Nitrogen balance Range Mean (gm./day) S.D.* Low High (gm./day) 220 420 220
200 450 450
5 2 3 28 10 15
—0.56 0.12 —0.38
0.29 — 0.59
—0.89 0.06 —1.05
—0.21 0.18 0.06
3 0 1 0 2 1
« Leverton et al. (1956d). ft Standard deviation. c Negative balance. d Equilibrium or positive balance.
s 9
2mg. threonine is the amount which has been suggested as a tentative minimum requirement for young women similar to those studied here.
In the case of valine, tryptophan, phenylalanine with tyrosine, and leucine, the level of intake, which resulted in a significantly better nitro- gen balance than the levels below it, was also the level above which there was no significantly better balance. These levels were 650 mg.
valine, 157 mg. tryptophan (rounded to 160 mg.), 220 mg. phenylalanine with 900 mg. tyrosine, and 620 mg. leucine. They have been suggested as tentative minimum requirements for young women.
TABLE V
STATISTICAL SIGNIFICANCE OF DIFFERENCE IN NITROGEN BALANCE ON DIFFERENT INTAKES
Amino acid Threonine Valine Tryptophan Phenylalanine
with 900 mg. tyrosine Leucine
Levels of amino acid intake (mg./day) between which differences in
Significant 214 and 103 650 and 465 157 and 120 220 and 120 620 and 480
5%«
1%
1%
1%
1%
nitrogen balances were:
Not significant 214 and 305 or higher 650 and 1580
157 and 307
220 and 320 or higher 620 and 710 or higher
a Level of probability.
2. Isoleucine
The results of the study of isoleucine (Swendseid and Dunn, 1956) are shown in Table VI in terms of the mean daily nitrogen balances of each group of subjects in each level of intake, the range in nitrogen balances, and the number of subjects in equilibrium. The amounts of isoleucine required for nitrogen equilibrium varied from 250 to 450 mg.;
3 of the subjects required 250 mg., 3 required 350 mg., and 1 required 450 mg. When these figures are evaluated in the same way as the Nebraska results, the highest figure of 450 mg. isoleucine may be sug- gested as the minimum requirement for young women.
3. Lysine
In the Wisconsin studies (Jones et at, 1956) 14 women were studied on different levels of lysine intake and the results for the last 4 days of each intake period are summarized in Table VII. Daily intakes of 250 mg. and below resulted in consistently negative balances among the subjects, although in a few cases the nitrogen excretion was not more than 105% of the intake. On a lysine intake of 400 mg. only 1 subject was in serious negative balance and she required 500 mg. for equilibrium.
Nitrogen equilibrium or storage occurred on intakes above 500 mg. ex-
498 RUTH M. LEVERTON
cept for subject 8. Her nitrogen balance was no better on an intake of 640 mg. than on 250 mg., —0.40 gm., and —0.38 gm., respectively, both less than 5% of the intake. Her balance rose to —0.12 on an intake of 1600 mg.
TABLE VI
MEAN NITROGEN BALANCES OF SUBJECTS ON DIFFERENT LEVELS OF METHIONINE AND ISOLEUCINE INTAKES«
Level intake of (mg./day) Methionined'e
800 150 250 350 Isoleucine/
1330 150 50 250 350 450
Number subjects of on each
level 8 8 3 1
7 7 3 7 4 1
Nitrogen balance Mean
(gm./day) 0.05
—0.14 0.14 0.09 0.07
—1.08
—0.32
—0.49
—0.07
—0.18
Range Low (gm
—0.18
—0.70
—0.57
— 0.18
—1.49
—0.66
—1.18
—0.66*
—
High ./day) ~
0.43 0.31 0.61
— 0.63
—0.81
—0.06 0.06 0.36
—
Number of subjects with
nitrogen excretions Greater
than . 105%
intakeof 6
3 0 0 1
0 7 4 1 0 1
Equal to or less
than 100%
intakeof 0
3 4 2 1
3 0 0 1 0 2
<* S wendseid et al. (1956).
δ Negative balance.
c Equilibrium or positive balance.
d All diets included 200 mg. L-cystine daily.
e Number of days on each intake varied from 6 to 12.
/ Number of days on each intake varied from 6 to 12 for the 1330-mg. level to 3 or 4 for the 50-mg. level.
9 This is the subject who was next given a 450-mg. intake.
Clark and her co-workers (1957) studied the lysine requirements of 5 women and 5 men, on a diet in which approximately one-half of the daily nitrogen intake of 9.0 gm. was supplied by wheat flour, cornmeal, and a few fruits. Purified amino acids were added to make the total intake of essential amino acids (plus arginine, histidine, cystine, and tyrosine) equal to the amounts present in 20 gm. whole egg protein, and diammonium citrate was used as the source of additional nitrogen.
The amount of lysine fed was varied from 1500 mg., the amount in
20 gm. whole egg protein, down to 470 to 510 mg. which was present in the unsupplemented basal diet. The subjects (who ranged from 23 to 29 years of age) were treated individually in regard to the quantity of lysine tested in different 6-day periods and the results are reported only for the minimum levels of intake on which the subjects maintained nitrogen equilibrium. Equilibrium has been defined by Clark as
TABLE VII
MEAN NITROGEN BALANCES OF SUBJECTS ON DIFFERENT LEVELS OF LYSINE INTAKE«
Level intake of (mg./day) Lysine
1600 100 180 220 250 400 500 640
Number subjects of on each
level 14 6
5 5 7 9 2 5
Nitrogen balance6
Mean (gm./day)
0.45
—0.62
—0.84
—0.36
—0.46 0.00 0.04 0.00
Range Low (gm
—0.12
—0.88
—1.42
—0.53
—1.16
—0.79 0.00
—0.40
High
•/day) 1.27
—0.23
—0.41
—0.80
—0.04 0.59 0.07 0.29
Number of subjects with
nitrogen excretions Greater
than 105%
intakeof 0
0 6 4 1 3 1 0 0
Equal to or less
than 100%
intake** of
13 0 0 0 4 0 2 4
« Jones et al. (1956).
& These figures are the means for the "final 4 days" on each lysine intake.
c Negative balance.
d Equilibrium or positive balance.
". . . when nitrogen balance was at or near zero." The intakes and nitro- gen balances of the 5 women subjects are given in Table VIII. The amount of lysine required by these women varied from 500 to 700 mg.
daily. Three of the men subjects required more than 700 mg. lysine daily. The relationship of lysine need to body weight surface area which was noted in the report has not been found in subsequent studies (Clark, 1958).
On the basis of the results of the Wisconsin studies of lysine, 500 mg.
daily may be considered tentatively as adequate for nitrogen equilibrium and referred to as a suggested minimum requirement for normal women.
This amount would be raised to 700 mg. on the basis of the results of Clark. However, use of the results of the latter for comparison and
5 0 0 RUTH M. LEVERTON
interpretation is limited because the nitrogen balances on lower levels of intake were not reported.
4. Methionine
In the studies of Swendseid et al. (1956) four levels of methionine were fed and at each level 200 mg. cystine was included in the mixture of purified amino acids. The nitrogen balances are shown in Table VI.
A total methionine-plus-cystine intake of 350 mg. or less was suiBcient for 5 subjects; 450 mg. was sufficient for 2 subjects; but 1 subject re- quired 550 mg. for nitrogen equilibrium.
TABLE VIII
MINIMUM DAILY AMOUNTS OF LYSINE THAT MAINTAINED NITROGEN EQUILIBRIUM IN 5 W O M E N «
Subject EG VS DB GM RS
Lysine intake (mg./day)
500 570 620 670 700
Days on this
intake 12 6 18 24 6
Mean nitrogen balance (gm./day)
0.22 0.04 0.15 0.05 0.30
" Clark etal. (1957).
Reynolds and her associates (1958) also fed various levels of methi- onine and cystine to 21 women, 19^64 years of age, some of whom were also subjects for the study of lysine requirements. When the daily cystine intake was 500 mg., an intake 150-180 mg. of methionine resulted in nitrogen storage in 4 of 7 women, and the total nitrogen excretion of the other 3 women did not exceed 105% of the intake. However, a methionine intake of 290 mg. with 500 mg. cystine resulted in slight nitrogen reten- tion in all of the 11 subjects on this level.
A total of 290 mg. of methionine plus 10 mg. cystine seemed to be marginal for nitrogen equilibrium for the group of 12 subjects on this intake. When 6 of these subjects were given 290 mg. methionine plus 260 mg. cystine their nitrogen balances ranged from 0.06 to 0.83 gm.
daily and averaged 0.35 gm.
The results of both the California and Wisconsin studies lead to the suggested minimum requirement of 550 mg. of the sulfur-containing amino acids.
5. Test Mix
In Table IX are given the nitrogen balances for the 8 Nebraska sub- jects who were studied on the Test Mix to determine the adequacy of
the tentative minimum amounts, when fed simultaneously, of 5 of the essential amino acids, threonine, valine, tryptophan, phenylalanine with tyrosine, and leucine. Also given are the data for the 7 subjects in the California study who had minimum amounts of all 8 of the essential amino acids fed at the same time.
TABLE IX
NITROGEN BALANCES OF YOUNG W O M E N ON MINIMUM AMOUNTS OF THE ESSENTIAL AMINO ACIDS«
Nebraska Subject
A B C D E F G H Mean
subjects
Nitrogen balance (gm./day)
0.25
—0.06 0.00 0.00 0.02
—0.40 0.20 0.00 0.00
California Subject
2 1 3 4 6 7
subjects
Nitrogen balance (gm./day)
—0.04
—0.20
—0.35
—0.25
—0.15
—0.10
—0.15
a The amino acid intake of the subjects is shown in Table I.
The general condition of nitrogen equilibrium which existed in all of the subjects indicates that the minimum amount of the essential amino acids present in the Test Mix did not limit the use or increase the re- quirement of the other essential amino acids to an extent that could be measured by the nitrogen balance technique.
6. Symptoms Associated with Low Intakes of Amino Acids In addition to the negative nitrogen balances there were some in- dications of suboptimum health associated with low intakes of certain amino acids. In the Nebraska studies the subjects did not know their exact threonine intakes, when the intakes were changed, or that there might be any symptoms associated with an inadequate intake. They did not attribute fatigue or other minor ailments to the diet.
Threonine. The subjects neither displayed nor reported any acute or specific symptoms which suggested an inadequate intake of a dietary essential, even when 5 subjects had no threonine for 10 days and 1 sub- ject had none for 16 days. Occasionally appetites lagged, or the food was hard to get down, or a subject felt nauseated, but these were not severe enough to interfere with consumption of the daily ration of food and chemicals.
Valine. All of the subjects experienced some nausea and loss of