Advances in Avalanche Forecasting Podbanské 2012
Weather, terrain, vegetation and snowpack based avalanche risk model
Anna Seres1,*
1 Institute of Geography, University of Miskolc, Hungary
INTRODUCTION
Avalanche accidents become more and more frequent with the increasing number of people going for winter outdoor activities to the mountains. Daily updated danger maps are available for most of the mountains which get a lot of tourism in the winter. However these maps only indicate a general level of avalanche danger, sometimes giving some more details on the height and aspect where the danger is higher. These maps usually work as a go/not go to that specific mountain decision aid and they are not sufficient for proper and safe route planning. Route planning has to be done on site, which requires experience and knowledge of the area.
AIMS
My aim is to prepare a model which creates daily updated, very detailed, good resolution avalanche risk maps, showing the actual risk of the snowpack in each valley, slope, ridge, etc, giving more details to the present danger maps, thus making it easier for the general public to avoid the dangerous areas.
STUDY SITE
The area of my study is the middle part of the Low-Tatras in Slovakia, around the peak Chopok. The area has widespread tourism with several ski slopes, a huge development project is being carried out with new lifts at the moment, and perfect slopes for ski touring.
MATERIALS
Avalanche danger basically depends on four factors: weather, terrain, snowpack and vegetation cover/surface type. The model is developed based on data from the winter of 2009/2010. Weather and snowpack data:
minimum and maximum temperature, wind speed, wind direction, cloudiness, humidity, new snow height, new snow density (from snow height and water equivalent), snowpack height and snow crystal type was provided by SLP (Avalanche Prevention Centre of Slovak Mountain Rescue Service) and SHMÚ (Slovak
Hydrometeorological Institute). Weather and snowpack data was available for the maximum of 6 meteorological stations on the area, most type of data only for 2-4 stations. DEM was created by digitizing the contour lines of 1:10000 topographic maps with resolution of 10m.
Vegetation was defined by supervised classification of Landsat images. Results are validated by snow profile data, taken approximately weekly from the area.
METHODS
The snowpack model follows the development of the snowpack from the first snowy day to the spring melt. The development of the snowpack is estimated based on weather and terrain data.
Minimum, maximum temperature and wind is interpolated from point measurements to the whole area. In the model each new snowfall exceeding 5 cm, each day with strong wind, depositing significant amount of snow or each day with surface hoar or ice formation results a new layer in the snowpack. Each layer has new snow height, new snow density and snow crystal type as input starting attributes. These properties change from day to day according to the input weather and terrain parameters and snow crystal size and layer stability is added.
The model creates weak layers in the snowpack at locations depending on weather and terrain, but if these weak spots really mean avalanche danger or not is decided by the model by further evaluation based on terrain parameters and vegetation cover. The model’s input requirements are: weather and new snow data, DEM derived terrain parameters and vegetation cover/surface type from remotely sensed data. It creates intermediate weather and snowpack maps, interpolating from measures point data.
The snow stability map, showing the weak layers, together with the potentially dangerous areas located by terrain and vegetation cover, at the end create a daily updated, detailed avalanche risk map, which can be used by itself or can make the existing, general danger level more detailed. (Figure 1.)
FIGURE 1. Flowchart of the avalanche risk model. Paralelograms show constants, flags show maps and rectangles show processes. White flags provide explanation.
Advances in Avalanche Forecasting Podbanské 2012
RESULTS Weather module
Temperature
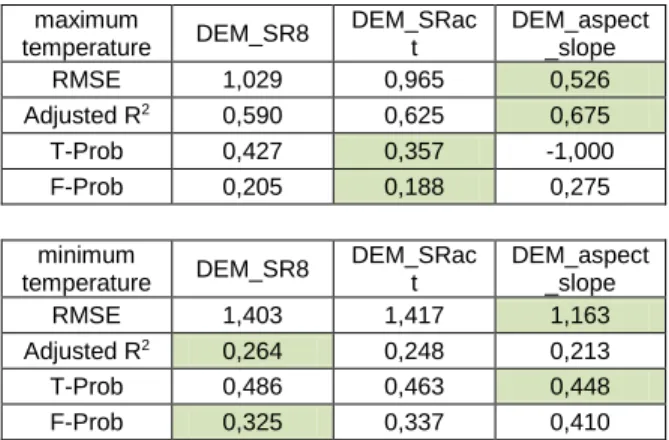
Temperature maps will be used as input for snowpack compaction, crystal metamorphism and snow stability equations. Minimum and maximum temperature was calculated for each day using multiple linear regression. The explanatory variables are DEM and solar radiation (SR), this latter calculated based on the cloudiness in the morning of the actual day (SRact). The dependent variable is the minimum/maximum temperature for the 5 weather stations. Solar radiation was calculated with the solar radiation tool of ArcGIS for each day, taking the azimuth, altitude, proportion of disuse radiation and transmissivity of air into account. Regression was also solved for variable combinations: DEM + SR8(cloudy) and DEM + slope + aspect, this latter calculated for each day, taking the azimuth and altitude of the warmest time of day into account. Pearson’s correlation and statistical tests showed better results for the DEM + slope + aspect regression, than for the DEM + SR regressions (Table 1-4.), but these numbers cannot be trusted as there are only 5 points to calculate from.
TABLE 1-2. Values of statistical test for different variable combinations(1.maximum, 2. minimum temperature). Cells in green mark the best results.
maximum
temperature DEM_SR8 DEM_SRac t
DEM_aspect _slope
RMSE 1,029 0,965 0,526
Adjusted R2 0,590 0,625 0,675
T-Prob 0,427 0,357 -1,000
F-Prob 0,205 0,188 0,275
minimum
temperature DEM_SR8 DEM_SRac t
DEM_aspect _slope
RMSE 1,403 1,417 1,163
Adjusted R2 0,264 0,248 0,213
T-Prob 0,486 0,463 0,448
F-Prob 0,325 0,337 0,410
TABLE 3-4. Pearson’s correlation vales for different variables
maximum
temperature DEM SR8 Sract aspect slope Pearson'
correlation 0,820 0,730 0,573 0,491 0,295
minimum
temperature DEM SR8 Sract aspect slope Pearson'
correlation 0,651 0,569 0,412 0,331 0,258
By looking at the map and checking its maximum, minimum values and the spatial distribution of the temperature, the DEM + SRact combination seemed to be the best version (Figure 2.). The DEM + slope + aspect also showed good maximum and minimum values, but the spatial distribution was not correct, as it does not show the shadowing effect of the surrounding terrain.
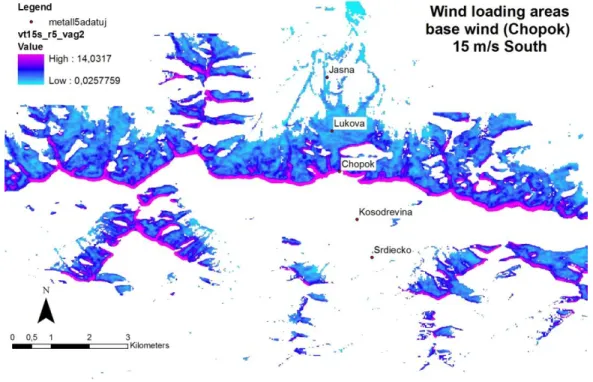
Wind
Wind can redeposit huge amounts of snow, adding an extra load to the snowpack and potentially trigger avalanches. Wind is measured in every 10 minutes on 2 automatic weather stations, Jasna and Chopok. Only wind speeds above 10 m/s are considered, as that is the approximate threshold of drifting snow (McClung et al. 1999.). These are then averaged for different directions for each day. These wind speeds are interpolated on macro-scale by the empirical calculation of Hellman exponent in the Hellman equation by Spera et al. 1979 and modified on a micro scale by the slope, aspect and curvature based formulas of Liston et al.
(2007). Areas with sudden change in wind speed are the most prone to gather snow, so these were selected by calculating a range of 5 cells radius on wind speed. Wind drift is considered only at locations with grass (or rocks) or dwarf pine vegetation. So the wind speed map is masked with the vegetation (Figure 2.).
Snowpack module
The snowpack module of the model has not been finalized yet, results are expected later this the year.
New snow height, density
Newly fallen snow gets denser and looses height with time. This process is the fastest in the first few days and it depends on temperature and later, the weight of the snow above. Snow compaction is calculated by the formula of Flerchinger at al. (1989) and McConkey (1992).
FIGURE 1. Maximum temperature map by regression with DEM and solar radiation, based on the cloudiness in the morning of the actual day
FIGURE 2. Possible wind loading areas for wind speed Chopok 15 m/s, south (magenta shows areas with highest wind loading)
Advances in Avalanche Forecasting Podbanské 2012
Snow crystal type and size
Metamorphism of the snow mainly depends on the temperature gradient in the snowpack, which is the function of snowpack height and surface temperature. Snowpack height is calculated as the sum of height of snow layers, bottom temperature is considered 0°C, snow surface temperature is taken the same as air temperature. equi-temperature (ET) metamorphism takes place when the temperature gradient of the snow layer is less than 10°C/m. During ET metamorphism, the branches, corners of the snow crystal disappear ansd rounded grains bonded by small necks develop. This snow type is not likely to collapse and cause avalanche. Temperature gradient (TG) metamorphism takes place at temperature gradients above 10°C/m. It produces angular, later hollow, cup-like big crystals, which easily collapse under the weight of above snow layers and produce avalanches. Melt-freeze (MF metamorphism occurs when the temperature in the day is high enough for the snow to melt and cold enough in the night to freeze. In the day it produces weak, unstable layer, while it becomes strong and stable in the night. Physical process based equations describing the exact way and extent of crystal growth require input parameters that can only be measured in laboratories, so it cannot be applied to my model. Instead, the simple, empirical formula of Brun et al, estimating the dendricity and sphericity of the snow crystals, used in the Swiss SNOWPACK model (Lehning et al. 2002) will be used in my model, modified with empirical relations from snowpack data of the area. Surface hoar and ice layers will be generated on the surface at appropriate weather conditions. For surface hoar it means relative humidity above 70%, wind speed of 1-2 m/s, surface temperature of 0--4°C or -12--21°C, clear sky in the night for significant outgoing radiation, northerly aspect, convex forms (McClung 1999). Ice layer is formed in case of persisting melt-freeze changes or rain on snow.
Snow stability map, weak layers
Each snow layer has the following attributes:
snow crystal type (dendricity, sphericity), snow crystal size, ice (yes/no). These attributes are calculated for all new snow, old snow layers, wind deposited layers, surface hoar and ice layers. The attributes are updated daily according to weather and terrain data. The
stability of the snow layer is defined based on these attributes. Weak layers, low stability values are defined in case of large temperature gradient crystals, very wet snow, buried ice layer, buried graupel layer, buried surface hoar layer (depending on the weight of the snowpack above). Stability of weak layers also depend on temperature and aspect, as for example a buried ice layer on a southerly slope is more dangerous if the temperature is high and melting occurs, than when temperature is low.
Terrain module
The result of the terrain module at the end modifies the snow stability layer according to how good the terrain is for releasing avalanches.
Potential avalanche release areas were defined by slope and curvature.
Slope
Typical slope angles for avalanche starting zones are between 25-60°. In the most cases this is true for the Low-Tatras as well. The maximum slope angle on the study site is 58°.
Biggest avalanches can form between slope angles 30-50°. Snow slides easier as the slope becomes steeper, so I considered a linear relationship between slope angles and avalanche danger on the area. As there were only few pixels of high values, I stretched the raster between 3 standard deviations to get the middle 99,7% of the data. The slope raster then was normalized between 1 and 10.
Profile curvature
Avalanches form easier on areas where the snowpack has no support from below, so around inflection lines, where the profile curvature changes from the convex of the ridge to the concave of the valley (Ciolli et al. 2000). The avalanche prone northern slopes of the Low- Tatras fall suddenly behind the main ridge and the avalanche starting zones in the southern side are found in valley heads. These cases rarely coincide with the inflexion line, so profile curvature was not included in the calculations.
Plan curvature
Avalanches in the southern slopes of the Low- Tatras usually have confined path and the starting zones are usually found in valley heads.
These areas can be located with plan curvature.
Concave forms, marked with negative values are the most likely to gather snow and slide off on
the curvature raster, so first I calculated the inverse of the scale and then shifted the beginning to zero. Then it was stretched between 3 standard deviations from the mean and normalized between 1 and 10. This way the slope and curvature could be compared.
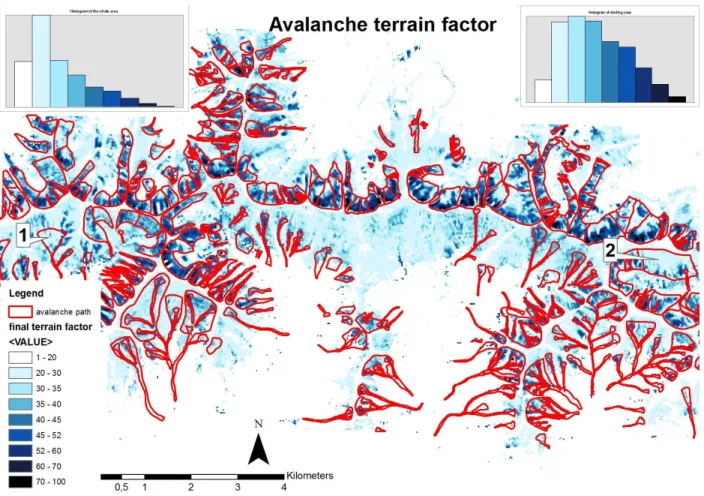
Avalanche terrain factor
Slope and plan curvature effect the location of the starting zones in about equal degree. So I multiplied the two before mentioned maps to get the final possible starting zones map. The result shows the unconfined avalanche paths of the northern steep slopes confined avalanche path in the valley heads of the south. Avalanche release areas were only considered at grass,
rock or dwarf pine covered areas, so the result was masked with landuse/vegetation. The histogram shows higher values under the starting zones, than on the whole area. Two bigger avalanche starting zones seems not to be located correctly at first sight. If looking at them closer, one can see, that the release areas in these cases are probably not the top of the paths, but the east side in the first case (1) and the bottom in the second case (2). In both cases the slide started here, but after the snow slid off from these areas, the snowpack above lost its support and the whole above lying snowpack slid off.
FIGURE 3. Avalanche terrain factor. Darker colors show higher risk of potential snow slide. Red: avalanche path according to the avalanche cadastre. Upper left corner: histogram of terrain factor for the whole area, upper right: histogram for the starting zones.
Numbers show two avalanche paths with release areas not at the top of the path.
Advances in Avalanche Forecasting Podbanské 2012
Vegetation module
Vegetation/land use is important because rocks, trees anchor the snowpack and do not let it slide. Even a very shallow snowpack can slide off of areas covered with grass, herbaceous vegetation or fine scree. Snow usually only slides off of areas with dwarf pines, after the pines are buried at snowpacks about 1 meter deep. Mature forests rarely make it possible for avalanches to start. Threshold snowpack heights can be given for areas with different vegetation to decide if avalanches can occur there or not.
Land use maps were created by supervised classification of a combined Landsat and ASTER image. Landsat images were taken from a spring and an autumn date to better show the different reflectance of different vegetation types. NDVI was calculated for both dates and all layers were stacked. The 30m resolution (same as Landsat)
ASTER DEM was downloaded for the same area, the whole Low-Tatras, slope and aspect was calculated and the DEM, slope and aspect were also layer stacked behind the Landsat layers. This way when delineating the training areas, I not only show the typical reflectance values, but also the typican elevation, slope and aspect, which makes the classification more precise. Typical areas for 18 classes were delineated as training areas. Classes were merged into 3 final classes based on object height. The 3 final classes are: grass / fine scree / plough land; deciduous / coniferous forests;
dwarf pines (Figure 4.). Threshold snowpack height values for these classes are: 0,2m for grass/scree/plough land, 1m for dwarf pine and snow is not allowed to slide in mature forests.
FIGURE 4. Vegetation map of the study area
Avalanche risk map
The avalanche risk map is the final outcome of the model. The snow stability / weak layers, the possible avalanche release areas, the vegetation cover are combined to produce the final avalanche risk map. It can be used by itself or to make the existing avalanche forecast more detailed. The risk map is validated by snow profile data taken about once a week of the area.
CONCLUSION
The snow stability, potential release areas, vegetation cover based risk map would be updated daily to follow the changes in the snowpack. The up to date information of the snowpack allows the forecasts to be more precise, to show the detailed spatial distribution of the avalanche risk. The snowpack module is not ready yet, but I believe that when the whole model is ready, validated and finalized, it will be a great addition to any avalanche forecasts, it would ease the route selection even for not experienced skiers and hopefully help to avoid accidents.
ACKNOWLEDGEMENTS
I would like to thank to the staff of SLP (Avalanche Prevention Centre of Slovak Mountain Rescue Service) for their support and help in providing weather and snowpack data and discussing the results. I would also like to thank to SHMÚ (Slovak Hydrometeorological Institute) for providing the data from the Chopok AWS. The described work was carried out as part of the TÁMOP-4.2.2/B-10/1-2010-0008 project in the framework of the New Hungarian Development Plan. The realization of this project is supported by the European Union, co- financed by the European Social Fund.
REFERENCES
Ciolli, M., Zatelli, P. 2000. Avalanche risk management using GRASS GIS, Geomatics Workbooks, Vol. 2000, No. 1, pp. 1-12 Lehning, M., Bartelt, P., Brown, B., Fierz, C.,
Satyawali, P. 2002. A physical SNOWPACK model for the Swiss avalanche warning – Part II.
Snow microstructure, Cold Regions Science and Technology, Vol. 35, pp.147-167
Liston, G.E., Haehnel, R.B., Strum, M., Hiemstra, C.A., Berezovskaya, S., Tabler, R.D. 2007.
Instruments and Methods – Simulating complex snow distribution in windy environments using SnowTran-3D, Journal of Glacilology, Vol. 53, No.
181, pp. 241-256
McClung, D., Schaerer, P. 1999. The Avalanche Handbook, fifth printing, Seattle, Washington: The Mountaineers, USA
Spera, D.A., Richards, T.R. 1979. Modified power law equations for vertical wind profiles, Wind
Characteristics and Wind Energy Siting
Conference, Portland, Oregon, June 19-21. 1979.
USA 12p.
______________________
Corresponding author address: Anna Seres, Institute of Geography, University of Miskolc, Hungary;
tel: +36 30 4026115;
email: anna.seres@gmail.com