DOI: 10.1556/606.2018.13.3.12 Vol. 13, No. 3, pp. 119–130 (2018) www.akademiai.com
CATEGORIZING OF INHALING BEHAVIORS USING SIGNAL PROCESSING AND DATA MINING
TECHNIQUES
1 KhalidKAHLOOT, 2 Kristof CSORBA, 3 Peter EKLER
1,2,3
Department of Automation and Applied Informatics, Budapest University of Technology and Economics, Műegyetem rkp. 3, Budapest, Hungary
e-mail: 1kahloot.khalid@aut.bme.hu, 2kristof@aut.bme.hu, 3ekler.peter@aut.bme.hu Received 17 August 2017; accepted 13 April 2018
Abstract: The study of respiratory forms a major application and publication in the medical field. It characterizes the abnormalities in the breathing pattern, which assists in selecting the appropriate treatment methods. In some cases, respiratory characteristics unravel and point out potential diseases. A medical team gathered data from randomly selected recruits. A huge dataset was prepared, which capture the volume and velocity of the breathed air from the target recruits.
This paper presents the results of carrying out some of the signal processing, dimension reduction, and data mining techniques over this dataset. In particular, convolution filter, singular value decomposition and density-based spatial clustering of applications with noise were applied.
Inhaling behaviors have been categorized into nine groups but with stochastic noise. Some of the groups are big enough and distinguishable to evaluate with the use of eight types of inhalers the model for velocity versus volume of inhaling. Results will be considered by the medical team for choosing the appropriate inhaler out of five types of inhalers appropriate for each group.
Keywords: Breathing, Inhale behavior, Signal processing, Convolution filtering, Data mining, Density-based spatial clustering of applications with noise, Singular value decomposition
1. Introduction
Breathing characteristic acts as a physiological indicator and is used as a critical measure of the subject’s reaction to a certain treatment [1]. Fortunately, breathing can be quantified by several factors for instance as the velocity of inhaling and exhaling and by the volume of air inside the lungs. Usually, drugs inhaling are used for delivering medication into the body via the lungs. It is mainly used in the treatment of lung diseases. Unfortunately, there is no similar method quantitatively measures lungs
absorption of inhaling the drug. In other words, when the drug is delivered to the lungs via an inhaler, the amount of the vaporizing inspired into the bronchial cannot be estimated.
Nevertheless, physicians can characterize the breathing behavior of the patient after using the inhaler. Breath monitoring basically involves capturing of breaths from the subjects using different devices and processing the data obtained from these devices.
There are a variety of techniques used for characterizing the breathing behavior some of them are surveyed in the related work section. Detecting and analyzing the data obtained from the respiratory device for a large number of subjects is a challenge. Not because of the size of the data, but because of the diversity of breathing behaviors.
Indeed, it will be subjected to the medical condition of the patient, age, type of disease and inhaling techniques. This article presents a categorization methodology for grouping patients according to their inhaling behavior. Results can be beneficial to the medical team in a way that allows them to choose the correct inhaler for a specific patient. A convolutional filter was used to extract features from the data and density- based clustering was applied after carrying out a reduction of dimensions over the data.
This article does not propose new methods for analysis; however, the challenge was to find the appropriate and beneficial method to apply to the data in hand. The contribution this article adds is a guideline for collaborative experiment between medical and technical teams.
The layout of this article starts with an introduction to section 1. After that, section 2 surveys the related work and similar techniques. Section 3 presents the actual problem with medical details, then technical challenges. In section 4, the methodology is explained with two subsections; Experimental setup and Implementation. Results are presented in section 5. Discussion and analysis with illustration figures for clusters can be found in section 6. Conclusion and future work are stated in section 7 and 8 respectively.
2. Related work
Analysis of respiration data varies according to the objectives aimed in addition to the type and shape of the data. Regarding the problem described in problem statement section, it is needed to look for related signal processing, feature selection and data clustering techniques. Pre-diagnosed patients were subjected to monitoring of their exhaled breath as in [2]-[10]. Those articles tried to characterize the breathing behavior for patients having diseases for instance as oxidant-induced airway injury [3], aspirin- induced Asthma [4], lung cancer [2], [11], and [12], Chronic Obstructive Pulmonary Disease (COPD) [6], tuberculosis [7], lung transplant rejection [8], breast cancer [9], heart transplant rejection [10], diabetes mellitus [11], and unstable angina [13].
Some used simple statistical methods; i.e. mean, standard deviation and ANalysis Of VAriance (ANOVA), others used fuzzy logic modeling, regression, pattern recognition analysis and clustering. For example, M. Phillips et al. in [7], pattern recognition analysis was used for breath Volatile Organic Compounds (VOCs). They displayed a scatter plot of test subjects showing their Principal Component (PC) scores for factors in the one VOC measurement space. Exploratory PC and Hierarchical Cluster Analysis
(HCA) dendrograms indicated two cases. However, providing more examples of utilizing data analysis in medical researches is preferable. Phillips et al. [13] introduced an automated generation of a four-dimensional model of the liver using warping and mutual information. Meyer et al. [14] evaluate an automatic mutual information-based registration algorithm across a broad spectrum of multimodal volume data sets. They recommended this method to be routinely used to aid clinical diagnoses and post- therapeutic assessment.
Talking of signal processing, acoustic respiratory input impedance reflects diameter and patency of the upper airways [15]-[17] and has been applied to the detection and distinction of apneas with open and obstructed airways [18]-[20]. Moreover, inspiratory dynamic obstruction detected by forced oscillation is introduced by R. Farr in [21].
Related solutions in biomedical exploit maximum entropy [22], spline functions [23], polynomials [24], system identification methods [25], re-parameterization [26], and regularization [27] have been published. All mentioned techniques were used for reconstructing and filtering signals.
3. Problem statement
In this section, the problem, which a medical team from pulmonary care department had faced, will be described in details, which the medical team has faced. Primarily, some medical procedures need to be illustrated. Patients with a diagnosis of lung disease have usually prescribed drugs to be sprayed directly into their lungs. The treatment process is limited to the amelioration of symptoms through regimens consisting of one or more medications administered via inhalation. Therapeutic recorders showed a diversity of patients responding to inhalation process [28]. In some cases, patients burden with issues of adherence and inhaler technique. In the other hand, the absorption of medicine inside lungs is also dependent on the many factors like age, lung capacity, and most importantly the inhaling technique. In addition, the shape of the organs involved matters. The medical team had to deal with the detrimental effects of poor adherence are compounded by a high prevalence of poor inhaler technique.
As regards inhaling, there are five types of inhalers used by our medical team. Not to name a few, but those are available and mainly used in the treatment of Asthma, COPD, Zanamivir (Relenza), or Influenza. Thus, all must be administered via inhaler.
The respiratory devices or inhalers are popular remedies for nasal congestion in the upper respiratory tract. The available types of inhaler are Genuair 1, Genuair 2, Evohaler 1, Evohaler 2, Respimat 1, Respimat 2, Ellipta 1, and Ellipta 2. The medical team has noticed an irregular breathing behavior observed on the patients during inhaling the medicine. The predetermination of appropriate inhaler is a question which started to pop-up and the medical team decided to investigate it more detail. In particular, the medical team wanted to study the respiration behavior of the patients and categorize them into groups. The medical team believes that detecting some kind of breathing pattern will help them to choose the appropriate inhaling technique for each group.
Similarly, the medical team can gather information and recorded the observations corresponding to their recruited patients. In addition, the medical also can determine by
experience the most relevant variables be studied. Afterward, a dataset was provided for respiration of recruited patients and asked to analysis and sketch this dataset in a comprehensive way. Methods in [28] elaborate experimental software engineering solution using e-Health smart device technology and clinical telemedicine instruments.
4. Methodology
4.1. Experimental setup Physical environment
Data sampling was conducted in November 2016 at Szent János Hospital, Budapest.
The medical team was in the front seat and carried out the experiment. The respiration behavior of randomly selected patients in addition to normal persons was reviewed. The investigation aimed to capture the volume and velocity of the breathed air from the target recruits. Using a respiratory device, the medical team surveyed the breathing speed and air consumption. They managed to pick up at a sample rate of 25 readings per second. At each sampling point, the medical team measured the amount of air that flows or blows into or from the mouth in the unit of liters per second. Simultaneously, the medical team measured the speed of the air inhaled or exhaled in the unit of meters per second.
Given the data after this experiment, medical team could not point out any diagnoses out of respiratory carve and the well-known medical methods failed to characterizing breathing behavior. The advantage of using data mining methods on a large noisy dataset is to highlight critical issues and to summarize the approaches in a set of learned lessons. Data mining is an effective and accurate implementation of medical science in an automated system. The process includes filtering and narrowing down the patients list, extracting the important features out of respiratory carves and generating new figures to visualize results. All the above points are not achievable by normal medical processes.
The recruits were asked to set in front of the respiratory device for about 18 minutes to pick up readings. This experiment was carried out in a low-noise intensity environment in order to capture breaths with very less noise intensity. Finally, the dataset was prepared in three-dimensional matrixes, which were the time, volume and velocity corresponding to each patient. A laptop was used for the processing of the data.
The configuration details of the laptop include Intel core i5 processor, 4GB RAM, and 64-bit operating system. However, this configuration is not mandatory to perform the experiment. A laptop, which can successfully run Matlab software (version R2016b, MathWorks, Inc.) is suitable for the experiment.
Description of the dataset
The resulted dataset has been stored in 170 MB. Actually, it contains readings for 2254 volunteered recruits. For each, the medical team measured three values, which are time, velocity and volume. For instance, recruit id number 879 has the 4360 trios as
structures. More specific and for the same recruit id, the sample number 4000 was captured by the time of 15.941 seconds. Furthermore, at this particular time, the velocity was recorded as -1.269 meter/second and the volume was 3.661 liter/second.
Data pre-processing and observation
The analysis was performed using the Matlab software. Then, scripts were developed for manipulating data in order to find the minimal velocity location and correspondingly find the location of minimal volume after minimal velocity. The minimal volume and velocity are the most reprehensive period of the experiment duration. The medical team pointed out that the patient reaches his/her critical breathing behavior during this period. Thus, this particular period should be described in empirical measurements, which will be used as an input for data mining algorithm.
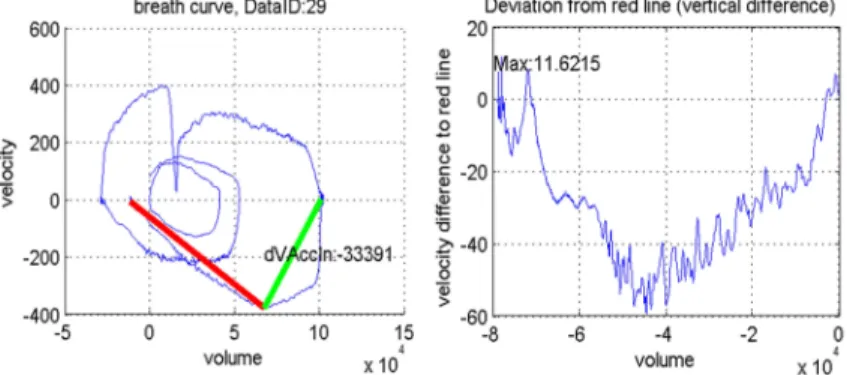
Afterward, the zero velocity was intended before minimal velocity. The focus managed to restrict to be on the minimal velocity and minimal volume as it is shown in Fig. 1.
The volume changes until achieving the minimal velocity, in other words, the inhaling was rapidly accelerating. To compare, starting from the deviation of the red line and plot volume versus velocity as it is shown in Fig. 2. By defining the lowest part of the curve, it is specified that this part was unstable and should be studied. Instability, according to medical diagnosis, is an abnormal behavior in the minimal volume is the left-side line and the minimal velocity is the right-side line in Fig. 2. For example, in this specific reading it is shown in Fig. 2, notice that how rapidly this recruit was inhaling. His/her maximum velocity was 11.621 l/s.
Fig. 1. The minimal volume is the left-side line and the minimal velocity is the right-
side line
Fig. 2. The lowest and unstable part of the curve
In Fig. 3 the ripple histogram has a shaking behavior of inhaling, which was very obvious. The remaining part of the curve seemed to show a regular respiration.
Nevertheless, the lowest part showed rapidly changing values with two frequent peaks.
As for the recruit, the explanation went that he/she was be sobbing or choking. To visualize the velocity difference regarding the right-side line, then sorted in ascending order the values of the lowest part curve. This allowed aligning those values as it is
shown in Fig. 4. The inhaling part took place quite longer than the exhaling part, which really convened to focus on the velocity of the air especially in this particular part of the curve.
Fig. 3. The histogram has two peaks Fig. 4. The inhaling part is considered much important compared to exhaling
4.2. Implementation Filtering
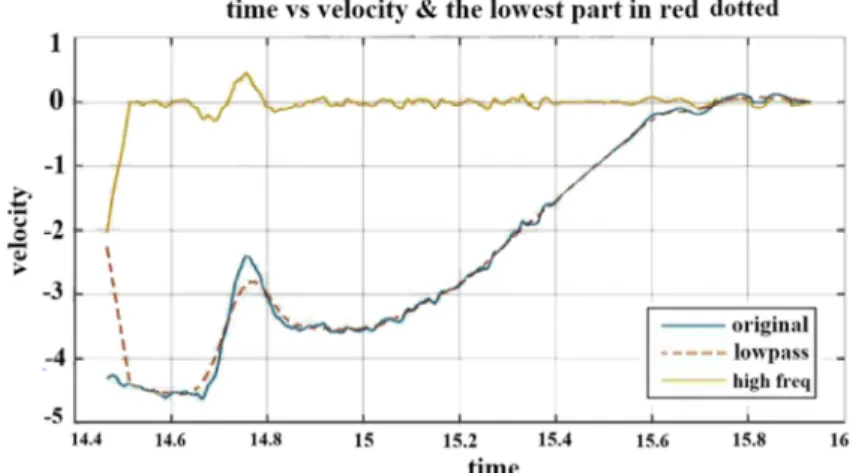
There are many types of filters, which can be applied on the velocity versus time curve. Usually, filters are used for reshaping, sharpening, embossing or isolating part or whole of the curve. By looking at the curve #3 in Fig. 5, it has drawn ripple in each part.
This shaking shape made the measurement of the variance not informative. Therefore, the curve had to remove some unwanted components from in order to suppress interfering signals and reduce background noise. Therefore, the convolution filter was applied to smooth the curve as it is shown in #2 in Fig. 5. A convolution is a general- purpose filter effect for signals, which applies a mathematical operation to determine the value of a critical part of the signal by adding the weighted values of all its neighbors together. A convolution filter was applied because it is used to modify the spatial frequency characteristics of the signal by determining the value of central values by adding the weighted values of all its neighbours together. The convolution combined the original curve with a unit curve in a window size of 50 sampled points. In Fig. 5 the curve in #1 represents the highest frequency cut-off of the original curve. It was generated by subtracting the original curve in #3 and the filtered one in #2. As it can be noticed, the #1 curve is steady and its variance is very informative.
Feature extraction
As far as concerned, the inhaling behaviors needed to be described in numbers.
Statistical values have to be calculated and intended to be informative and non- redundant. Originally, only three features are available, which were time, velocity and
volume. Nonetheless, more features could be extracted. Six features were selected and calculated. From the velocity curve, four of them were selected. First, the minimum value of the velocity was investigated, which is actually the maximum inhaling speed.
This feature was used to describe how choked was the recruit while inhaling. Then, first and the third quartile of the velocity are select to represent the dataset.
Fig. 5. Time vs. velocity in #3, convolved with unit signal in #2 and subtracted as high frequency curve in #1
These two features describe how fast was the inhaling of the 25% and the 75% of the recruits respectively. Last, the mean of velocity was used to average the speed of declined inhaling curves. From the volume, the difference was selected between the maximum and the minimum points in the curve. This feature intended to be an indication of how much air was inhaled. Finally, the standard deviation was calculated from the high-frequency curve in orange in Fig. 5. This feature indicates how to differ this particular inhaling behavior comparing to the average behaviors.
Reduction of dimensions
As it has been mentioned above, six features are available to describe the dataset.
Yet, those features cannot be visualized especially compared with previous graphs.
Therefore, the Singular Vector Decomposition (SVD) was applied on the selected features. This technique factorized and generated a three-dimensional matrix.
Clustering
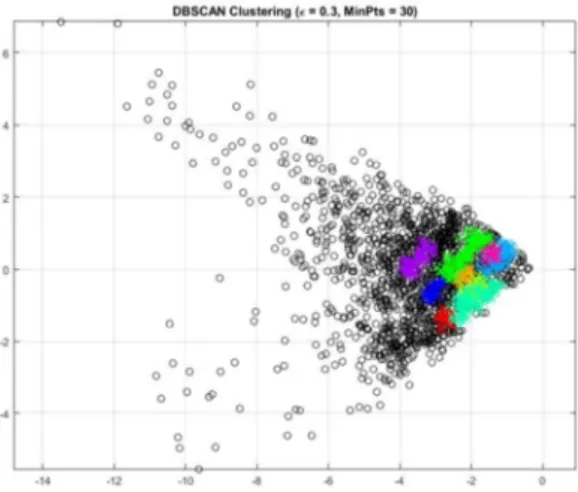
After plotting the SVD results in three dimensions, then realizing that data points were aligned in a spatial way not spherical with noise outliers. As it is shown in Fig. 6 the data points are scatter in a spatial and dense-based way. Accordingly, the Density- Based Spatial Clustering of Applications with Noise (DBSCAN) density-based
clustering algorithm was applied. The clusters are shown in two dimensions and three dimensions as it is shown in Fig. 6.
Fig. 6. 2D plot for clustering of selected features
5. Results
DBSCAN clustering showed that the dataset can be categorized into nine groups but with high noise. Some of the groups are big enough and distinguishable from cluster number 4 as it is shown in Fig. 6. In the other hand, there are small size clusters like cluster number 1. Other data points, which do not belong to a defined cluster have been eliminated as noise. The filtered data was recollected for each cluster and displayed new plotting for both velocity and volume of inhaling. For an instant, the volume of air in the inhaling behavior for a group of clusters number 5 was 1.11 liter/second. The average velocity of air during the inhaling was 0.43 meter/second while the maximum speed was 1.36 meter/second. For more detail, please see Table I.
Table I Features for each cluster
F1 F2 F3 F4 F5 F6
C#1 -1.76 -1.66 -1.42 -1.42 1.55 0.043 C#2 -4.16 -3.11 -0.30 -2.09 3.898 0.074 C#3 -1.89 -1.28 -0.63 -0.98 2.119 0.018 C#4 -1.59 -0.13 0.186 -0.07 0.580 0.033 C#5 -1.36 -0.85 0 -0.43 1.11 0.013 C#6 -1.04 -0.91 -0.23 -0.57 0.341 0.012 C#7 -1.21 -1.02 -0.70 -0.81 2.516 0.017 C#8 -1.07 -1.05 -1.00 -0.93 0.779 0.014 C#9 -3.71 -0.74 -0.16 -0.76 0.744 0.056
6. Discussion and analysis
As the researchers mentioned in the problem statement section, the medical team believes that detecting some kind of breathing pattern will help them to choose the appropriate inhaling technique for each group.
As it is shown in Fig. 7 and Fig. 8, clusters are characterized by the shape and the local values. For an instant, for cluster 1, the volume is always increasing versus a small range of velocity as it is shown in Fig. 8a. In the other hand, for cluster 6, notice that the velocity almost gets to zero after inhaling 3 liter/second and then the inhaling was repeated with the same volume and velocity for two round as it is shown in Fig. 7a provided an analysis in data science perspective. Most importantly, how the medical team will utilize those figures. Indeed, the medical team has a different point of view how to look into those figures. According to the medical experience, they can compare those results with the medical reorders of for pre-diagnosed patients. Furthermore, they ask for new test and figures but at least they have a baseline.
a) b)
Fig. 7. Characteristics of cluster # 6, a) Notice that the velocity almost get to zero after inhaling 3 liter/second; b) the curve has one local minimum at -2 and one local maximum at 1.6
a) b)
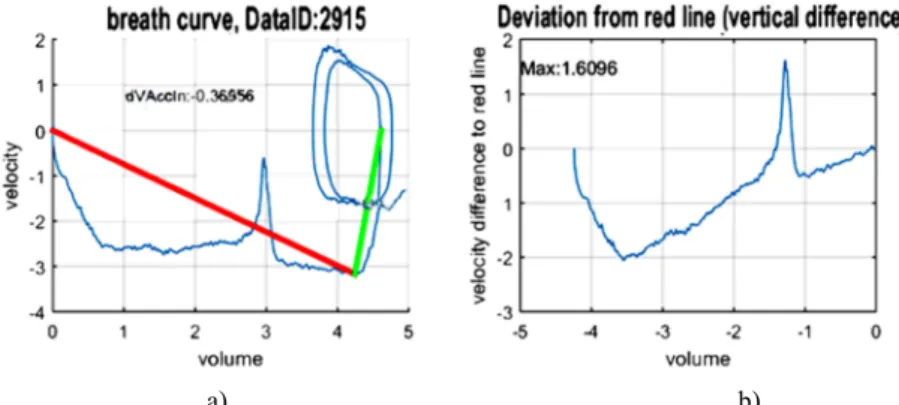
Fig. 8. Characteristics of cluster # 1, a) notice that the volume is always increasing versus small range of velocity, b) the curve has one local minimum at -1 and no local maximum
Fig. 9 presents a comparison of inhaling behaviors. As it is shown in Fig. 9a, the volume is plotted of the inhaled air from cluster number 2. It is noticed that the lowest part discussed in section 4 the above section has a smooth cycle of increasing and decreasing. On the contrary, as cited literary from a medical article [14], that documented the behavior of breathing for COPD patient. As it is shown in Fig. 9b, COPD patient is initially flow limited during quiet breathing lung volume increases until a new steady state is achieved at the higher lung volume, where expiratory flows are greater than at the initial inhaling.
a) b)
Fig. 9. Breathing behavior for cluster 2 compared to COPD patients, a) in cluster 2, volume behavior has a steady value for an interval between 12 to 22 second, b) rapid breathing in a patient with severe COPD. Trace of volume change, measured with a pneumotachograph, vs. time
7. Conclusion and future work
Data analysis can convert any reported data into informative statistics and figures.
Some of signal processing and data mining techniques were carried out. Then the data was categorized and characterized into 9 behaviors of breathing for some randomly selected recruits. From a medical aspect, a medical explanation is not provided because this will be the job of the medical team. Nonetheless, the power of data analysis is shown and proven to be subjective in the hands of the medical team.
Much accurate assessment of inhaling behavior would be possible with the definition of the disease to consider Asthma, COPD, Zanamivir or Influenza.
Nevertheless, the focus of this study was to evaluate the use of eight types of inhalers to model velocity versus volume of inhaling, only a dataset from randomly selected recruits was used to provide an approximation. For the future work, it is possible that a more in-depth investigation for the specific disease for modeling the behavior of inhaling and for assessing the reflection of using the available types of inhalers. That would allow better characterization.
Acknowledgments
This work was supported by the National Research, Development, and Innovation Fund of Hungary in the frame of FIEK_16-1-2016-0007 (Higher Education and
Industrial Cooperation Center) project and by the ÚNKP- 17-4-IV New National Excellence Program of the Ministry of Human Capacities.
References
[1] Nguyen P., Zhang X., Halbower A., Vu T. Continuous and fine-grained breathing volume monitoring from afar using wireless signals, The 35th Annual IEEE International Conference on Computer Communications, San Francisco, United States, 10-14 April 2016, pp. 1‒9.
[2] Conrad D. H., Goyette J., Thomas P. S. Proteomics as a method for early detection of cancer: a review of proteomics, exhaled breath condensate, and lung cancer screening. J.
Gen. Int. Med, Vol. 23, Suppl. 1, 2008, pp. 78–84.
[3] Alfaro M. F., Walby W. F., Adams W. C., Schelegle E. S. Breath condensate levels of 8- isoprostane and leukotriene B4 after ozone inhalation are greater in sensitive versus non- sensitive subjects, Exp. Lung. Res, Vol. 33, No. 3-4, 2007, pp. 115–133.
[4] Konstantinidi E. M., Lappas A. S., Tzortzi A. S., Behrakis P. K. Exhaled breath condensate: technical and diagnostic aspects, The Scientific World Journal, Article 435160, 2015, p. 25.
[5] Phillips M., Altorki N., Austin J. H., Cameron R. B., Cataneo R.N., Greenberg J., Kloss R., Maxfield R. A., Munawar M. I., Pass H. I., Rashid A., Prediction of lung cancer using volatile biomarkers in breath, Cancer Biomarkers, Vol. 3, No. 2, 2007, pp. 95–109.
[6] O’Reilly P., Bailey W. Clinical use of exhaled biomarkers in COPD, Int. J. Chron. Obstr.
Pulm. Dis, Vol. 2, No. 4, 2007, pp. 403–408.
[7] Phillips M., Cataneo R. N., Condos R., Erickson G. A. R., Greenberg J., La Bombardi V., Munawar M. I., Tietje O. Volatile biomarkers of pulmonary tuberculosis in the breath, Tuberculosis, Vol. 87, No. 1, 2007, pp. 44–52.
[8] Van Muylem A., Knoop C., Estenne M. Early detection of chronic pulmonary allograft dysfunction by exhaled biomarkers, Am. J. Respir. Crit. Care Med, Vol. 175, No. 7, 2007, pp. 731–736.
[9] Loring S. H., Garcia-Jacques M., Malhotra A. Pulmonary characteristics in COPD and mechanisms of increased work of breathing, Journal of Applied Physiology, Vol. 107, No. 1, 2009, pp. 309–314.
[10] Phillips M., Cataneo R. N., Ditkoff B. A., Fisher P., Greenberg J., Gunawardena R., Kwon C. S., Tietje O., Wong C. Prediction of breast cancer using volatile biomarkers in the breath, Breast Cancer Res. and Treat, Vol. 99, No. 1, 2006, pp. 19–21.
[11] Wilson A. D., Baietto M. Advances in electronic-nose technologies developed for biomedical applications, Sensors, Vol. 11, No. 1, 2011, pp. 1105‒1176.
[12] Varga S., Patachia S., Ion R. Development of controlled-release devices for photodynamic therapy of cancer, Pollack Periodica, Vol. 2, No. 2, 2007, pp. 131‒140.
[13] Phillips M., Cataneo R. N., Cheema T., Greenberg J. Increased breath biomarkers of oxidative stress in diabetes mellitus, Clinica. Chimica. Acta, Vol. 344, No. 1-2, 2004, pp. 189–194.
[14] Yen F. C., Behbehani K., Lucas E. A., Burk J. R., Axe J. R. A noninvasive technique for detecting obstructive and central sleep apnea, IEEE Transactions on Biomedical Engineering, Vol. 44, No. 12, 1997, pp. 1262‒1268.
[15] Norman R. G., Ahmed M. M., Walsleben J. A., Rapoport D. M. Detection of respiratory events during NPSG: nasal cannula/pressure sensor versus thermistor, Sleep, Vol. 20, No. 12, 1997, pp. 1175-1184.
[16] Phillips M., Cataneo R. N., Greenberg J., Grodman R., Salazar M. Breath markers of oxidative stress in patients with unstable angina, Heart Disease, Vol. 5, No. 2, 2003, pp. 95–99.
[17] Brock K. M., Balter J. M., Dawson L. A., Kessler M .L., Meyer C. R. Automated generation of a four-dimensional model of the liver using warping and mutual information, Med. Phys, Vol. 30, No. 6, 2003, pp. 1128–1133.
[18] Farre R., Peslin R., Rotger M., Navajas D. Inspiratory dynamic obstruction detected by forced oscillation during CPAP, A model study, American Journal of Respiratory and Critical Care Medicine, Vol. 155, No. 3, 1997, pp. 952‒956.
[19] Reisch S., Steltner H., Timmer J., Renotte C., Guttmann J. Early detection of upper airway obstructions by analysis of acoustical respiratory input impedance, Biol. Cybern, Vol. 81, No. 1, 1999, pp. 25–37.
[20] Badia J. R., Farré R., Montserrat J. M., Ballester E., Hernandez L., Rotger M., Rodriguez- Roisin R., Navajas D. Forced oscillation technique for the evaluation of severe sleep apnoea/hypopnoea syndrome: a pilot study, Eur. Respir. J, Vol. 11, No. 5, 1998, pp. 1128–1134.
[21] Cutler D. J. Numerical deconvolution by least squares: use of polynomials to represent the input function, Journal of Pharmacokinetics and Biopharmaceutics, Vol. 6, No. 3, 1978, pp. 243‒263.
[22] Charter M. K., Gull S. F. Maximum entropy and its application to the calculation of drug absorption rates, Journal of Pharmacokinetics and Pharmacodynamics, Vol. 15, No. 6, 1987, pp. 645‒655.
[23] Johnson T. N., Zhou D., Bui K. H. Development of physiologically based pharmacokinetic model to evaluate the relative systemic exposure to quetiapine after administration of IR and XR formulations to adults, children and adolescents, Biopharmaceutics and Drug Disposition, Vol. 35, No. 6, 2014, pp. 341‒352.
[24] Meyer C. R., Boes J. L., Kim B., Bland P. H., Zasadny K. R., Kison P. V., Koral K., Frey K. A., Wahl R. L. Demonstration of accuracy and clinical versatility of mutual information for automatic multimodality image fusion using affine and thin-plate spline warped geometric deformations, Med. Image Anal, Vol. 1, No. 3, 1997, pp. 196–206.
[25] Loring S. H., Garcia-Jacques M., Malhotra A. Pulmonary characteristics in COPD and mechanisms of increased work of breathing, Journal of Applied Physiology, Vol. 107, No. 1, 2009, pp. 309–314.
[26] Reisch S., Schneider M., Timmer J., Geiger K. and Guttmann J. Evaluation of forced oscillation technique for early detection of airway obstruction in sleep apnea: a model study, Technology and Health Care, Vol. 6, No. 4, 1998, pp. 245‒257.
[27] Islam M. S., Chaussalet T., Ozkan N. and Demir E. An approach to exploring the effect of weather variations on chronic disease incidence rate and potential changes in future health systems, IEEE 23rd International Symposium on Computer-Based Medical Systems (CBMS), Perth, WA, 12-15 October 2010, pp. 190‒196.
[28] Garai A., Pentek I., Adamko A., Nemeth A. Methodology for clinical integration of e- Health sensor-based smart device technology with cloud architecture, Pollack Periodica, Vol. 12, No. 1, 2017, pp. 69‒80.