Individual Characteristics of the Sleep
Electroencephalogram as Markers of Intelligence–
Effects in a Broad Age and Intelligence Range
Doctoral thesis
Péter Przemyslaw Ujma
Semmelweis University
Doctoral School of Mental Health Sciences
Advisor: Róbert Bódizs, PhD, chief research fellow
Official Reviewers: Gábor Csukly, MD, Ph.D., lecturer
Kristóf Kovács, Ph.D., chief research fellow President of the Qualification Committee: István Bitter, MD, DSc,
professor
Members of the Qualification Committee:Pál Czobor, MD, Ph.D., associate professor
Dezső Németh, Ph.D., associate professor
Budapest
2015
1
Table of Contents
List of abbreviations ... 3
1. Introduction ... 3
1.1. Sleep as a Biological State ... 5
1.1.1. Basic Features and Regulation of Sleep ... 5
1.1.2. Potential Functions of Sleep, Slow Waves and Spindles ... 11
1.1.3. Methodological Problems – Measuring Spectra and Sleep Spindles ... 23
1.2. Intelligence ... 28
1.2.1. Traditional Views of Intelligence ... 29
1.2.2. Non-Cognitive Correlates of IQ ... 38
1.2.3. The K-factor ... 41
1.3. Sleep, cognition and intelligence ... 45
1.3.1. Memory consolidation ... 45
1.3.2. Intelligence ... 47
2. Aims ... 54
3. Methods ... 55
3.1. Study 1 – Children ... 60
3.1.1. Recruitment, Ethics and Psychometric Testing ... 60
3.2.2. Polysomnography Recording and Scoring ... 61
3.2.3. Spectral Analysis, Sleep Spindle Detection and Statistics ... 62
3.2. Study 2 – Adolescents ... 63
3.1.1. Recruitment, Ethics and Psychometric Testing ... 63
3.3.2. Polysomnography Recording and Scoring ... 64
3.3.3. Spectral Analysis, Sleep Spindle Detection and Statistics ... 65
3.3. Study 3 – Adults ... 65
3.3.1. Recruitment, Ethics and Psychometric Testing ... 65
3.3.2. Polysomnography Recording and Scoring ... 67
3.3.3. Spectral Analysis, Sleep Spindle Detection and Statistics ... 68
4. Results ... 70
4.1. Study 1 – Children ... 70
4.1.1. Basic biological and psychometric data ... 70
2
4.1.2. Sleep macrostructure and sleep spindles ... 70
4.1.3. Correlations between EEG data and intelligence ... 72
4.2. Study 2 – Adolescents ... 78
4.2.1. Basic biological and psychometric data ... 78
4.2.2. Sleep macrostructure and sleep spindles ... 79
4.2.3. Correlations between EEG data and intelligence ... 81
4.3. Study 3 – Adults ... 86
4.3.1. Basic biological and psychometric data ... 86
4.3.2. Sleep macrostructure and sleep spindles ... 86
4.3.3. Correlations between EEG data and intelligence ... 89
5. Discussion ... 95
Summary ... 103
Összefoglalás ... 104
References ... 105
Publications ... 132
Acknowledgements ... 133
3 List of abbreviations
APM – Advanced Progressive Matrices BA – Brodmann area
CPM – Coloured Progressive Matrices DTI – diffusion tensor imaging
EEG – electroencephalography FDR – false discovery rate FFT – Fast Fourier Transform
fMRI – functional magnetic resonance imaging IAM – individual adjustment method
IQ – intelligence quotient
MRI – magnetic resonance imaging NREM – non-rapid eye movement PET – positron emission tomography PTSD – post-traumatic stress disorder REM – rapid eye movement
RPMT – Raven Progressive Matrices Test SD – standard deviation
SWS – slow wave sleep
WASO – wake after sleep onset
1. Introduction
4
A typical human being spends approximately one third of his life sleeping, which is hardly matched by any other activity typical for our lives. Despite its prominence, sleep has been an elusive subject to study, and its functional importance has not been known until the second half of the last century. Once a subject of religious speculations, a source of mystery and prophetic dreams, sleep has been revealed to be a very particular neurobiological state in which the central nervous system enters a drastically altered state of functioning compared to wakefulness. While not all questions regarding the functions and mechanisms of sleep have been completely elucidated, by now it is certain the changes in the functioning of the central nervous system sleep brings about are crucial for optimal functioning in wakefulness.
Individual characteristics of sleep variables have also been revealed to correlate with intelligence. Single-factor intelligence has been repeatedly confirmed as a valid and reliable psychometric tool for over a century, and its importance is increased even further in new theories of its interpretation which stress that based on intelligence reliable predictions can be made not only of cognitive functioning or social status, but also about health and longevity. Therefore, the study of the relationship between sleep and intelligence links two fields – one from a neurobiological and one from a psychometric domain – which are of exceptional importance for human life.
The introduction section of this thesis briefly presents the most important morphologic and functional aspects of sleep – particularly NREM sleep – and the mechanisms by which it can contribute to cognitive functioning. Sleep spindles – NREM oscillations often implicated in the relationship between cognition and sleep – will be described in detail. The introduction also reviews some of the most important theoretical and empirical results related to intelligence, demonstrating that intelligence, on the one hand, can be conceptualized as a single-factor construct and on the other hands its importance extends beyond the cognitive domain into basic aspects of life strategies.
Furthermore, the introduction reviews previous studies about the relationship between sleep and cognition, and it also comments on some important methodological details which were considered in the studies presented in the Methods and Results section.
Our investigations were performed on over two hundred subjects with a wide age range (4-70 years) and a similarly wide IQ range (85-160). Our results confirm the
5
relationship between individual EEG characteristics in sleep and intelligence, but they also point out the sexually dimorphic nature of this relationship.
1.1. Sleep as a Biological State
1.1.1. Basic Features and Regulation of Sleep
The profound biological importance of sleep is supported not only by the fact that humans spend a significant time of their lives sleeping, but also by the fact that sleep is present in virtually all animals as well, some of which spend even more time sleeping than humans(Cirelli and Tononi, 2008), and sleep deprivation generally leads to serious impairment in cognitive abilities and other biological functions. Despite these facts, our current knowledge of the functions of sleep is far from complete (Rosen, 2006). Some features and characteristics of sleep, however, may help highlight its significance for physiological and cognitive functioning.
Sleep is characterized by changes in hormone levels and it affects the functioning of the immune system, thus contributing to ’regeneration’ in a broad sense. After sleep deprivation, immune responses are attenuated due to a lower white blood cell count (Zager et al., 2007). On the other hand, slow-wave sleep increases growth hormone level(Van Cauter et al., 2000), which enables regeneration, wound healing and physical restorative processes of the body. Reduced restorative capacity was found in sleep- deprived rats(Gümüstekin et al., 2004), albeit this effect appears to originate rather from NREM sleep deprivation and it is not present in case of selective REM deprivation (Mostaghimi et al., 2005). A higher amount and better quality of sleep is correlated with higher levels of melatonin in diurnal species, a hormone heavily involved in restorative processes (Bubenik, 2002; Odaci and Kaplan, 2009), suggesting that better sleep quality may be both a cause and an index of the increased ability of the body to heal itself.
The effects of sleep deprivation are certainly more immediate and perhaps even more dramatic in the cognitive domain. The most common and immediate effects of sleep deprivation are sleepiness, the slowing of mental processes as well as the lack of the ability to concentrate. These effects can partially reversed voluntarily, such as by being motivated by rewards (Horne and Pettitt, 1985; Monk, 1991), but they never completely
6
disappear. Sleep deprivation reduces performance in working memory tasks to a particularly striking degree(Turner et al., 2007), in line with increased hemodynamic responses inthe prefrontal cortex, a sign of compensatory recruitment (Drummond et al., 2000; Drummond et al., 2005). However, similarly to the more basic physiological effects of sleep deprivation, alterations in the cognitive domain also appear to rather stem from NREM than REM sleep. REM sleep causes disturbances in emotional regulation(Ellman et al., 1978; Rosales-Lagarde et al., 2012), but it appears to be less involved in sleep-related cognitive processing (Siegel, 2001) and individuals with chronic pharmacological or traumatic REM deprivation are able to live without serious cognitive impairments (Vertes and Eastman, 2000). Thus, sleep cannot be treated as a monolithic process in terms of its effects and functions.
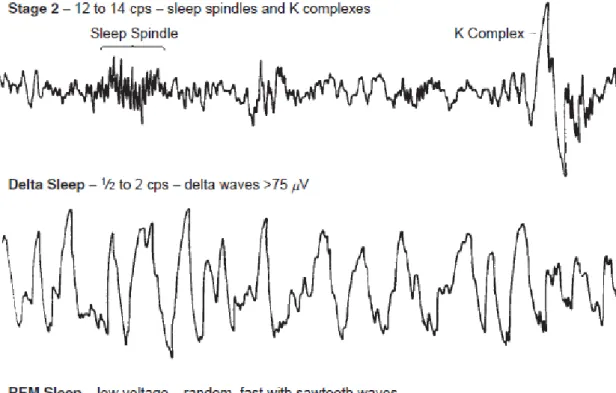
Sleep can be broadly defined as two very distinct states: rapid eye movement (REM) sleep and non-rapid eye movement (NREM) sleep (Rechtschaffen et al., 1968; Iber et al., 2007). At the same time NREM and REM sleep are two alternating phases of the ultradian oscillation serving the basis of the cyclical nature of sleep. Furthermore, subdivisions of these states can be made, reflecting the different depths or electrophysiological states. The following basic description of the most important features of normal sleep – when no other sources are noted – arepresented based on these two classification system (Rechtschaffen et al., 1968; Iber et al., 2007) and one book chapter (Billiard, 2008). Typical EEG features of different sleep stages are illustrated on Figure 1, whileFigure 2 shows a typical hypnogram of all-night sleep..
Figure 1. “EEG patterns of human sleep states and stages”. Figure and caption from
7
“EEG patterns of human sleep states and stages”. Figure and caption from 2008)
“EEG patterns of human sleep states and stages”. Figure and caption from(Billiard,
8
The onset of sleep is characterized by the disappearance of alpha wave trains which are prominent in the resting wakeful EEG signal. There is an increase in theta power, as well as vertex waves and occipital sharp transient waves. This intermediate state is Stage 1 sleep. Stage 1 sleep rarely lasts for more than a few minutes, and instead gives way to either deeper NREM sleep or, if sleep pressure is low (typically in the last periods of night sleep) an awakening.
Stage 2 sleep is characterized by an increased power int he delta band (<4 Hz) and the appearance of its main features, K-complexes and sleep spindles. K-complexes are transient, low-frequency waves which appear spontaneously but can also be elicited by stimulation. Sleep spindles are waxing and waning sinusoidal waveforms which appear all over the scalp but mainly in central and frontal midline derivations, reflecting specific neuronal firing patterns in thalamocortical circuits, mediated by reticular thalamic interference (Steriade, 2003; Lüthi, 2013). Sleep spindles are heavily implicated in the effect sleep exerts on cognition, which is why they will be described in greater detail in later chapters of this thesis.
Stage 3 sleep – together with what is called Stage 4 sleep in an earlier classification system (Rechtschaffen et al., 1968) – is also called slow wave sleep (SWS).
Consequently, this sleep stage is characterized by the proliferation of low-frequency, high-amplitude slow waves, generated by synchronous firing (and silence) in cortical assemblies (Csercsa et al., 2010).
Importantly, slow wave activity in Stage 2 sleep and SWS does not appear in a symmetrically distributed manner, but they are instead organized into cyclic alternating patterns (CAPs) (Terzano et al., 1985; Terzano et al., 2001). Sometimes, slow waves are uniformly distributed for several minutes (Non-CAP), but at other times they appear in sudden, high-amplitude burst series (CAP A1), preceded and followed by a flattened EEG signal devoid of prominent low-frequency, high-amplitude activity (CAP B).
Apart from the CAP A1 subtype, consisting of a transient burst of slow waves, other types of CAP activity are known. CAP A3 is characterized by arousal, reflected by a transient increase in alpha or beta activity and/or muscle tone, while the CAP A2 subtype is characterized by mixed (slow and fast) transient activity. While a detailed description of cyclic alternating patterns is beyond the scope of this thesis, they
9
certainly deserve mention due to many results (Aricò et al., 2010; Esposito and Carotenuto, 2010; Drago et al., 2011) linking them to individual differences in waking cognitive ability. Figure 3 shows EEG recordings from NCAP sleep as well as CAP sequences.
The stages of NREM sleep are typically organized into 90-120 minute long sleep cycles with alternating sleep depth, which continue until awakening. Typically, the deepest stage (reflected by the amount of slow wave activity) of sleep is shallower in each successive sleep cycle.
Rapid eye movement sleep (REM) typically occurs between sleep stages, with increased prominence towards the end of the night. Regarding its appearance and physiological characteristics, REM sleep is radically different from NREM sleep. While reduced muscle tone is typical in all sleep stages, physiological REM sleep is characterized by complete atonia in the skeletal muscles, except for the facial muscles responsible for eye movements. However, REM stage is characterized by increased activity in every other regard, reflected by increased EEG activity in the beta and gamma band (with the complete disappearance of slow waves and sleep spindles), eye movements and prominent – albeit very chaotic – mental activity, which is evident from the fact that dreams are more frequently reported after awakenings from REM sleep.
Importantly, however, dreams also occur in NREM sleep.
Figure 2. Night sleep hypnogram of a healthy young male subject. Note the decreased depth and increased REM prominence in later parts of the night.
The existence and alternation of NREM and REM phases has been explained in numerous ways. One theory (Rial et al., 1993; Rial et al., 2010) proposes that sleep in mammals evolved from reptilian waking states, while mammalian waking is a phylogenically new phenomenon related to the development of a greater and more
10
specialized telencephalon. Based on similarities in EEG patterns and reactivity, these authors proposed that human NREM sleep is analogous to reptilian basking behavior, while REM sleep is analogous to the post-basking behavior of reptiles which is characterized by an observation of the environment and the initiation of new goals.
Another – not necessarily contradicting – theory suggests that sleep phases are tools of energy conservation (Schmidt, 2014). Since thermoregulation is suspended in sleep – especially REM sleep – longer sleep periods are adaptive since they contribute to energy efficiency. This, however, comes at the price of less time available to achieve goals and also a longer time of exposure to predation and other potential dangers. In line with this theory, longer REM phases are observed in larger animals (which have greater thermal inertia) and extremely long periods of continuous waking are observed in niche exploiting animals, such as artic birds with very short mating periods.
Figure 3. “CAP time and non-CAP time in stage 2 NREM sleep. CAP time: alternance of arousal-related phasic events (A) and of the background EEG activities (B). EMG, electromyogram; PNG, pneumogram; EKG, electrocardiogram; CNP, Clinica Neurologica
Parma”. Figure and caption from (Terzano and Parrino, 1992) and (Billiard, 2008) Sleep is frequently investigated using polysomnography for both clinical and research purposes. Polysomnography is the use of multiple electrophysiological exploration methods to accurately determine physiological activity (including and beyond neural activity) during sleep.
11
A very important part of polysomnography recordings is electroencephalography (EEG). EEG recordings are usually performed on multiple channels, typically referenced to contralateral mastoids in order to ensure an even distribution of signal voltage.
Eye movements in sleep are investigated using electrooculography (EOG). EOG recordings are sensitive to eye movements by recordings the changes in the potential fields of the moving eyes. The most prominent use of EOG is in sleep stage scoring, since large eye movements are typical features of REM sleep.
Electromyography (EMG) is a measurement of muscle activity by electrophysiological measures. The applications of EMG include sleep stage scoring as well as the exclusion of muscle movement artifacts from EEG channel data using automatic noise rejection algorithms.
Electrocardiography (ECG) detects the electrical signals generated by the beating heart. In polysomnography settings, ECG recordings are performed with less electrodes than in clinical practice, and their role is typically limited to the investigation of basic features – such as heart rate and its variability in relation to sleep events – and the removal of cardiac artifacts from EEG channels.
Most of the research cited or described in this thesis was done according to the sleep staging and recording methodology described in this subsection.
1.1.2. Potential Functions of Sleep, Slow Waves and Spindles
Slow waves – Synaptic homeostasis
Slow waves are perhaps the most prominent and mostly sleep-related oscillations, which led to their early recognition as important electrophysiological features of sleep.
Early theories, however, identified delta waves as basically pathological, reflecting
‘death, decay and disease’(Walter, 1936), mostly due to the occurrence of slow waves in brain areas which were damaged due to physical lesions or strokes. While the visually salient nature of slow waves is by no means misleading in the sense that they continue
12
to be among the most widely researched features of NREM sleep, these early claims about their pathological nature have proven to be unfounded.
Theories about the function of slow waves can be generally traced back to the general characteristics of these waves in relation to environmental and psychological variables.
Slow wave activity follows an inverted U-shaped maturational curve, peaking in early childhood, dropping significantly during maturation, especially in adolescence (Jenni and Carskadon, 2004; Feinberg and Campbell, 2010; Feinberg and Campbell, 2013), but continuing to diminish throughout adulthood (Landolt et al., 1996; Carrier et al., 2001).
In elderly adults, more retained slow wave activity is a marker of better neurocognitive functioning (Anderson and Horne, 2003; Mander et al., 2013) and it was recently directly linked to reduced mortality (Mazzotti et al., 2014).
Another maturational feature of slow waves is that changes in slow wave activity follow a very distinct postero-anterior pattern (Feinberg et al., 2011), much like cortical maturation itself (Tamnes et al., 2010), obviously hinting at a possible direct relationship between the two. The fact that maturational changes in the slow wave activity of young subjects are a direct function of cortical maturation has been demonstrated (Ringli and Huber, 2011; Feinberg and Campbell, 2013), suggesting that slow wave activity decreases in a region-specific manner when the cortical regions in question undergo maturation. Cortical maturation in children and adolescents generally means cortical thinning and an overall decrease in synaptic density (Tamnes et al., 2010; Herting et al., 2015), reflecting the formation of ‘mature’, that is, functionally efficient networks and a loss of plasticity since it is no longer required. Of course, this coupling between cortical maturation (that is, synaptic density) and slow wave activity suggests that slow waves are the hallmarks of synaptic plasticity in sleep, which is why they diminish in the absence of highly plastic cortical networks.
A further point that was considered in early theories of slow wave function is that slow wave activity (spectral power) is increased after sleep deprivation, in line with a general deepening of NREM sleep, generally at the expense of stages 1 and 2, REM sleep and wakefulness(Borbely et al., 1981). This suggests that slow waves are not stand-alone elements of the sleep EEG, but they are related to waking neural activity.
13
One of the first theories to systematically address these features of slow waves and suggest an explanatory model was the two-process theory by Alexander Borbély (Borbély, 1982). Borbély proposed that slow wave activity is ultimately a function of time spent awake: if wakefulness is longer, sleep pressure increases, and slow wave activity in sleep is a direct function of sleep pressure. During sleep, sleep pressure decreases, followed by the characteristic decrease in slow wave density, until it is so low that an awakening occurs. The (non-linear) relationship between time spent awake and sleep pressure (practically equivalent to slow wave pressure) was hypothesized to be regulated by a time-dependent Process S, while a sinusoidal Process C (corresponding to the circadian regulation) was proposed to regulate sleep and waking thresholds. Some EEG activity – most prominently sleep spindling – was also demonstrated to be regulated by both circadian and homeostatic processes rather than sleep pressure (Dijk and Czeisler, 1995), and some new evidence suggests that slow (slow) wave activity also depends on circadian phase too (Lazar et al., 2015).In sum, according to Borbély’s theory Process S mainly regulates sleep (slow wave) pressure as a function of time spent awake, while Process C regulates whether a given amount of sleep pressure implies sleep or wakefulness in the organism as a function of the phase of the circadian clock.
Borbély’s theory was solidly proven by the fact that he was able to create equations which accurately predicted sleep pressure (measured by slow wave activity) as a function of time spent awake(Achermann et al., 1993; Borbely and Achermann, 1999).
This suggested that – as proposed by the theory – sleep pressure is indeed the result of time spent in wakefulness.
However, Borbély’s theory treated sleep and sleep pressure as an essentially global phenomenon, which was challenged by later studies. Slow wave activity was subsequently found to be regulated by waking activity in a region-specific manner:
increased use (Kattler et al., 1994) or immobilization (Huber et al., 2006) of an arm during wakefulness elicited increased and decrease slow wave activity, respectively, but only over the contralateral motor cortices, suggesting that slow wave regulation occurs within local networks instead of the entire cortical structure of the brain. This is in line with the theories which envisage sleep as a local process (Krueger and Obál, 1993;
14
Krueger and Tononi, 2011), generated in small functional networks of the brain as a result of the long term potentiation (LTP) caused in the network by events in wakefulness. In these models, an asymmetric wakefulness-related change of slow wave activity is possible in different brain regions as a function of their prior use.
All the above findings are summarized in the synaptic homeostasis hypothesis (SHY) of Giulio Tononi and Chiara Cirelli (Tononi and Cirelli, 2003, 2014), which is arguably the best account of slow wave function currently available, as well as possibly the most significant description of NREM sleep function in general. The SHY proposes that the main function of NREM sleep is to compensate for plastic changes occurring in wakefulness, and this takes place through the generation of slow waves – that is, “sleep is the price the brain pays for plasticity” (Tononi and Cirelli, 2014). Ultimately, SHY proposes that the downregulation of synaptic strength is impossible in wakefulness, but slow waves perform this function in sleep in a manner that does not eliminate synaptic changes which reflect the learning of meaningful information.
SHY is supported by ample evidence. The density of GluA1-containing AMPA receptors (Vyazovskiy et al., 2008), synaptic strength (Liu et al., 2010), the number of synapses and synaptic spines (Bushey et al., 2011; Maret et al., 2011) and the slope and amplitude of electrophysiological evoked responses (Huber et al., 2013) increase during wakefulness and decrease during sleep, suggesting corresponding changes in synaptic strength.The time course of these variables is strikingly similar to that of slow wave activity, which is also strongest after prolonged wakefulness, but decreases during sleep. In fact, the slope of evoked responses in wakefulness was found to correlate positively with slow wave activity in later sleep(Vyazovskiy et al., 2008).
The intrinsic synaptic downscaling properties of NREM sleep are thought to be mediated among others by the upregulation of calcineurin and the inhibition of the protein kinase CamKII (Cirelli et al., 2004; Tononi and Cirelli, 2014). However, these downscaling effects are not symmetrical: very strong new synapses may be protected, for example by the inhibition of CamKIIN function by high calcium levels or the exclusion of downregulation-evoking genes from highly potentiated synapses (Tononi and Cirelli, 2014). Thus, the strong new synapses potentially encoding meaningful new information from a previous period of wakefulness can be protected even in an
15
environment which heavily favors synaptic downscaling and elimination, increasing the signal-noise ratio of neuronal activity through the elimination of randomly formed new synapses. Protein synthesis is also increased during NREM sleep(Ramm and Smith, 1990), enabling the transformation of the strongest synaptic connections into a more permanent structure (Frey et al., 1988; Reymann and Frey, 2007; Poe et al., 2010).
These sleep-related plastic changes, mainly induced by slow waves, increase the energetic efficiency of synapses and save extracellular space (Xie et al., 2013; Tononi and Cirelli, 2014). On a behavioral level, it promotes the forgetting of irrelevant information but enhances gist extraction, may bring forward new insights and consolidate memories through the elimination of synaptic noise(Tononi and Cirelli, 2014).
To summarize the previous sub-section, the maturational, daily and overnight course of slow wave activity, together with structural, molecular and electrophysiological evidence suggests the main function of slow waves is to compensate for the increases in synaptic strength in functional units of the cortex caused by their use during wakefulness. As a result of slow wave activity, synaptic strength decreases to normal levels, but due to the selective protection of certain new synaptic connections most relevant new information from the previous episode of wakefulness is successfully retained.
As provided before, there is very strong empirical evidence for these statements, but the picture about NREM sleep function – let alone the function of sleep in general – is not yet complete. In fact, the concept of improving the information encoded in neural networks by decreasing synaptic strength – as proposed by the SHY – is somewhat counter-intuitive. While synaptic downscaling is certainly a very important part of NREM sleep, and it is also generally absent from wakefulness (Vyazovskiy et al., 2008;
Liu et al., 2010), the opposite – increased synaptic strength in sleep – may be possible, complementing the downscaling properties of slow waves.
16
Ripples, hippocampal replay and long-termpotentiation
The previously discussed hypothesis of synaptic homeostasis relies on evidence about the fact that sleep – especially NREM sleep – is characterized mainly by decreasing synaptic strength, and it contributes to sleep-related enhancements of cognitive abilities by using this downscaling to eliminate noise and make synaptic assemblies more efficient. However, other theories about the functions of sleep also exist, which take into account the possibility of synaptic potentiation during sleep.
NREM sleep is generally characterized by an absence of acetylcholine, which makes LTP impossible(Leonard et al., 1987; Bramham and Srebro, 1989) as well as a lack of the expression of LTP-related genes(Poe et al., 2010; Ribeiro, 2012). There is, however, some evidence that LTP might still be possible if specific conditions are met during sleep.
NREM sleep is characterized by co-occurring sleep spindles and hippocampal sharp- wave ripples, which are thought to play a role – among others - in sleep-related memory consolidation(Inostroza and Born, 2013; Genzel et al., 2014). Sharp-wave ripples initiate a cellular influx of calcium which may provide excellent conditions for LTP(Sejnowski and Destexhe, 2000; Steriade and Timofeev, 2003), while sleep spindles can demonstrably induce LTP if the right conditions are met(Rosanova and Ulrich, 2005). While the idea that ripples and spindles generally induce LTP is not decisively supported (see(Tononi and Cirelli, 2014) for review), it provides the framework for an alternative theory to SHY, which also takes into account the properties of REM sleep. It is notable that sleep spindles – while they occur in NREM sleep – are preceded by a drop in noradrenergic activity from the locus coeruleus(Aston- Jones and Bloom, 1981) which may provide unique neurochemical conditions different from the rest of NREM sleep and more similar to REM sleep(Poe et al., 2010).
The theory of systems consolidation during sleep (Inostroza and Born, 2013; Rasch and Born, 2013) assumes that NREM and REM sleep work in tandem in order to consolidate memories acquired during wakefulness. In NREM sleep, a – generally accelerated – replay of waking activity takes place. Such a replay of waking activity has actually been found in NREM sleep in the hippocampus(O'Neill et al., 2010) as well as
17
neocortical structures (see(Inostroza and Born, 2013) for review). This replay happens in order to move episodic memories (that is, memory traces with a strong binding to specific circumstances and personal experience) from their initial, fast-learning hippocampal store to a more permanent but less episodic and more declarative (that is, less experience-related and more encyclopedic) neocortical memory store. This serves both to ’reset’ the limited hippocampal memory storage capacity in order to enable the acquisition of more information and also to allow for the creation of memories which have less to do with individual experiences and provide more information about the general characteristics of the environment. The hippocampal-neocortical replay during NREM sleep ‘tags’ synapses for transformation during a subsequent REM sleep episode(Rasch and Born, 2013).
The contribution of REM sleep to sleep functions is admittedly less clear that in case of NREM sleep(Tononi and Cirelli, 2014). However, the neurochemical environment in REM sleep, with the presence of acetylcholine but the absence of noradrenaline is drastically different, and LTP is readily induced in the hippocampus during REM sleep(Bramham and Srebro, 1989; Poe et al., 2010). While hippocampal reactivations – that is, the replay of prior waking activity – are generally observed in NREM sleep, they were also observed in REM sleep(Poe et al., 2000; Booth and Poe, 2006). Hippocampal REM sleep reactivations in these studies were structured by the hippocampal theta rhythm, and their effects were synaptic strength depended on the phase of the theta oscillation on which they occurred. Reactivations at theta peaks led to synaptic potentiation while reactivations at theta troughs led to synaptic depotentiation, allowing a bidirectional change in synaptic strength. In rats, the preferred direction of the change of synaptic strength varied as a function of familiarity with the environment: after initial exploration, LTP was more prevalent, but synaptic depotentiation prevailed after the environment became familiar, suggesting that an episodic-declarative transformation of memory traces indeed took place(Poe et al., 2000).
It is notable, however, that hippocampal reactivations in REM sleep were not universally found(Kudrimoti et al., 1999). Furthermore, REM sleep – in contrast to NREM sleep – does not appear to contribute to the sleep-related consolidation of hippocampal memory systems, being instead rather involved in amygdala-related
18
functions(Genzel et al., 2015). It is therefore not clear whether REM sleep indeed plays a role in hippocampal-neocortical memory transformations as a time of general synaptic strengthening of selected synapses.
An elegant and interesting alternative theory of NREM and REM function was recently put forward (Vyazovskiy and Delogu, 2014), drawing inspiration from both SHY and the systems consolidation hypothesis. This hypothesis considered NREM sleep to be a time of synaptic downscaling which is necessary because of the effects of the previous wakefulness, and which takes place during cortical slow waves. However, in line with the local and region-specific nature of these slow waves (Nir et al., 2011), slow wave activity is thought to reflect local synaptic homeostasis processes. Sleep spindles – which generally appear after slow waves have dissipates – indicate a
‘tagging’ of networks which have previously undergone synaptic homeostasis by slow waves. In subsequent REM sleep, the functionality of these ‘tagged’ networks is tested in a safe environment where skeletal muscles are paralyzed (preventing accidents due to sub-optimally functioning cortical networks) and the ‘simulation’ of cortical activity may be what is experienced in dreams. As an increasing time is spent in sleep, the number of cortical networks still in need for synaptic homeostatic regulation decreases, which is reflected in turn by the decreasing number and increasingly regional occurrence of slow waves and the increasing prevalence of sleep spindles and REM sleep. Finally, when the process is completed and no more synaptic homeostatic regulation is necessary, awakening occurs.
Vyazovskiy and Delogu’s account is far from resolving every issue surrounding the functions of NREM and REM sleep, but it provides a framework which is a novel and logical addition to previous theories.
In sum, the functions and mechanisms of sleep cannot be limited to a single process, especially where REM sleep is also considered. Competing theories generally agree about the importance of synaptic changes that occur during sleep, but they disagree about the importance – or even the presence – of synaptic potentiation and depotentiation. Currently, empirical evidence seems to point in the direction that synaptic depotentiation occurs in sleep in a unique manner, in response to the synaptic potentiation that took place during the previous episode of wakefulness, and that this
19
depotentiation, occurring during slow waves, is perhaps the most important mechanism involved in NREM sleep function. The importance of synaptic potentiation by sleep spindles or spindle-ripple complexes is less completely delineated. The functions (and the mechanisms thereof) of REM sleep appear to be even more elusive.
It is probable that the most prominent electrophysiological characteristics of NREM sleep – slow waves, sleep spindles and hippocampal ripples – play similar or complementary functional roles. Of these three, only two – slow waves and sleep spindles – are observable on the scalp EEG. The importance of slow waves for synaptic homeostasis has been previously elaborated in this subsection. However, sleep spindles have been shown to be especially closely associated with cognitive functioning and they have been thoroughly investigated in the studies later presented in this thesis.
Sleep spindles
Sleep spindles are prominent features of NREM sleep, particularly of more shallow stages (Iber et al., 2007). Sleep spindles arise as a result of reduced cholinergic activation which is typical in NREM sleep, and they are generated a network which encompasses thalamocortical, corticothalamic and (thalamic) reticular neurons (Steriade and Deschenes, 1984; Amzica and Steriade, 2000; Steriade, 2000; Fogel and Smith, 2011).
At the descriptive level, sleep spindles are mainly observed throughout the scalp but mainly in midline derivations (frontal, central and parietal) with greater prevalence in the second half of the night where sleep is more shallow (Fogel and Smith, 2011).
While spindles are characterized by a clear topographical prevalence in the aforementioned midline derivations – in line with distribution of the main outputs of their thalamic generators – they are essentially local phenomena (Nir et al., 2011) and much like slow wavesthey were shown to respond to learning involving well-delimited brain areas with locally increased activity at the corresponding sites (Tamaki et al., 2009; Johnson et al., 2012).
The circadian regulation of sleep spindles is, however, quite different from that of slow waves. Unlike slow waves which are regulated in a principally homeostatic manner, sleep spindles generally follow both a circadian and an inverted S process,
20
appearingmost prominently during a clear-cut period of the day, with maximum prevalence achieved during the second half of the night (Dijk and Czeisler, 1995; Dijk et al., 1995). Sleep spindles are profoundly affected by melatonin levels (which also peak during the night), which affects mainly their peak frequency and density (Dijk et al., 1995; Knoblauch et al., 2003), while amplitude and duration are less affected (Knoblauch et al., 2003; Knoblauch et al., 2005).
At the microstructural level, sleep spindles are synchronized to the up-states of cortical slow oscillations (Steriade, 2003; Staresina et al., 2015). This synchronization may contribute to the efficacy of spindle function, as a correlation between intelligence and the coupling strength of sleep spindles to slow oscillations was found (Bodizs et al., 2005).
The main features of sleep spindle generation are well understood and were reviewed recently by (Lüthi, 2013). The thalamic reticular nucleus (TRN), a diffuse structure enveloping most thalamic nuclei is a key element of sleep spindle generation (Fuentealba and Steriade, 2005). The TRN receives inputs from cortical neurons, but it only projects to other thalamic structures (with GABAergic inhibitory synapses) and does not have cortical projections. TRN neurons are active and functionally important both during wakefulness and sleep, but in sleep – due to the absence of ascending monoaminergic (and possibly cholinergic (Steriade, 2003)) inputs – their firing properties change drastically, since in the absence of such inputs their resting membrane potential decreases, leading to the activation of a certain type of voltage-gate Ca2+
channels (T-channels) (McCormick and Bal, 1997; Saper et al., 2010; Lüthi, 2013). T- channels are expressed along the dendrites of TRN cells, where corticothalamic projections terminate. In NREM sleep, these projections are able to provide very strong bursting activity from TRN cells through the T-channels (Fuentealba and Steriade, 2005). In case of cortico-TRN input, TRN-thalamic inhibitory synapses generate burst inhibitory postsynaptic potentials in thalamocortical cells (McCormick and Bal, 1997;
Lüthi, 2013). This in turn leads to a similarly burst-like re-excitation of TRN cells via thalamocortical-reticular connections, inducing a ‘back-and-forth excitation cycle… like two ping-pong players’ (Lüthi, 2013) in thalamocortical and TRN neuron populations.
Thalamocortical cells induce similar rhythms in cortical cell populations as well, which
is what scalp EEG recordings are ultimately able to detect as sleep spindles. The self sustaining neural firing patterns which underlie sleep spindles ultimately terminate due to several limiting mechanisms, including lateral inhibition betwe
inhibitory inputs from lower brainstem areas, the activation of hyperpolarization activated cation-nonselective channels and the desynchronization of cortical activity (Lüthi, 2013). Sleep spindle oscillations are possibly
mechanisms as cortical oscillations, and their occurrences are related and may reflect the strength of cortical connections
illustrates the role of thalamocortical networks in spindle generation, as well as the generation of other rhythms in sleep and wakefulness.
Figure 4. “a |During wakefulness, ascending excitatory input from arousal nuclei to thalamocortical (TC) neurons (red) provides a depolarizing drive that causes thalamocortical
neurons and reticular (RT) neurons (blue) to exhibit single
more-or-less faithful transfer of information from the periphery up to cortical (Ctx) neurons (black). During wakefulness there is also a descending depolarizing drive onto TC neurons from Ctx neurons. b | During deep non
neurons switch into a burst-firing mode which they adopt by default in the absence of external input. The intrinsic ionic conductances of TC neurons favour a rhythmic burst
which is generated following a hyperpolarizing dr
21
is what scalp EEG recordings are ultimately able to detect as sleep spindles. The self sustaining neural firing patterns which underlie sleep spindles ultimately terminate due to several limiting mechanisms, including lateral inhibition betwe
inhibitory inputs from lower brainstem areas, the activation of hyperpolarization nonselective channels and the desynchronization of cortical activity Sleep spindle oscillations are possibly generated by the same or similar mechanisms as cortical oscillations, and their occurrences are related
and may reflect the strength of cortical connections (Werk et al., 2005
illustrates the role of thalamocortical networks in spindle generation, as well as the generation of other rhythms in sleep and wakefulness.
|During wakefulness, ascending excitatory input from arousal nuclei to thalamocortical (TC) neurons (red) provides a depolarizing drive that causes thalamocortical
neurons and reticular (RT) neurons (blue) to exhibit single-spike tonic firing and allows a less faithful transfer of information from the periphery up to cortical (Ctx) neurons (black). During wakefulness there is also a descending depolarizing drive onto TC neurons
| During deep non-rapid-eye-movement (NREM) sleep, the thalamic relay firing mode which they adopt by default in the absence of external input. The intrinsic ionic conductances of TC neurons favour a rhythmic burst
which is generated following a hyperpolarizing drive. Because of the extensive connectivity that is what scalp EEG recordings are ultimately able to detect as sleep spindles. The self- sustaining neural firing patterns which underlie sleep spindles ultimately terminate due to several limiting mechanisms, including lateral inhibition between TRN cells, inhibitory inputs from lower brainstem areas, the activation of hyperpolarization-
nonselective channels and the desynchronization of cortical activity by the same or similar mechanisms as cortical oscillations, and their occurrences are related (Steriade, 2003) Werk et al., 2005). Figure 4.
illustrates the role of thalamocortical networks in spindle generation, as well as the
|During wakefulness, ascending excitatory input from arousal nuclei to thalamocortical (TC) neurons (red) provides a depolarizing drive that causes thalamocortical
spike tonic firing and allows a less faithful transfer of information from the periphery up to cortical (Ctx) neurons (black). During wakefulness there is also a descending depolarizing drive onto TC neurons he thalamic relay firing mode which they adopt by default in the absence of external input. The intrinsic ionic conductances of TC neurons favour a rhythmic burst-firing pattern,
ive. Because of the extensive connectivity that
22
exists among and between thalamic and Ctx neurons, large populations of neurons are induced to fire in synchrony; this is the origin of the slow delta (δ) waves that are the
electroencephalographic signature of deep sleep. During this burst-firing mode, ascending information through the thalamus is blocked. The transition from waking to sleeping also involves thalamic oscillations. In the electroencephalogram (EEG) these are called sleep spindles (highlighted in red on the left-hand EEG trace); they are generated when a burst of spikes from a TC neuron impinges on a GABA (γ-aminobutyric acid)-ergic RT neuron which
then sends a robust inhibitory postsynaptic potential back to the same TC neuron. This hyperpolarizes the cell, which then fires another barrage of spikes on rebound, establishing an oscillation. The length of theinhibitory potential (which is mediated by GABA type A receptors) determines the time until another burst of spikes is generated by the TC neuron103,106 and sets
the frequency at ~7–14 Hz. Although the TC–RT loop is necessary for spindle oscillations, isolated RT neurons can also oscillate with a natural frequency in the same frequency range,
and this property might aid spindle generation.” Figure and caption from (Franks, 2008).
Probably due to their effect on thalamocortical communication, sleep spindles play a key role in the reduced behavioral responsiveness which is generally observed is sleeping animals and humans (Lüthi, 2013). It requires more intensive stimulation to wake up a person during sleep spindles (Yamadori, 1971), and both event-related potentials and fMRI BOLD responses to stimuli are reduced during sleep spindles (Schabus et al., 2012). The activation of GABAergic interneurons including, but not limited to reticular thalamic areas (which are also implicated in spindle generation) underlies the gating of sensory information in the thalamus in general (Bokor et al., 2005; Groh et al., 2014; Rovo et al., 2014). Therefore, the very particular thalamocortical communication pattern during spindle oscillation reflects a mechanism which also regulates the flow of sensory information towards cortical areas in other physiological states.
Still, the most prominent candidate mechanism through which sleep spindles might contribute to cognitive function is not the protection of sleep, but their ability to induce long-term plastic changes in cortical and thalamocortical circuits. The rhythmic activity of TRN cells observed during sleep spindles induces long-term potentiation (LTP) in thalamocortical synapses (Astori and Luthi, 2013). Perhaps even more importantly, the
23
rhythmic cellular firing patterns observed during spindles constitute optimal conditions for long term synaptic changes in the cortex in general (Buzsaki, 1989; Fogel and Smith, 2011), and such synaptic changes – including LTP – were successfully induced experimentally (Rosanova and Ulrich, 2005). Another – but not unrelated – function of sleep spindles is that they are able to coordinate hippocampal ripple activity, which also contributes to long-term plastic changes in the cortex (Siapas and Wilson, 1998;
Inostroza and Born, 2013; Genzel et al., 2014; Staresina et al., 2015). In line with the systems consolidation hypothesis, sleep spindles are thought to be involved in the deafferentation of the cortex from the hippocampus, providing a mechanism to consolidate memory traces (Peyrache et al., 2009; Wierzynski et al., 2009; Genzel et al., 2014).
In line with these physiological characteristics and involvement in LTP generation (and plastic processes in general), sleep spindles were especially frequently implicated in cognitive functioning,that is, memory consolidation and trait intelligence.Evidence about the relationship between sleep spindling and cognition is presented in subsection 1.3.
1.1.3. Methodological Problems – Measuring Spectra and Sleep Spindles
Most contemporary research intended to investigate sleep oscillations, such as spectral components or sleep spindles, uses mathematical algorithms to quantify these oscillations. The precise methodology chosen by such a study is not a trivial question, as the detection or analysis of most sleep oscillations does not have a ‘gold standard’
method which is accepted by all or almost all studies. Visual detection of sleep spindles is sometimes considered as a gold standard (Warby et al., 2014), however, this method is subjective and time consuming. This problem is particularly pervasive in the study of sleep spindles and EEG spectral components, and in our studies much attention was paid to choosing the right methodology.
Sleep spindles are very frequently detected using automatic algorithms. Early automatic detection methods implemented phase-locked loop devices, and they were reported to have sufficient agreement with visual detection to warrant their use in research (Broughton et al., 1978; Campbell et al., 1980). Another early implementation
24
of an automatic spindle detector was built as a combined software-hardware system(Ferri et al., 1989), which was also able to reliably reproduce visual detections.
Pure software solutions of sleep spindle detections were developed only somewhat later (Schimicek et al., 1994) with a specificity of 70% at a specificity point of 90%, with even better results in an altered implementation (Devuyst et al., 2006). Further modern automatic sleep spindle detections use neural networks (Acır and Güzeliş, 2004;
Ventouras et al., 2005) and decision trees (Duman et al., 2009).
There are at least two very important pitfalls in automatic sleep spindle detection which must be avoided by automatic detectors. First, sleep spindles can be either slow and fast spindles, reflecting different generating structures and networks. Slow spindles have a lower frequency and a frontal maximum and they are generally restricted to frontal areas, whereas fast spindles have a higher frequency and a centro-parietal maximum, albeit they are also present in the frontal cortex (Andrillon et al., 2011).
Also, slow and fast spindles have different hemodynamic correlates (Schabus et al., 2007), further reinforcing the concept of two superficially similar, but at their core quite different oscillations.Second, a very important feature of sleep spindle oscillations is that they are characterized by prominent intra-individual stability and inter-individual variability (De Gennaro et al., 2005), with individual parameters heavily affected by age and sex (Driver et al., 1996; Carrier et al., 2001; Huupponen et al., 2002; Genzel et al., 2012). As a result, sleep spindle detector parameters should be expected to take into account that sleep spindles may have different characteristics in different individuals.
The Individual Adjustment Method (IAM, (Bódizs et al., 2009; Ujma et al., 2014)) , developed in our laboratory based on the electrophysiological fingerprint theory of human sleep (De Gennaro et al., 2005; De Gennaro et al., 2008) is an automatic sleep spindle detector specifically designed to account for such individual differences in spindle parameters and take into account the separation of slow and fast spindles. The IAM relies on the shape of the individual NREM sleep EEG spectrum (from frontal and centro-parietal electrodes for slow and fast spindles, respectively) to extract individual sleep spindle frequencies which are used for filtering the EEG data for sleep spindle detection. A slow or fast spindle is detectedif the envelope of the filtered signal exceeds an amplitude threshold, which is determined using the average value of the amplitude
25
spectrum at the edges of the previously determined sleep spindle peaks. This way, both the threshold frequency and the amplitude of sleep spindles is determined in an individually adaptive manner.
Another very common approach in automatic sleep spindle detection is the SIESTA method or its modifications (Anderer et al., 2005). These methods use a generic frequency band (usually 11-16 Hz) to filter EEG data for sleep spindle detection, as well as a generic threshold amplitude (usually 11 µV). Sleep spindles are detected when the amplitude of the filtered signal exceeds this amplitude threshold. Slow and fast spindles are sometimes separated using the peak frequency of the detected signal as a classification parameter: slow spindles have a peak frequency below 13 Hz whereas fast spindles have a frequency over 13 Hz.
A third very common – and perhaps most intuitive – approach of sleep spindle detection is a fixed-frequency, adaptive-amplitude method (FixF)(Schabus et al., 2007;
Ujma et al., 2015a). In this implementation, the EEG signal is filtered to a slow (11-13 Hz) and a fast (13-15 Hz) frequency band, and a sleep spindle is detected when the root mean square of the amplitude of this filtered signal exceeds the 95% percentile. While this method has the merit of separating slow and fast spindles and using an adaptive amplitude criterion – that is, taking into account individual differences in baseline spindle amplitude – the determination of these frequency bands and the 95% percentile as the amplitude cutoff point is not based on empirical data. In fact, a comparison of individual sleep spindle features computed either from IAM or FixF (Ujma et al., 2015a) revealed that while fast spindle parameters can be reliably estimated using the 13-15 Hz frequency window, the 11-13 Hz slow spindle frequency window did not correspond well to empirically determined slow spindle frequencies, with many subjects having even lower peak frequencies and almost all having a much narrower slow spindle frequency window. Consequently, IAM and FixF slow spindle parameters were very different, pointing out the importance of choosing the right detection method.
The approach of using individual frequency bands, adaptive amplitude criteria and an explicit separation of slow and fast spindles is surprisingly rare in the scientific literature, and different studies investigating the relationship between sleep spindling and cognition use quite diverse sleep spindle detection methods. Many studies did not
26
separate slow and fast spindles, instead analyzing sleep spindle events or spectral power from a broader sigma frequency band (Clemens et al., 2005; Fogel and Smith, 2006;
Fogel et al., 2007; Tucker and Fishbein, 2009; Lustenberger et al., 2012; Gruber et al., 2013). Studies which did separate slow and fast spindles generally used a post-hoc classification of spindles based on their central frequency, usually with 13 Hz as the split point (Schabus et al., 2006; Schabus et al., 2008; Chatburn et al., 2013).
Occasionally another separation of slow (11.5-12.5) and fast (13.5-14.5) sigma power bands was also used (Bang et al., 2014). Only a few studies used individually determined sleep spindle frequencies, either by using the IAM method (Bodizs et al., 2005; Bódizs et al., 2008) or by computing individual relative sigma power defined as power ± 2Hz around a single maximal spectral peak relative to the otherwise exponentially declining (as a function of frequency) background EEG spectral power(Gottselig et al., 2002; Geiger et al., 2011). Our results (Ujma et al., 2015a) show that while fast spindles are fairly robust to the implemented specific detection method, with different methods yielding quite similar results, slow spindles are much more sensitive to the correct selection of frequency bands. Empirically determined slow spindle bands are lower than 11 Hz in many subjects, while in others they extend beyond the 13 Hz window, potentially confounding slow and fast spindle detections. It is notable that in studies with fixed detection frequencies (Schabus et al., 2006; Schabus et al., 2008) both slow and fast spindles were correlated with cognitive abilities, while in studies with individually determined frequencies (Bodizs et al., 2005; Ujma et al., 2014) only fast spindles were correlated.
Thus, sleep spindle detection may be affected by an incorrect choice of frequency (and potentially amplitude) thresholds and the lack of separation between slow and fast spindles is a significant potential methodological problem. In order to avoid such errors, we used the IAM method in all the studies reported in this thesis.
Another mathematical tool frequently used in the study of sleep oscillations is spectral analysis. Spectral analysis transforms signals from the time domain to the frequency domain: that is, it determines how much is present in a signal of a sinusoid signal of a given frequency(Keil et al., 2014). The ratio of sinusoidal and cosinusoidal components determines the phase of the oscillation, but this distinction is irrelevant for spectral
27
power, which is determined as the sum of the squared sinusoidal and cosinusoidal components. The importance of spectral components in EEG analysis is that oscillations of a given frequency are thought to reflect the functioning of well-determined brain networks (Nir et al., 2011; Piantoni et al., 2013; Saletin et al., 2013). The shape of the sleep EEG spectrum is stable within individuals but variable between individuals(Finelli et al., 2001; De Gennaro et al., 2005), showing genetic determination (Buckelmuller et al., 2006; Ambrosius et al., 2008; De Gennaro et al., 2008; Landolt, 2011) and a direct relationship with the physical anatomy of the brain (Piantoni et al., 2013; Saletin et al., 2013), which is why sleep EEG spectral components have long been considered candidate markers of cognitive functioning as well as mental status.
While the computation of EEG spectral components is arguably more straightforward than sleep spindle detection, selecting the correct measure of EEG spectral power is still an important methodological feature of any study. The raw spectral power of EEG signals – whether in wakefulness or sleep – follows a pink noise-like power law distribution, with the vast majority of power present in the lowest frequencies (Ferree and Hwa, 2003). Baseline power law trends are sometimes removed from the EEG spectrum by a procedure called detrending.Given the squared amplitudes in the formula of the FFT (serving the basis of power spectral estimation), the logarithmization of the raw spectrum is frequently performed to provide a more linear distribution and enable the use of standard parametric statistics which do not work well with power law distributions. It is notable that the voltage of the EEG signal is first and foremost affected by features not related to neural processes, such as the thickness of the skull and connective tissues (Chauveau et al., 2004), introducing a large amount of noise into the inter-individual differences in the spectral power of the EEG signal. This issue can be avoided by computing the relative spectrum, usually by dividing the spectral power of every frequency bin by the sum of power in all frequency bins, effectively removing the differences in the baseline amplitude of the spectrum and thus correcting for the effect of the default individual EEG voltage. An even more specialized method of assessing the shape (and not the amplitude) of the individual EEG spectrum is to compute z-transformed spectra. The z-transformation of spectral power does not only remove the effects of baseline voltage, but it is particularly sensitive to individual differences in the shape of the spectrum. This method – due to its sensitivity – works
28
best if it is applied to a relatively narrow frequency range, such as the broadly defined sigma (spindle) frequency range, where it has been frequently used to investigate the sleep EEG fingerprint (De Gennaro et al., 2005; Bódizs et al., 2012).
When a sample of subjects is relatively homogeneous – especially in terms of age, sex and physical build – results with absolute (logarithmized) and relative spectra are expected to be similar. If this is not the case, however, then the use of relative spectra may be necessary in order to correct for baseline individual differences in EEG voltage.
In the studies elaborated in this thesis, while absolute logarithmized power was also computed, it was done so in addition to z-transformed spectral power. Just like in case of sleep spindle detection, this combination of methods was chosen in order to use a reliable and unbiased method and avoid common sources of potential error.
1.2. Intelligence
A frequently used – albeit somewhat cynical – definition of intelligence is that it is
“what intelligence tests measure”(Thorndike, 1921). The reason for this seemingly tautological definition is that intelligence – or more precisely, IQ – is a statistical abstraction, a factor. That is, its existence is confirmed by the consistent multicollinearity of several well-observable variables – such as school grades, socioeconomic status or the level of education – which are characterized by a large degree of common variance, also referred to as the g-factor (Spearman, 1927; Carroll, 1997).
While a variable like IQ, arising as a stable amount of common variance in easily observable and psychosocially relevant variables, is less intuitively understandable than many other concepts used in psychology, it is arguably stronger as a construct.
Psychological concepts which are derived from a human language – that is, practically invented as statistical constructs – are frequently easy to grasp, but it is unclear if they are honest to their true meaning. A very strong case is made about ‘emotional intelligence’, where the tests which it is measured by may rather be measuring
‘conformity’(Roberts et al., 2001). That is, just because a psychological concept exists
29
in our language, it is absolutely not certain that it can be translated into a measurable mathematical reality, or that its measurable properties in relation with other psychological concepts will follow what we intuitively consider reasonable. Intelligence as a psychological construct was formed the other way around: the common variance (‘positive manifold’) of many cognitive and socioeconomic variables was discovered (Spearman, 1927), and this common variance was matched with a linguistic concept (‘intelligence’) to help grasp its meaning.
That is, to refer to the positive manifold, the g-factor or IQ (which concepts have no meaning outside the research of intelligence, and therefore accurately reflect the nature of this concept as a mathematical abstraction) as ‘intelligence’ is just an attempt to express an intuitivemeaning of this factor. As with all statistical factors, its naming is subjective and it may be improved by a more careful consideration of the factor structure. That is, the true nature of IQ is best discovered by examining the easily observable and socially, psychologically and culturally important variables it correlates with.
1.2.1. Traditional Views of Intelligence
The concept of a unified and objectively measurable intelligence was first put forward by Galton(Atkinson et al., 2014) who proposed in the late 19th century that a correlation between cognitive ability and reaction time may exist (albeit this was not proven).
Spearman’s studies in the early 20th century(Spearman, 1904; Williams et al., 2003) revealed a correlation between socioeconomic status, cognitive ability and biological variables. Spearman also demonstrated that while different persons may excel in different subdomains of cognitive ability and lag behind in others, their abilities are not uncorrelated: there is a strong presence of a ‘general ability’ which manifests itself in very different areas of cognition.
Spearman’s studies of school-age children also revealed a strong correlation between school grades, subjective peer ratings of intelligence as well as sensory discrimination (Spearman, 1904, 1927), further supporting the view of a ‘general ability’ behind many apparently different domains of cognition. Spearman’s idea of intelligence was that for every cognitive task a general ability (g-factor) as well as a task-specific skill (s-factor)