SURVEY AND SUMMARY
Novel phylogenetic methods are needed for
understanding gene function in the era of mega-scale genome sequencing
L ´aszl ´ o G. Nagy
*, Zsolt Mer ´enyi, Botond Heged ¨ us and Bal ´azs B ´alint
Synthetic and Systems Biology Unit, Institute of Biochemistry, Biological Research Centre, Temesvari krt 62. Szeged 6726, Hungary
Received October 23, 2019; Revised December 15, 2019; Editorial Decision December 16, 2019; Accepted December 31, 2019
ABSTRACT
Ongoing large-scale genome sequencing projects are forecasting a data deluge that will almost cer- tainly overwhelm current analytical capabilities of evolutionary genomics. In contrast to population ge- nomics, there are no standardized methods in evo- lutionary genomics for extracting evolutionary and functional (e.g. gene-trait association) signal from genomic data. Here, we examine how current prac- tices of multi-species comparative genomics per- form in this aspect and point out that many ge- nomic datasets are under-utilized due to the lack of powerful methodologies. As a result, many current analyses emphasize gene families for which some functional data is already available, resulting in a growing gap between functionally well-characterized genes/organisms and the universe of unknowns.
This leaves unknown genes on the ‘dark side’ of genomes, a problem that will not be mitigated by se- quencing more and more genomes, unless we de- velop tools to infer functional hypotheses for un- known genes in a systematic manner. We provide an inventory of recently developed methods capable of predicting gene-gene and gene-trait associations based on comparative data, then argue that realizing the full potential of whole genome datasets requires the integration of phylogenetic comparative methods into genomics, a rich but underutilized toolbox for looking into the past.
INTRODUCTION
The post genomic era has brought about an exponential increase in the number of sequenced genomes, which has virtually eliminated sequence data being the limiting fac- tor in comparative and evolutionary genomics. Currently, there are >200 000 genomes in GenBank (as of 15 July 2019, including nuclear and mitochondrial) and, although prokaryotic and fungal genomes dominate the landscape, plenty of genomes are available for all main lineages. In ad- dition, data are coming along for lesser known or under- represented phyla as well (1–4), especially with the spread of single-cell genomics (5). A whole new level of genomic data deluge is on the horizon with the launch of several large-scale genome sequencing projects, including ones aim- ing to sequence all living organisms on Earth (6) (Earth Biogenome Project) or in the UK (Darwin Tree of Life Project) and others specifically focused on major lineages such as plants (7–9), fungi (10,11) (1000 Fungal Genomes Project, 1KFG), vertebrates (12,13) (Genome 10K), birds (14) (Bird 10 000 genomes, B10K) or insects (15–17) (Insect 5000 Genomes, I5k), among others. Of these projects, the 1000 Fungal genomes project has been the first to break the 1000 genome boundary, as shown by the phylogenetically diverse collection of fungal genomes hosted by MycoCosm (18,19). All these data mean the foundations of comparative and evolutionary genomics, and the data flood we are about to see makes it timely to revisit some broad considerations of how all these data may and/or ought to be analyzed.
The completion of reference genomes for the main model species and decreasing sequencing prices led to the birth of comparative evolutionary genomics or phylogenomics (20), although the latter is more often used in the con- text of genome-scale inference of phylogenies. Compara- tive evolutionary genomics became one of the most rapidly expanding fields in biology, that seeks to explain evolved
*To whom correspondence should be addressed. Tel: +36 62599654; Fax: +36 62433506; Email: lnagy@fungenomelab.com
C The Author(s) 2020. Published by Oxford University Press on behalf of Nucleic Acids Research.
This is an Open Access article distributed under the terms of the Creative Commons Attribution License (http://creativecommons.org/licenses/by/4.0/), which permits unrestricted reuse, distribution, and reproduction in any medium, provided the original work is properly cited.
Downloaded from https://academic.oup.com/nar/article/48/5/2209/5707201 by guest on 25 January 2021
differences between species by using genomic data. Ques- tions that comparative evolutionary genomics seeks to an- swer range from uncovering the phylogenetic relationships among species, understanding the evolution of genetic el- ements (e.g. genes, non-coding regions, etc.), how they af- fect organismal traits or, what genomic changes underlie the evolution of a phenotypic trait (21). The latter question is most promising from the perspective of relating unknown genes to traits of interest and for finding new genes that can fuel applications in biotechnology, agriculture or medicine.
This article is focusing on the field of genomics that aims to relate observed genetic differences to phenotypes and evo- lutionary adaptations (e.g. metabolic capabilities, morpho- logical structures, etc.) by systematic comparisons of whole genome sequences.
ARE WE FULFILLING THE PROMISES OF COMPAR- ATIVE GENOMICS?
Genome sequencing, by cracking the code of life is viewed by many as the ultimate key to decoding species’ biology and for better harnessing the diversity of life for basic the- oretical, practical (biotechnological, medical) and societal challenges. The completion of the human genome and the avenues it opened were awaited with great excitement, for applications ranging from basic research to personalized medicine (22–24). Promises at the time were coming in num- bers, but foreseen benefits to healthcare remained elusive for several years (25–27), leading some to ponder whether the project fulfilled its promises and even whether genomics was more hype than substance (25,28–29). It was only several years later that the human genome’s broad impact, espe- cially on basic research, became widely appreciated. While a genome’s information content is certainly high, extract- ing signals from primary sequence is the real challenge and becomes increasingly so nowadays as the number of se- quenced species grow exponentially (30).
The promises of comparative genomics are also ambi- tious, from understanding organismal biology and evolu- tion, to explaining climate change (6), disease (31) or im- proving biotechnology (11,19) and agriculture (15,17), to name a few. Duly, the interest these promises and projects are sparking is intense. Indeed, combining genomes and phenotypic traits can, in theory, make it possible to answer questions that were only tractable in model species (32) be- fore and will allow us to generate functional hypotheses for genes of the countless numbers of non-model species. This should eventually lead to closing the gap between the in- creasingly rapid accumulation of genomic sequences and the huge backlog of linking loci to phenotypes. It should also help inferring functional hypotheses to the vast regions of the protein space that are currently functionally unchar- acterized (33–35). Given the potentials of large-scale ge- nomics and the theoretical advances, we here present a per- sonal evaluation of how current practices perform in achiev- ing the promises and how we could do better. We posit that current practices under-utilize genomic information and of- fer suggestions on how to improve evolutionary and func- tional inferences from whole genomes.
Known unknowns and unknown unknowns
A fundamental question for comparative genomics is which genomic loci underlie a given organismal trait (21,36). Iden- tifying such genes without prior information is challenging, but comparing genomes of species that have the trait, to those that lack it should, in principle, make it possible. This is one of the great promises of comparative genomics but how much of this is realized?
Among the focal genes of comparative analyses, we dis- tinguish two categories, based on what prior information is available for gene and trait. Genes whose association with the trait is supported by some prior information and we suspect are important for its evolution are referred to as known unknowns. Evidence may be coming from forward or reverse genetics in model species, from RNA-seq stud- ies, functional annotations or many other sources. For ex- ample, a recent study (37) analyzed cytochrome p450 copy numbers in the koala genome in search for dietary adap- tations to a highly toxic eucalypt-based diet. The choice of cytochrome p450 superfamily for scrutiny is based on its known role in detoxification (38), which guided the au- thors’ choice in analyzing this superfamily. The study did not delve into genes that were a priori not known to be linked to detoxification but may be serving that purpose in the koala genome, potentially missing key gene families. In fungal genomics, carbohydrate-active enzymes (CAZy) are some of the most frequently analyzed gene families, com- prising hundreds of individual genes in fungal genomes.
They are known key players of wood-decay, a biotechno- logically relevant trait (e.g. in biofuel production). There- fore, CAZy genes were the first candidates to be analyzed for understanding what genes differentiate efficient and weak wood-decaying fungi from each other (39). They eventu- ally ‘made a big career’ in fungal comparative genomics, partly because they are the workhorse enzymes in wood- decay, but also because they are known players of the game.
Their repertoires in fungal genomes indeed correlate with the species’ ability to decay wood, but are they the com- plete story or only a fraction of the big picture? Other gene families are also certainly needed for the complex process of wood decay, but these have not received even a fraction of the attention CAZymes received, because they are not known and are hard to crack.
Cytochrome p450s and CAZymes are ‘low hanging fruit’
for studies of koala dietary adaptations and fungal wood- decay, respectively, because we can link them to detoxifi- cation and lignocellulose degradation based on prior stud- ies. They are known unknowns: while their analyses can be insightful, both wood-decay and digestion of toxic plants are sufficiently complex and understudied traits that we can assume with confidence that many other genes are also in- volved. We refer to the latter genes as unknown unknowns:
they are linked to the trait, but we have no prior informa- tion on that. Unknown unknowns, might have generic func- tional annotation (e.g. conserved domains or gene ontology terms), but, from the perspective of the trait, are completely unknown and finding them should be an endeavor for com- parative genomics studies.
Downloaded from https://academic.oup.com/nar/article/48/5/2209/5707201 by guest on 25 January 2021
Unduly emphasis on known unknowns
For many evolutionary genomics studies the choice of ge- nomic regions to be analyzed is influenced by prior knowl- edge, i.e. they are focusing on known unknowns. This is usually guided by interest in traits for which information is available from model organisms or some other source. This strategy will yield information ona priori selected sets of genes, in contrast to an unbiased screen which may find un- known unknowns that show a stronger link to the pheno- type, but are not known yet. Restricting focus on known un- knowns, thus, under-utilizes sequenced genomes and leaves some of the signal in the data untapped. This is not opti- mal, as combining genomes with traits has the potential to highlight unknown unknowns even in species or clades that are not amenable to laboratory experimentation (21). While new genomes are being published at an unprecedented rate, very few studies report on unknown unknowns, which re- sults in an over-representation of already known genes in genomic studies. Some families get analyzed over and over again (see CAZy example for fungi, or a small subset of hu- man genes (40)), whereas others remain on the ‘dark side’ of genomes, receiving no attention at all. This trend does not help closing the gap between genes of known and unknown function as more and more genomes become available and is in contrast with some of the basic goals of evolutionary genomics.
How many unknown unknowns are there?
Assessing the number of unknown unknowns from a trait’s perspective is challenging because there is an unknown number of genes underlying any given phenotypic trait.
However, it is easy to provide an estimate from the per- spective of genes of unknown functions (GUFs). Sequenced genomes usually contain a considerable fraction of genes whose function is unknown or that cannot be assigned any functional (e.g. pfam or GO) annotations. Such genes have proven the richest source of discovery of new protein folds and families (35).
A broad group of GUFs are those that lack any kind of functional annotation. Such genes are often just termed ‘hy- pothetical protein’ in genome annotations, because it is im- possible to annotate them based on similarity to function- ally characterized genes from other organisms. We assessed the number of GUFs based on InterPro domain contents in 573 eukaryotic genomes (Figure1A). The proportion of genes without known InterPro domains is lowest for meta- zoans (13–61% per genome) and highest in protist lineages, where 35–87% of predicted genes have no functional anno- tations at all. Fungi (20–68%) and plants (24–54%) are in- termediate, yet>30% of the genes in any genome are GUFs.
Although some of such genes might be prediction errors, most are conserved across multiple species, highlighting the need for systematic approaches to discovering gene func- tion. This is a particularly pressing need in less studied lin- eages such as protists or fungi (except yeasts), whereas the situation looks brighter for metazoans, which have tradi- tionally been in the spotlight. In line with this, the number of lineage-specific InterPro annotation terms (i.e. those only known in a given kingdom) are highest in animals, but low- est in protists and fungi (Figure 1B), likely reflecting the
amount of effort made to catalog conserved domain sig- natures rather than true differences in the number of con- served domains in these lineages.
We obtained another estimate of GUFs from genes to which precise functional hypotheses can be propagated based on 1-to-1 orthology relationships. We analyzed these patterns in 461 eukaryote species and pairwise orthology obtained from the OMA database (41). Genes for which more or less precise function can be inferred based on comparisons of 1-to-1 orthologs clearly show an enrich- ment around intensely researched model species (Figure 1C), with the two highest peaks corresponding to yeasts and vertebrates. Up to 80% of the genes of non-model species in these groups can be annotated with orthology- based functions, as opposed to 41, 38, 50 and 43% in pro- tists, Archeoplastida, filamentous fungi (i.e. non-yeasts), and non-vertebrate metazoans, respectively. These figures aptly reflect the biased distribution of functional informa- tion around model species and calls for approaches target- ing non-model organisms. For example, in fungi most func- tional information is coming from yeast, which has a highly stripped genome (42) that represents basic eukaryote func- tions properly, but not necessarily does conserved traits of filamentous fungi. Therefore, although some model fungi are particularly well-studied, the space of gene functions across the entire fungal kingdom in general remains poorly known. A similar bias has been observed within individual organisms; for example, it was reported that most research concentrates on ca. 2000 of the 19 000 genes on the human genome (40).
These data reveal a large number of GUFs in any given eukaryotic genome, which is consistent with some previous reports (33) and calls for systematic efforts and the develop- ment of approaches for charting their functional landscape.
UNKNOWN UNKNOWNS CAN BE IDENTIFIED USING PHYLOGENY-AWARE APPROACHES
There is a myriad of approaches for finding genes linked to a particular phenotype, from mutagenesis assays, dele- tion libraries, co-expression analyses (33) etc. In compara- tive genomics associations between traits and genetic vari- ants are inferred by comparing groups of genomes with or without the trait. In population genomics, this is now routinely accomplished by genome-wide association stud- ies (GWAS) (43,44), analyses of quantitative trait loci (21) and related methods. GWASs investigate the entire genome and systematically look for co-occurrence patterns of a ge- netic variant and a trait in sequenced individuals (45). Al- though powerful at the population level, GWAS cannot be applied to comparisons of related species (21) because it cannot account for phylogenetic relationships (although at- tempts exist for modeling within-population phylogenetic structure (46,47)). The phylogeny is a source of strong sig- nal that can mislead non-phylogeny-aware statistics (48–
50), but a method that is similarly powerful as GWASs has not yet been widely adopted in multi-species comparative genomics.
What options do we have for finding unknown unknowns in comparative studies of several species? The situation is quite simple in prokaryotes where gene presence/absence
Downloaded from https://academic.oup.com/nar/article/48/5/2209/5707201 by guest on 25 January 2021
0.25 0.75 0.50 1.00
0.25
0.75 0.50
1.00 0.25 0.750.50 1.00
0.25 0.75 0.50 1.00
Protists
Metaz oa Fu
ngi protists
U. may
S. pom
S. cer
D. mel anog
aste r
X. tro G. gal M. mus
R. nor H. sapiens
C. elegans N. cra
D.dis A. tha
M. tru
0 1000 2000 3000 0 0.5 1.0
Fraction of proteome with InterPro domains
Metazoa Fungi Archeoplastida Protists Metazoa Fungi Archeoplastida Protists
No. of supergroup-specific InterPro domains
A
C B
Protists
Figure 1. GUFs make up a significant proportion of eukaryotic genomes. (A) The proportion of protein coding genes across genomes of 461 species that can be annotated with approximate functions via 1-to-1 orthology to manually curated genes, based on the assumption that clear 1-to-1 orthology relationships are indicative of conserved and shared function. Orthology information and the tree were taken from the Orthologous MAtrix database (41). Tree was subsequently manually resolved to supergroups based on Deutekomet al.(121). Model systems from which functional information was propagated by orthology are marked with blue bars and the names of the most important ones are shown. Abbreviations as follows: H.sapiens––Homo sapiens, R.nor––Rattus norvegicus, M.mus––Mus musculus, G.gal––Gallus gallus, X.tro––Xenopus tropicalis, D.melanogaster––Drosophila melanogaster, C.elegans––Caenorhabditis elegans, N.cra––Neurospora crassa, S.cer––Saccharomyces cerevisiae, S.pom––Schizosaccharomyces pombe, U.may––Ustilago maydis, D.dis––Dictyostelium discoideum, A.tha––Arabidopsis thaliana, M.tru––Medicago truncatula. (B) Mean proportions of genes that contain known conserved domains from the InterPro database broken down by major eukaryotic group. Genomes were annotated with InterPro domains using Inter- ProScan 77.0 (only the Pfam and CDD databases were considered, ignoring repeats and Domains of unknown Function,E-value cutoff 10−5). (C) The number of lineage-specific InterPro terms in the Metazoa, Fungi, Archeoplastida and Protist groups (collectively). Lineage specificity was assessed based on the array of species in which a given InterPro term was found.
correlates well with traits (e.g. metabolic capabilities) and phylogeny may not strongly interfere with the analysis due to rampant HGT across species. For those situations, mod- ified phylogenetic profiling methods could be used (Table 1). Phylogenetic profiling (51,52) was designed to find gene–
gene co-occurrence patterns in a panel of species, as a way to identify functional gene modules and propagate functional annotations from one gene to the other (53). Although de- signed to find gene-gene associations, the original algorithm could easily be adapted to find gene-trait associations (see e.g. (54)). However, phylogenetic profiling does not con- sider the phylogenetic relationships of the species (despite its name), for which it has been criticized and shown to per- form inferior to truly phylogenetic methods (49–50,55–56) (see Figure2A). Barker and Pagel (49,50) showed that ac- counting for phylogenetic non-independence in the data us- ing continuous-time Markov models in a maximum like- lihood framework significantly improves the detection of gene-gene associations, especially if the model constrains genes to behave like Dollo characters (49).
The more severe limitation of phylogenetic profil- ing for eukaryotic genomics is that it considers simple presence/absence profiles of gene families (Table1), which is problematic because eukaryotic gene families have intri- cate duplication/loss histories (55,57–58). The application of phylogenetic profiling to eukaryotes has, therefore, been limited (56,59), although examples of successful applica- tions exist, especially for simple, single-copy gene families, like metabolic gene clusters (60,61) or in the context of strict 1-to-1 orthologs (54).
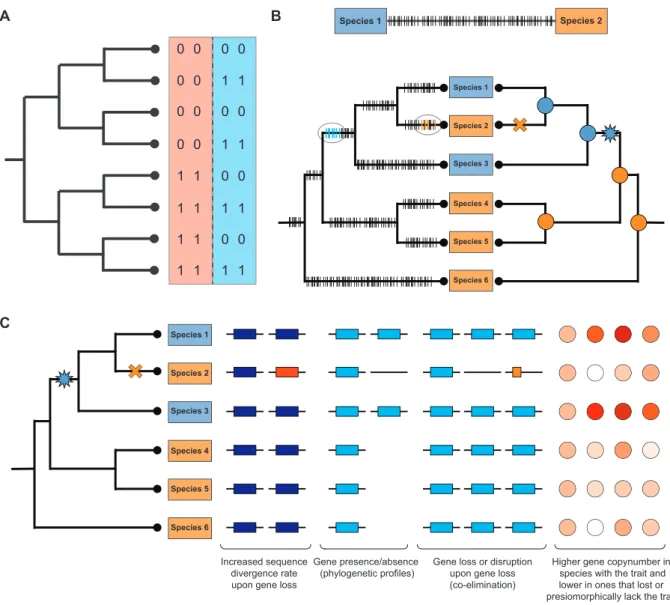
Finding links between genetics and trait has to consider three factors: the trait values of the compared species, the evolutionary history of each of the genetic elements (e.g.
gene families) available for the analysis and the species phy- logeny (Figure2A and B). Parsimony- or likelihood-based methods (62,63) can be used to map genetic changes and trait gains/losses onto the phylogeny, followed by assess- ing the level of correlation between mapping of the trait and that for each of the genetic elements. Of the myriad types of genetic changes, gene family origins, sequence di-
Downloaded from https://academic.oup.com/nar/article/48/5/2209/5707201 by guest on 25 January 2021
Species 1
Species 6 Species 5 Species 4 Species 3 Species 2
Species 1 Species 2
Species 1
Species 6 Species 5 Species 4 Species 3 Species 2
Increased sequence divergence rate upon gene loss
Gene presence/absence (phylogenetic profiles)
Gene loss or disruption upon gene loss (co-elimination)
Higher gene copynumber in species with the trait and lower in ones that lost or presiomorphically lack the trait
1 1 1 1 0 0 0 0
1 1 1 1 0 0 0 0
1 1
1 1
0 0 0
1 1
1 1
0 0
0 0 0 A
C
B
Figure 2. Basic principles of finding associations in genomics data. (A) A simple example illustrating the need of considering the phylogeny in comparative analyses of genomic data. Consider two pairs of genes (denoted by red and blue backgrounds) either present (‘1’) or absent (‘0’) in the eight species.
Similarity in the presence/absence patterns of the first gene pair (red) are best explained by shared inheritance from the common ancestor. The second gene pair, on the other hand, can be explained by four coincident loss events along terminal branches, providing evidence for correlated evolution, and, thus potential functional linkage. Adapted from Barkeret al.(49). Note that a similar logic works for detecting gene–phenotype associations. (B) Pairwise comparisons (upper panel) fail to adequately resolve the timing of genetic changes (marked by horizontal dashes), necessitating the use of phylogenetic methods which, on the other hand, can localize genetic changes to specific branches of the tree (bottom, left tree) and can narrow down the range of potentially relevant changes when compared with reconstructions of trait evolution (bottom, right tree). Trait distribution on the tree is shown by blue and orange rectangles and corresponding colored circles denote ancestral states. The gain and loss of the blue trait is denoted by a blue star and orange cross, respectively. (C) Some of the signal types that can inform analyses of gene– trait association. See text for explanation.
vergence, gene presence/absence and gene duplication and loss patterns are most commonly analyzed (Figure 2C), probably because these can be inferred from organismal gene catalogs relatively easily (see recent reviews (64–66)).
In a comparative perspective, however, the logic of mapping duplications/losses can be extended easily to any type of ge- netic element in which homology relations (i.e. orthology, paralogy) can be established and its evolutionary history be reconstructed. Such mappings (67) provide information on the timing, temporal and taxonomic distribution of genetic changes and can be mined for various attributes, such as as- sociations with trait evolution. It can also be used to infer
which gene families show the highest duplication/loss rate across the trees, in specific clades or branches of the tree.
Trait gain/loss signal informs searches for unknown un- knowns
Theory dictates that, of the thousands of genes and non- coding elements in a genome, the ones that are linked to a trait should show correlated evolutionary changes with it. That is, the gain or loss of the trait should correlate with gains or losses of genetic elements, which is identifiable when viewed across a panel of species. The ideal, ‘textbook’
Downloaded from https://academic.oup.com/nar/article/48/5/2209/5707201 by guest on 25 January 2021
Table 1. Methods for finding associations between genomic features based on macroevolutionary comparative data
Method Type of association detected Principle Strength Limitation Refs.
Phylogenetic profiling
Gene–gene Co-occurrence of
genes across a panel of species
Simple, fast, widespread method
Cannot correct for phylogeny; cannot consider gene copynumber (only presence/absence)
(52,53)
CLIME Gene–gene Partitions genes
across a panel of species into groups sharing a similar evolutionary history
Phylogeny aware;
statistically sound and sensitive (incorporates tree HMMs); adaptable to phenotypes with modification
Cannot consider gene copynumber (only presence/absence)
(90)
Barkeret al.
2007
Gene–gene Identifies
correlated gain/loss patterns in 1-to-1 orthogroups
Phylogeny aware;
statistically well founded; adaptable to phenotypes with modification
Cannot consider gene copynumber (only presence/absence); the applied Markov models work poorly for Dollo-like characters (e.g. genes)
(49,50)
‘Forward genomics’
Gene–phenotype Divergence from
an ancestral sequence and co-elimination of genes in trait-preserving versus trait-loss species
Phylogeny aware;
high sensitivity and specificity
Cannot consider gene copynumber (only presence/absence); only considers losses
(83,89)
REforge Cis-regulatory
sequence–phenotype
Same as ‘forward genomics’, for transcription factor binding sites
Phylogeny aware;
considers cis-regulatory sequences; high sensitivity and specificity
Only considers losses;
needs prior TFBS information
(88)
COMPARE Gene–phenotype Identifies shifts in
gene duplication and loss rates upon the emergence and loss of a trait, respectively
Can analyze multigene families;
integrates trait gain and loss
information
Only considers gene duplications/losses (adaptable to other data types);
(42,45)
Chikinaet al. Gene–phenotype Contrasts the rate of sequence evolution in trait-preserving versus trait-loss species
Phylogeny aware;
can consider sequence-level divergence
Limited to 1-to-1 orthologs; only considers losses
(84,117)
All methods except phylogenetic profiling are computationally intensive, computational complexity is therefore not listed among the limitations.
case involves a single change, such as a gene duplication or a single nucleotide polymorphism that is necessary and suf- ficient for a new trait to evolve. This is probably rarely the case (although examples exist (68)), however, and an array of changes are probably more often necessary for the emer- gence of the trait. Many of these changes might predate the trait in evolutionary time, whereas a single or a few might directly lead to its manifestation as a phenotype (cf. thresh- old model (69)). It should be noted that the gain of the trait may also correlate with a range of genetic changes that are induced by, rather than being causative of, its emergence, making it hard to distinguish correlation from causation.
Using this logic, genetic changes that correlate with the emergence of a trait can be identified in genome-wide cat- alogs of genetic innovations. Several methods have been proposed for this (see below and Table 1), although, as may be expected in new fields, no single method has yet been applied more than a few times. To inform our search, we should understand the phylogenetic relationships of the
species being compared and we should know in which node(s) along this phylogeny the trait showed changes. An- cestral character state reconstructions can be used to map gain(s) and loss(es) of the trait onto the phylogeny and ob- tain a view of character state transformations (see recent re- views (70–72)). From the perspective of the genetics, a range of signals may be analyzed, including changes in selection regime,de novogene (family) birth, gene duplication/loss, rearrangements, rewiring, SNPs, regulatory networks, splic- ing and expression patterns (73), epigenetics, etc. In the sim- plest approach, one may ask if the group of species with the trait (including their ancestral nodes) are enriched for cer- tain genes relative to those not having the trait, given the phylogeny. Another simple approach is asking what gene families (orthogroups) are gained/lost in parts of the tree where the trait is gained or lost. Several example studies (42,54,74–75) and dedicated pipelines (76,77) testify the va- lidity of these approaches, which is, however, conditioned on the correct identification of strict orthogroups and on
Downloaded from https://academic.oup.com/nar/article/48/5/2209/5707201 by guest on 25 January 2021
simple gene presence-absence being a good predictor of trait evolution. This is often not the case, as evident, for exam- ple, from the deep conservation of multicellularity-related genes in many clades (78,79). A higher resolution approach considers not only gene family origin and loss, but also gene duplication and loss (80), providing a fine-grained view on genetic changes in relation to changes in trait values (see below).
Because we are looking for correlation, the more char- acter state transitions the trait shows across the phylogeny, the more precise our search can get (81). A trait with a sin- gle gain on the tree allows us to identify genetic changes that are coincident with its emergence, which potentially yields a long list of genes, among which we cannot differentiate further, unless we have other types of data. A trait with two state transitions (e.g. a gain and a loss) gives us more precision, by allowing us to identify genes that change in both cases when the trait does and may be viewed as the minimum number of state changes necessary to find gene–
phenotype associations. Trait loss, in particular, convergent loss, can provide valuable information for identifying linked genetics because relaxed selection on the genetics of the lost trait leads to divergence and/or complete elimination of the underlying genetic elements (recently termed co-elimination of genes (82)).
Datasets with convergent trait losses are particularly signal-rich, because losses happen to a homologous genetic background and therefore genetic changes are likely shared by convergent loss events. Several studies exploited conver- gent losses to pinpoint genes linked to the trait. Hilleret al.
(83) devised an approach to find genes, across all alignable genomic loci, with an increased rate of sequence divergence in species that lost a given phenotype (in the study, the abil- ity to synthesize vitamin C) (see also an alternative method (84)). The method has been extended to the complete loss of genes (85,86) and to screening divergence in transcription factor binding sites (87,88) in relation to trait loss, the latter vividly demonstrating that the logic is not only applicable to genes, but also other genetic elements. Phylogenetically cor- rected versions of the method (utilizing phylogenetic gener- alized least squares) have also been developed and used to find vision-related genes in a dataset that contains two in- dependently evolved subterranean mammals (89). Because the logic of these approaches is similar to that of forward genetics, the term ‘forward genomics’ has been coined (83) and it has been argued that collections of phenotypic data would allow many-to-many analyses of trait––gene associ- ation.
CLIME (90) is a Bayesian tool that considers the species tree topology and gene gain and losses to infer groups of genes that share the same evolutionary history (described by tree HMM-s). Such groups may represent functional mod- ules or pathways (evolutionarily conserved modules) and can be used to infer putative functions for unknown genes.
CLIME can be considered a sophisticated model-based and phylogeny aware phylogenetic profiling algorithm. It was re- ported to perform better on presence/absence matrix of ho- mologs than on strict 1-to-1 ortholog matrices. The simul- taneous inference of optimal gene partitioning scheme and parameters of HMMs describing the evolutionary history of the genes in one Bayesian MCMC framework is attrac-
tive and yields high statistical power. CLIME was found to perform well on genes with6 losses and moderately well on ones with4 losses (90).
Considering gene duplication/loss rates instead of gene presence/absence can further improve predictions. The COMPARE (42,55) pipeline integrates signals of gene du- plication and loss with trait gain and loss for predicting gene family––trait associations. It uses gene trees to infer gene duplication/loss events (based on the species (91,92) overlap principle), taking into account the complex one-to- many orthology/paralogy relationships (64–65,91,93) char- acteristic of eukaryotic gene families. Inferred duplica- tions and losses are mapped onto the phylogenetic species tree, yielding reconstructed ancestral genomes and fully resolved gene duplication and loss histories across clades and through time. This can be analyzed using comparative methods or mined for gene families that show elevated du- plication rate in part(s) of the tree where a trait is gained and/or elevated loss rates where it is lost (55). This method has been used to infer the tempo and mode of genome evo- lution through time and across clades (94–96), to recon- struct genetic innovations underpinning the evolution of multicellular fungi (78,97), that of the convergent origins of yeasts (42) and to make predictions on the genetic bases of efficient wood-decay strategies by fungi (55). This latter exercise was aimed to find unknown unknowns of the ge- netics of wood-decay. The search returned 409 gene families which, as expected, contained several CAZyme families that were previously reported to be associated with wood-decay (i.e. known unknowns) but also hundreds of novel fami- lies. A comparison to three gene expression datasets showed that>60% of these families were also significantly upregu- lated when wood was the single carbon source in the experi- ment, providing independent validation for the predictions.
It should be noted that wood-decay represents a fitting trait for this approach, because it evolved once in Agari- comycetes fungi and was lost several times (seven losses in the dataset). Nonetheless, simulations showed that COM- PARE had high precision in detecting gene–trait associa- tions even for traits with a single gain and a single loss (55).
This highlights the power of using gene duplication/loss rates for understanding genome evolution, which comes at a high-computational cost, however, and the validity of the findings is conditional on accurate gene family assignments (i.e. orthology and paralogy detection).
Finding unknown unknowns can also be a daunting task and sometimes will not yield sensible results. A search for gene families that fit the phylogenetic pattern of nitrogen- fixing symbioses of plants in a dataset of 37 genomes failed to find any positive hits (98). However, it turned out this was because the evolutionary history of nitrogen-fixing sym- bioses is not accurately described by the phylogenetically most parsimonious scenario (single gain, multiple losses), which eventually suggested a mechanism of trait evolution that cannot be expected to fit into a search strategy like that (99).
These examples show the wide range of approaches that can be used to identify unknown unknowns using compar- ative genomics. The methods are available, though there is not a long record of their application in evolutionary ge- nomics, a status that will hopefully change in the near fu-
Downloaded from https://academic.oup.com/nar/article/48/5/2209/5707201 by guest on 25 January 2021
ture. A common feature of all these is the explicit model- ing of phylogenetic relationships that allows the analysis to distinguish between similarity caused by common descent from that caused by similar selective pressures (49). Phylo- genetic comparative methods have, for decades, been devel- oped for these very situations, although mostly in isolation from genomics. We next argue that better integration of phy- logenetic methods will empower us to answer more exciting questions in evolutionary genomics.
Phylogenetic comparative methods are a rich toolbox for ge- nomics
Phylogenetic comparative methods are statistical ap- proaches that combine information on species relatedness with contemporary trait values to infer historical patterns of evolution (48,71). We will not go into details about meth- ods (only refer to recent reviews), just note that there are elaborate models for analyzing various attributes of the evo- lution of discrete or continuous characters, which could be transplanted into genomics to answer new types of ques- tions on genome or trait evolution. We offer a few exam- ples and note in parentheses the potential applications in the context of genomics. Without attempting to be exhaus- tive, established methods exist for analyzing gains and losses of character states (48,100–101) (e.g. presence/absence of a genetic element, expression level) across the phylogeny, inferring changes in trait values (e.g. expression values) (102) along trees, the distribution of character state changes across time or clades (71,103) (e.g. assessing rates of ge- netic evolution through time), for assessing variation in the timing of tree branching events (104–107) (which, in gene trees mean duplications) or for reconstructing ances- tral character states (many of these have been adopted in an- cestral gene content/gene order/gene sequence reconstruc- tions) (67,83,88–89,108–111). We argue that these methods represent a largely unexploited methodological resource for genomics and that they could be used to extract valuable signal from genomic datasets. One aspect that was quickly adopted by genomicists are parsimony-based methods for inferring the placement of gene duplications/losses or other genetic events (112,113), ancestral genomes (109) or gene order. Dollo parsimony is especially well-suited to genetic data (62) and is conceptually easy to grasp. However, there is a suite of other methods that could be deployed in com- parative genomics. For example, by applying the Binary- state speciation and extinction (BISSE) model (114), which measures a binary trait’s effect on lineage diversification, to gene trees, it was possible to show that class-II-peroxidases (which degrade lignin in plant tissues) show a significantly higher gene duplication rate in efficient wood-decay fungi than in weaker or non-decayers (39). Although class-II- peroxidases were known before as key players of wood- decay, this analysis is proof-of-concept that phylogenetic comparative methods can be used in novel ways to extract valuable signal from genomic datasets. Another attractive approach for analyzing the genetics of a trait would be as- suming a gradual assembly of a genetic toolkit in a way similar to what the threshold model for phylogenetic com- parative analyses implements (69,115). In that model, the discrete (presence/absence) trait we observe is the function
of a continuous underlying quantity (liability (69), e.g. ge- netic innovations) that, if builds up to a sufficient level, al- lows the trait to manifest. One can envision applications of this model to complex multigenic traits, where genetic innovations can be expected to come along in a gradual manner, making traditional analytical methods inadequate.
These examples illustrate, along with several others above, that phylogenetics offers a largely untapped pool of tools for evolutionary genomics.
Computational challenges
A significant question is how current methods scale with the number of genomes analyzed and whether we will be able to deal with the flood of data expected in the coming years.
Most of the pipelines discussed above (55,83–84,90) start with computationally intensive steps (all-vs-all searches, or- thology, gene tree and species tree inference or combina- tions of these) and thus how these scale with the number of genomes analyzed determines the overall computational burden of the analysis. To date, phenotype–genotype asso- ciations have been analyzed in datasets comprising up to 62 or 100 mammalian species by forward genomics (116,117), and up to 62 and 117 fungal genomes by COMPARE (55) (Miyauchiet al.in preparation). Run times for large anal- yses can be prohibitive and require high-performance com- puting facilities. Fast methods that allow similarity searches and orthology inference in thousands of genomes without compromising accuracy are now becoming available (see e.g. (118,119)) and preliminary analyses using these sug- gest that analyses of up to 1000 genomes are feasible (Balint et al., unpublished data). Similarly, the need to infer species trees could soon be bypassed as large-scale genomic trees, from which topologies for subsets of species can be ex- tracted, become increasingly available.
A promising strategy for bypassing the need of re- running some of the computationally intensive steps is the integration and periodic updating of results into openly available and searchable databases. These could be mined for associations with any trait that shows state transitions in the suite of species represented and could provide an open platform for predicting gene function based on phy- logenomics.
CONCLUSION
Exploring complex datasets is a prime challenge in today’s biology. Much of genomics currently is explorative––that is, we let the data guide us toward interesting patterns––and the more efficiently this happens, the more efficiently we get to discoveries and can generate hypotheses. Therefore, creativity in data analysis needs to be emphasized and en- hancing signal extraction from currently available genomics data should be a priority. We argued above that for evolu- tionary genomics, phylogenetic comparative methods pro- vide a rich and under-exploited toolbox that evolutionary biologists have been developing for many decades. Evolu- tionary genomics could build on that or other approaches (e.g. artificial intelligence methods (120)) to extract signal and make informed predictions on gene–phenotype associ- ations, genome evolution or the principles of evolutionary adaptation from genome-scale data.
Downloaded from https://academic.oup.com/nar/article/48/5/2209/5707201 by guest on 25 January 2021
While some would probably argue that increasing the size of genomics datasets, better integration of different data types (e.g. genomic, transcriptomic, proteomic), higher res- olution (e.g. single-cell) or more reference-quality assem- blies (6) is the way to go in evolutionary genomics, our standpoint is that better approaches for analyzing the data at hand and the extension of current methods to utilize multiple evolutionary signals in comparative datasets (gene duplications/losses, parallel amino acid changes, positive selection) are of utmost importance. This is not only be- cause these would allow making biological inferences from data already at hand, but also because better extraction of signal from genomic data can provide functional, testable hypotheses and can drive -omics science toward a more hypothesis-driven state.
FUNDING
European Research Council [758161]; Hungarian National Research, Development and Innovation office [Ginop- 2.3.2-15-00001]. Funding for open access charge: European Research Council [758161].
Conflict of interest statement.None declared.
REFERENCES
1. Sibbald,S.J. and Archibald,J.M. (2017) More protist genomes needed.Nat. Ecol. Evol.,1, 145.
2. Spang,A., Eme,L., Saw,J.H., Caceres,E.F.,
Zaremba-Niedzwiedzka,K., Lombard,J., Guy,L. and Ettema,T.J.G.
(2018) Asgard archaea are the closest prokaryotic relatives of eukaryotes.PLoS Genet.,14, e1007080.
3. Lax,G., Eglit,Y., Eme,L., Bertrand,E.M., Roger,A.J. and Simpson,A.G.B. (2018) Hemimastigophora is a novel
supra-kingdom-level lineage of eukaryotes.Nature,564, 410–414.
4. Strassert,J.F.H., Jamy,M., Mylnikov,A.P., Tikhonenkov,D.V. and Burki,F. (2018) New phylogenomic analysis of the enigmatic phylum Telonemia further resolves the eukaryote tree of life.Mol. Biol.
Evol.,36, 757–765.
5. Strassert,J.F.H., Karnkowska,A., Hehenberger,E., Del Campo,J., Kolisko,M., Okamoto,N., Burki,F., Janouˇskovec,J., Poirier,C., Leonard,G.et al.(2018) Single cell genomics of uncultured marine alveolates shows paraphyly of basal dinoflagellates.ISME J.,12, 304–308.
6. Lewin,H.A., Robinson,G.E., Kress,W.J., Baker,W.J., Coddington,J., Crandall,K.A., Durbin,R., Edwards,S.V., Forest,F., Gilbert,M.T.P.
et al.(2018) Earth BioGenome Project: sequencing life for the future of life.Proc. Natl. Acad. Sci. U.S.A.,115, 4325–4333.
7. Cheng,S., Melkonian,M., Smith,S.A., Brockington,S., Archibald,J.M., Delaux,P.M., Li,F.W., Melkonian,B.,
Mavrodiev,E.V., Sun,W.et al.(2018) 10KP: A phylodiverse genome sequencing plan.Gigascience.,7, 1–9.
8. Twyford,A.D. (2018) The road to 10,000 plant genomes.Nat.
Plants,4, 312–313.
9. Normile,D. (2017) Plant scientists plan massive effort to sequence 10,000 genomes.Science, doi:10.1126/science.aan7165.
10. Stajich,J.E. (2017) Fungal genomes and insights into the evolution of the kingdom. In: Heitman,J, Howlett,BJ, Crous,PW,
Stukenbrock,EH, James,TY and Gow,NAR (eds).The Fungal Kingdom. American Society of Microbiology. pp. 619–633.
11. Grigoriev I,V., Cullen,D., Goodwin,S.B., Hibbett,D., Jeffries,T.W., Kubicek,C.P., Kuske,C., Magnuson,J.K., Martin,F., Spatafora,J.W.
et al.(2011) Fueling the future with fungal genomics.Mycology,2, 192–209.
12. Koepfli,K.-.P., Paten,B. and O’Brien,S.J. (2015) The genome 10K Project: a way forward.Annu. Rev. Anim. Biosci.,3, 57–111.
13. Haussler,D., O’Brien,S.J., Ryder,O.A., Keith Barker,F., Clamp,M., Crawford,A.J., Hanner,R., Hanotte,O., Johnson,W.E., McGuire,J.A.
et al.(2009) Genome 10K: a proposal to obtain whole-genome sequence for 10000 vertebrate species.J. Hered.,100, 659–674.
14. Zhang,G. (2015) Genomics: bird sequencing project takes off.
Nature,522, 34.
15. Evans,J.D., Brown,S.J., Hackett,K.J.J., Robinson,G., Richards,S., Lawson,D., Elsik,C., Coddington,J., Edwards,O., Emrich,S.et al.
(2013) The i5K initiative: advancing arthropod genomics for knowledge, human health, agriculture, and the environment.J.
Hered.,104, 595–600.
16. Levine,R. (2011) i5k: The 5,000 insect genome project.Am.
Entomol,57, 110–113.
17. Robinson,G.E., Hackett,K.J., Purcell-Miramontes,M., Brown,S.J., Evans,J.D., Goldsmith,M.R., Lawson,D., Okamuro,J.,
Robertson,H.M. and Schneider,D.J. (2011) Creating a buzz about insect genomes.Science,331, 1386.
18. Nordberg,H., Cantor,M., Dusheyko,S., Hua,S., Poliakov,A., Shabalov,I., Smirnova,T., Grigoriev,I.V. and Dubchak,I. (2014) The genome portal of the Department of Energy Joint Genome Institute:
2014; updates.Nucleic Acids Res.,42, D26–D31.
19. Grigoriev,I.V., Nikitin,R., Haridas,S., Kuo,A., Ohm,R., Otillar,R., Riley,R., Salamov,A., Zhao,X., Korzeniewski,F.et al.(2014) MycoCosm portal: Gearing up for 1000 fungal genomes.Nucleic Acids Res.,42, D699–D704.
20. Eisen,J.A. (1998) Phylogenomics: improving functional predictions for uncharacterized genes by evolutionary analysis.Genome Res.,8, 163–167.
21. Dunn,C.W. and Munro,C. (2016) Comparative genomics and the diversity of life.Zool. Scr.,45, 5–13.
22. Collins,F.S. (1999) Shattuck lecture––medical and societal consequences of the human genome project.N. Engl. J. Med.,341, 28–37.
23. Liggett,S.B. (2001) Pharmacogenetic applications of the human genome project.Nat. Med.,7, 281–283.
24. Gordon,J. (1989) The Human Genome Project promises insights into aging.Geriatrics,44, 89–91.
25. Joyner,M.J. and Paneth,N. (2019) Promises, promises, and precision medicine.J. Clin. Invest.,129, 946–948.
26. Shendure,J., Findlay,G.M. and Snyder,M.W. (2019) Genomic medicine–progress, pitfalls, and promise.Cell,177, 45–57.
27. Wade,N. (2010)A Decade Later, Genetic Map Yields Few New Cures. New York Times, NY.
28. Taylor,P. (2011) The human genome project, 10 years in: Did they oversell the revolution?The Globe and Mail, https://www.
theglobeandmail.com/life/health-and-fitness/the-human-genome- project-10-years-in-did-they-oversell-the-revolution/article625881/.
29. Toleos,A. (2019) Genomic sequencing in primary care: Promises unfulfilled, The Lown Institute, https://lowninstitute.org/news/blog/
genomic-sequencing-in-primary-care-promises-unfulfilled/.
30. Cook,C.E., Bergman,M.T., Finn,R.D., Cochrane,G., Birney,E. and Apweiler,R. (2016) The European Bioinformatics Institute in 2016:
data growth and integration.Nucleic Acids Res.,44, D20–D26.
31. Alf ¨oldi,J. and Lindblad-Toh,K. (2013) Comparative genomics as a tool to understand evolution and disease.Genome Res.,23, 1063–1068.
32. Bolker,J. (2012) Model organisms: there’s more to life than rats and flies.Nature,491, 31–33.
33. Horan,K., Jang,C., Bailey-Serres,J., Mittler,R., Shelton,C., Harper,J.F., Zhu,J.K., Cushman,J.C., Gollery,M. and Girke,T.
(2008) Annotating genes of known and unknown function by large-scale coexpression analysis.Plant Physiol.,147, 41–57.
34. Heller,K. (2009) Charting an unknown protein universe.PLoS Biol.,7, e1000206.
35. Jaroszewski,L., Li,Z., Krishna,S.S., Bakolitsa,C., Wooley,J., Deacon,A.M., Wilson,I.A. and Godzik,A. (2009) Exploration of uncharted regions of the protein universe.PLoS Biol.,7, e1000205.
36. Dunn,C.W., Leys,S.P. and Haddock,S.H.D. (2015) The hidden biology of sponges and ctenophores.Trends Ecol. Evol.,30, 282–291.
37. Johnson,R.N., O’Meally,D., Chen,Z., Etherington,G.J., Ho,S.Y.W., Nash,W.J., Grueber,C.E., Cheng,Y., Whittington,C.M., Dennison,S.
et al.(2018) Adaptation and conservation insights from the koala genome.Nat. Genet.,50, 1102–1111.
38. Werck-reichhart,D. and Feyereisen,R. (2000) Protein family review Cytochromes P450: a success story.Genome Biol.,1,
doi:10.1186/gb-2000-1-6-reviews3003.
Downloaded from https://academic.oup.com/nar/article/48/5/2209/5707201 by guest on 25 January 2021
39. Floudas,D., Binder,M., Riley,R., Barry,K., Blanchette,R.A., Henrissat,B., Mart´ınez,A.T., Otillar,R., Spatafora,J.W., Yadav,J.S.
et al.(2012) The paleozoic origin of enzymatic lignin decomposition reconstructed from 31 fungal genomes.Science,336, 1715–1719.
40. Stoeger,T., Gerlach,M., Morimoto,R.I. and Nunes Amaral,L.A.
(2018) Large-scale investigation of the reasons why potentially important genes are ignored.PLOS Biol.,16, e2006643.
41. Altenhoff,A.M., Glover,N.M., Train,C.M., Kaleb,K., Warwick Vesztrocy,A., Dylus,D., De Farias,T.M., Zile,K., Stevenson,C., Long,J.et al.(2018) The OMA orthology database in 2018:
Retrieving evolutionary relationships among all domains of life through richer web and programmatic interfaces.Nucleic Acids Res., 46, D477–D485.
42. Nagy,L.G., Ohm,R.A., Kov´acs,G.M., Floudas,D., Riley,R., G´acser,A., Sipiczki,M., Davis,J.M., Doty,S.L., de Hoog,G.S.et al.
(2014) Latent homology and convergent regulatory evolution underlies the repeated emergence of yeasts.Nat. Commun.,5, 4471.
43. Tam,V., Patel,N., Turcotte,M., Boss´e,Y., Par´e,G. and Meyre,D.
(2019) Benefits and limitations of genome-wide association studies.
Nat. Rev. Genet.,20, 467–484.
44. Visscher,P.M., Wray,N.R., Zhang,Q., Sklar,P., McCarthy,M.I., Brown,M.A. and Yang,J. (2017) 10 years of GWAS discovery:
biology, function, and translation.Am. J. Hum. Genet.,101, 5–22.
45. Sella,G. and Barton,N.H. (2019) Thinking about the evolution of complex traits in the era of genome-wide association studies.Annu.
Rev. Genomics Hum. Genet.,20, 461–493.
46. Collins,C. and Didelot,X. (2018) A phylogenetic method to perform genome-wide association studies in microbes that accounts for population structure and recombination.PLoS Comput. Biol.,14, e1005958.
47. Pease,J.B., Haak,D.C., Hahn,M.W. and Moyle,L.C. (2016) Phylogenomics reveals three sources of adaptive variation during a rapid radiation.PLoS Biol.,14, e1002379.
48. Pagel,M. (1999) Inferring the historical patterns of biological evolution.Nature,401, 877–884.
49. Barker,D. and Pagel,M. (2005) Predicting functional gene links from phylogenetic-statistical analyses of whole genomes.PLoS Comput.
Biol.,1, e3.
50. Barker,D., Meade,A. and Page,M. (2007) Constrained models of evolution lead to improved prediction of functional linkage from correlated gain and loss of genes.Bioinformatics,23, 14–20.
51. Pellegrini,M., Marcotte,E.M., Thompson,M.J., Eisenberg,D. and Yeates,T.O. (1999) Assigning protein functions by comparative genome analysis: protein phylogenetic profiles.Proc. Natl. Acad. Sci.
U.S.A.,96, 4285–4288.
52. Pellegrini,M. (2012) Using phylogenetic profiles to predict functional relationships.Methods Mol. Biol.,804, 167–177.
53. Dey,G. and Meyer,T. (2015) Phylogenetic profiling for probing the modular architecture of the human genome.Cell Syst.,1, P105–P115.
54. Dey,G., Jaimovich,A., Collins,S.R., Seki,A. and Meyer,T. (2015) Systematic discovery of human gene function and principles of modular organization through phylogenetic profiling.Cell Rep.,10, 993–1006.
55. Nagy,L.G., Riley,R., Bergmann,P.J., Krizs´an,K., Martin,F.M., Grigoriev I,V., Cullen,D. and Hibbett,D.S. (2017) Genetic bases of fungal white rot wood decay predicted by phylogenomic analysis of correlated gene-phenotype evolution.Mol. Biol. Evol.,34, 35–44.
56. Ruano-Rubio,V., Poch,O. and Thompson,J.D. (2009) Comparison of eukaryotic phylogenetic profiling approaches using species tree aware methods.BMC Bioinformatics,10, 383.
57. Innan,H. and Kondrashov,F. (2010) The evolution of gene duplications: classifying and distinguishing between models.Nat.
Rev. Genet.,11, 97–108.
58. Hurst,L.D., P´al,C. and Lercher,M.J. (2004) The evolutionary dynamics of eukaryotic gene order.Nat. Rev. Genet.,5, 299–310.
59. Snitkin,E.S., Gustafson,A.M., Mellor,J., Wu,J. and Delisi,C. (2006) Comparative assessment of performance and genome dependence among phylogenetic profiling methods.BMC Bioinformatics,7, 420.
60. Krause,D.J., Kominek,J., Opulente,D.A., Shen,X.X., Zhou,X., Langdon,Q.K., DeVirgilio,J., Hulfachor,A.B., Kurtzman,C.P., Rokas,A.et al.(2018) Functional and evolutionary characterization of a secondary metabolite gene cluster in budding yeasts.Proc. Natl.
Acad. Sci. U.S.A.,115, 11030–11035.
61. Ramazzina,I., Folli,C., Secchi,A., Berni,R. and Percudani,R. (2006) Completing the uric acid degradation pathway through phylogenetic comparison of whole genomes.Nat. Chem. Biol.,2, 144–148.
62. Rogozin,I.B., Wolf,Y.I., Babenko,V.N. and Koonin,E.V. (2007) .Dollo parsimony and the reconstruction of genome evolution. In:
Albert,VA (ed).Parsimony, Phylogeny, and Genomics. Oxford University Press, pp. 190–217.
63. Csur ¨os,M. (2010) Count: Evolutionary analysis of phylogenetic profiles with parsimony and likelihood.Bioinformatics,26, 1910–1912.
64. Szllosi,G.J., Tannier,E., Daubin,V. and Boussau,B. (2015) The inference of gene trees with species trees.Syst. Biol.,64, e42–e62.
65. Altenhoff,A.M., Glover,N.M. and Dessimoz,C. (2019) Inferring orthology and paralogy.Methods Mol Biol.,855, 259–279.
66. Gabald ´on,T. and Koonin,E.V. (2013) Functional and evolutionary implications of gene orthology.Nat. Rev. Genet.,14, 360–366.
67. Noutahi,E., Semeria,M., Lafond,M., Seguin,J., Boussau,B., Gu´eguen,L., El-Mabrouk,N. and Tannier,E. (2016) Efficient gene tree correction guided by genome evolution.PLoS One,11, e0159559.
68. Jiang,P. and Rausher,M. (2018) Two genetic changes in cis-regulatory elements caused evolution of petal spot position in Clarkia.Nat. Plants.,4, 14–22.
69. Revell,L.J. (2014) Ancestral character estimation under the threshold model from quantitative genetics.Evolution (N. Y.),68, 743–759.
70. Uyeda,J.C., Zenil-Ferguson,R. and Pennell,M.W. (2018) Rethinking phylogenetic comparative methods.Syst. Biol.,67, 1091–1109.
71. Cornwell,W. and Nakagawa,S. (2017) Phylogenetic comparative methods.Curr. Biol.,27, R333–R336.
72. Joy,J.B., Liang,R.H., McCloskey,R.M., Nguyen,T. and Poon,A.F.Y.
(2016) Ancestral Reconstruction.PLoS Comput. Biol.,12, e1004763.
73. Dunn,C.W., Luo,X. and Wu,Z. (2013) Phylogenetic analysis of gene expression.Integr. Comp. Biol.,53, 847–856.
74. Richter,D.J., Fozouni,P., Eisen,M.B. and King,N. (2018) Gene family innovation, conservation and loss on the animal stem lineage.
Elife,7, e34226.
75. DePamphilis,C.W., Palmer,J.D., Rounsley,S., Sankoff,D., Schuster,S.C., Ammiraju,J.S.S., Barbazuk,W.B., Chamala,S., Chanderbali,A.S., Determann,R.et al.(2013) The Amborella genome and the evolution of flowering plants.Science,342, 1241089.
76. Inoue,J. and Satoh,N. (2019) ORTHOSCOPE: an automatic web tool for phylogenetically inferring bilaterian orthogroups with user-selected taxa.Mol. Biol. Evol.,36, 621–631.
77. Emms,D.M. and Kelly,S. (2015) OrthoFinder: solving fundamental biases in whole genome comparisons dramatically improves orthogroup inference accuracy.Genome Biol.,16, 157.
78. Krizs´an,K., Alm´asi, ´E., Mer´enyi,Z., Sahu,N., Vir´agh,M., K ´osz ´o,T., Mondo,S., Kiss,B., B´alint,B., K ¨ues,U.et al.(2019) Transcriptomic atlas of mushroom development reveals conserved genes behind complex multicellularity in fungi.Proc. Natl. Acad. Sci. U.S.A.,116, 7409–7418.
79. Seb´e-Pedr ´os,A., Degnan,B.M. and Ruiz-Trillo,I. (2017) The origin of Metazoa: a unicellular perspective.Nat. Rev. Genet.,18, 498–512.
80. Wapinski,I., Pfeffer,A., Friedman,N. and Regev,A. (2007) Automatic genome-wide reconstruction of phylogenetic gene trees.
Bioinformatics,23, i549–i558.
81. Nagy,L.G., Riley,R., Tritt,A., Adam,C., Daum,C., Floudas,D., Sun,H., Yadav,J.S., Pangilinan,J., Larsson,K.H.et al.(2016) Comparative genomics of early-diverging mushroom-forming fungi provides insights into the origins of lignocellulose decay capabilities.
Mol. Biol. Evol.,33, 959–970.
82. Albalat,R. and Ca ˜nestro,C. (2016) Evolution by gene loss.Nat. Rev.
Genet.,17, 379–391.
83. Hiller,M., Schaar,B.T., Indjeian,V.B., Kingsley,D.M., Hagey,L.R.
and Bejerano,G. (2012) A ‘forward genomics’ approach links genotype to phenotype using independent phenotypic losses among related species.Cell Rep.,2, 817–823.
84. Partha,R., Kowalczyk,A., Clark,N.L. and Chikina,M. (2019) Robust method for detecting convergent shifts in evolutionary rates.
Mol. Biol. Evol.,36, 1817–1830.
85. Sharma,V., Hecker,N., Roscito,J.G., Foerster,L., Langer,B.E. and Hiller,M. (2018) A genomics approach reveals insights into the importance of gene losses for mammalian adaptations.Nat.
Commun.,10, 5707.
Downloaded from https://academic.oup.com/nar/article/48/5/2209/5707201 by guest on 25 January 2021