Measurement of a Computerized Machine Tool Controller
BMEVIVEM264
Szamel, László
Kohari, Zalán
Measurement of a Computerized Machine Tool Controller
írta Szamel, László és Kohari, Zalán Publication date 2012
Szerzői jog © 2011
Tartalom
1. Insulation diagnostics ... 1
1. Motivations for insulation diagnostics ... 1
2. Insulation resistance measurement of transformers ... 1
3. Partial discharge measurement ... 2
3.1. Definition, types ... 2
3.2. PD measurement techniques ... 3
3.3. Data processing ... 5
3.4. PD measurement on electrical rotating machines ... 6
4. Measurement tasks to perform ... 7
4.1. Insulating resistance ... 7
4.2. Partial discharge measurement ... 7
5. Test questions ... 8
6. References ... 8
7. Test log ... 9
7.1. Insulation resistance measurement ... 9
7.2. Partial discharges measurement ... 9
7.2.1. PD measurement in current transformer ... 9
7.2.2. PD measurement in case of needle-plane electrodes ... 9
7.2.3. PD measurement in case of plane insulator between different sized plane electrodes ... 10
2. Investigation of electrical switching devices ... 11
1. Knowledge base necessary for accomplishing the lab work: ... 11
2. Investigation of medium voltage vacuum circuit breaker ... 11
2.1. Tasks to be accomplished ... 12
2.2. The devices used for the measurement ... 12
2.3. Measurement and evaluation ... 13
3. Investigation of MCB overload behavior ... 14
3.1. Measurement and evaluation ... 14
3.2. The devices used for the measurement ... 15
3.3. Steps of measurement and evaluation ... 15
3.4. References and further readings ... 16
3. Measurement of Magnetic Field of Electric Machines ... 17
1. Object of measurement ... 17
2. Measurement tasks ... 17
3. Procedure of the measurement ... 18
4. Operation of the 600 kV test transformer ... 19
4.1. Conditions and procedure of the switch on of the equipment ... 20
4.2. Procedure of the switch off ... 21
5. Control questions ... 21
6. Template of measuring report ... 21
6.1. Measurement of Magnetic Field of Electric Machines ... 21
6.2. Indoor measurement perpendicular to the cable duct ... 22
6.3. Outdoor measurement close to the transformer, perpendicular to the cable duct ... 22
6.4. Outdoor measurement between the high voltage laboratory and the transformer, parallel to the cable duct ... 23
4. Investigation of windings of electric machines ... 24
1. Distribution of the overvoltage inside the winding of transformers ... 24
1.1. Initial voltage distribution inside the winding ... 24
1.2. Effect of steepness on the initial voltage distribution ... 26
2. Voltage distribution after a certain time ... 26
2.1. Effect of the steepness of the damping part of the wave on voltage Umax ... 28
3. Examination with chopped voltage wave ... 29
4. Experimental study of voltage distribution, deteminaton of oscillation diagram ... 31
4.1. Examination of stresses in a transformer of delta connection ... 33
4.2. Overvoltage transported between coils situated at the same column ... 33
4.3. High voltage tests ... 34
5. Task of measurement ... 35
5.1. Description of the measurement ... 36
5. Investigation of Salient pole Synchronous Machine ... 37
1. The object of measurement ... 37
2. Theoretical basics ... 37
2.1. Scope of synchronous machine ... 37
2.2. Operation of synchronous machine ... 37
2.3. Requirements for connecting to the mains ... 37
3. Statement of the task ... 37
3.1. Main equipment of the investigated arrangement ... 37
3.2. The process of measurement ... 38
3.3. Recording the no-load and the short-circuit diagrams ... 41
3.4. Connecting of synchronous machine to the mains (synchronizing) ... 42
3.5. Control of active and reactive power. Change of load-angle δ ... 42
3.6. Recording of current-vectordiagram ... 42
3.7. Recording of V-curves ... 43
3.8. Recording of P(δ) curves ... 44
4. Evaluation of measurement, protocol ... 45
5. Questions ... 45
6. Recommended literature ... 46
6. Frequency converter-fed field-oriented controlled induction motor drive ... 47
1. The keywords of the necessary knowledge: ... 47
2. Introduction ... 47
2.1. The components of the drive ... 47
2.2. The driven machine ... 48
2.3. The used instruments ... 48
2.4. Manipulation of the drive ... 48
2.5. The process of the switching on ... 48
2.6. Measuring tasks ... 49
2.6.1. Setting the parameters, using the graphical interface. ... 49
2.6.2. Investigating the characteristic Park-vector loci and time functions. ... 49
2.6.3. Investigating the input current time function. ... 49
2.6.4. Open-loop control of IM (without speed feedback) with slip comensation (scalar control). ... 49
2.6.5. Open loop vector control of IM (sensorless field-orinted control) ... 49
2.6.6. Closed loop vector control (filed-oriented control) of IM ... 49
7. Examination of switched reluctance motor drives ... 52
1. Purpose of this exercise ... 52
2. Theoretical basics ... 52
2.1. Design of SRM ... 52
2.2. Power supply of SRM drives ... 52
3. Details for the measurement ... 53
3.1. Main components of the drive ... 53
3.2. Power supply of the SRM drive ... 54
3.3. Drive startup ... 55
3.4. Operation of the drive ... 56
3.5. Using the Voltech 3-phase power analyzer (PA) for power measurements ... 56
4. Measurement exercises ... 56
4.1. Overview of the circuit, the operation of the SRM drive ... 56
4.2. Checking the current shapes under different load and at rotation speeds ... 56
4.3. Checking the current Park-vector ... 57
4.4. Calculating the drive efficiency ... 57
5. Questions ... 57
6. References ... 57
8. Measurement of a speed controlled DC servo drive ... 58
1. Scope of the measurement ... 58
2. Theoretical background of the measurement ... 58
2.1. Characteristics of PMDC servo drives ... 58
2.2. Features of the servo amplifier ... 59
2.3. Control of the servo drive ... 59
Measurement of a Computerized Machine Tool Controller
3. Introduction of the measurement ... 59
3.1. Main components of the drive being studied ... 59
3.2. Startup and handling of the drive ... 60
4. Measurement tasks ... 60
4.1. Measurement of the torque characteristics ... 60
4.2. Investigation of effects of current limitation ... 60
4.3. Investigation of current and speed curves with different speed reference signals .. 61
4.4. Measurement of the Bode diagram of the control loop ... 61
5. Test questions ... 61
6. Questions to think about ... 61
7. References ... 61
9. Computerized Machine Tool Controller ... 62
1. Scope of the measurement ... 62
2. Theoretical background of the measurement ... 62
2.1. Characteristics of PMDC servo drives ... 62
2.2. Features of the servo amplifier ... 63
2.3. Control of the servo drive ... 63
3. Introduction of the measurement ... 64
3.1. Main components of the drive being studied ... 64
3.2. Startup and handling of the drive ... 64
4. Measurment tasks ... 65
4.1. Become familiar to control tasks regarding the machining tool ... 65
4.2. Investigate the movements on an oscilloscope ... 65
4.3. Trajectory design ... 65
4.4. Trajectory programming ... 66
4.5. Trajectory following test ... 66
5. Test questions ... 66
6. Questions to think about ... 66
7. References ... 66
1. fejezet - Insulation diagnostics
1. Motivations for insulation diagnostics
The main reason for performing any diagnostics measurement is that the insulation meets its main goal during its operation, namely be able to electrically separate metallic parts on different potentials safely (e.g. transformer winding from the core). Insulation diagnostics is performed during design, manufacturing and application (Figure 1), based on this the reason for the measurements can be assorted as follows:
1. Type tests: the measurements performed before beginning mass production are meant to assess whether the insulation is able to perform as expected or there are weak spots that have to be changed,
2. quality control: these measurements are performed during mass production in order to point out specimens with manufacturing errors (e.g. conducting particles or voids in the insulation),
3. diagnostics and condition assessment: the goal is to assess the failure mechanisms and degradation present in the equipment in operation, and try to answer the question how long the insulation can stay in operation without unacceptable risk of breakdown.
Since the processes in the future are not known and the knowledge about stresses in the past is usually limited, no diagnostic method is able to answer when the insulation is going to suffer breakdown. Nevertheless, with well designed measurements it is possible to assess the time span on which the probability of breakdown is acceptably low.
Figure 1 Insulation resistance measurement on transformers
2. Insulation resistance measurement of transformers
Regarding electrical machines insulation resistance measurement is most important in case of transformers. In case of insulation diagnostic measurements the windings, the core and the vessel form a multi-electrode system.
Between these electrodes lie the insulations of the transformer. Regarding high voltage power transformers, these are in almost all cases oil-paper insulations.
The components of the insulation have strong influence on each other. The paper adsorbs some of the contamination causing conduction in the oil (ionic particles, ageing products and a part of paper), accordingly elevating the volume resistance of the oil. At the same time, products originating from the ageing of the paper dissolve in the oil, due to mechanical impacts (e.g. dynamic effect of inrush current) paper fiber makes its way to the oil. Water in the paper accelerates ageing badly: in case of 3% of water content the average length of molecules halve ten times faster than in case of 0,3%.
The value of the insulation resistance is the function of water content and ageing. The conductivity of the oil impregnated paper is given in terms of its specific (volume) resistivity. The increment of the water content by 1% decrements this value by one order. This is the basis of the application of resistivity measurement on power transformers as a diagnostic tool. Meanwhile it has to be considered that the results of insulation resistivity measurement are specific to that particular object, while volume resistivity is characteristic of the material. The latter cannot be measured in real-life conditions.
In practice insulation resistivity measurements and the calculated absorption coefficient are applied for the condition assessment of transformers. Other methods of transformer diagnostics based on the measurement of dielectric properties are high time constant polarization spectrum measurement by means of recovery voltage measurement and loss tangent and capacity measurement. To perform dielectric measurements on a transformer it has to be taken out of service and the conductors connecting to the measured winding have to be dismounted.
In practice insulation resistivity measurements and the calculated absorption coefficient are applied for the condition assessment of transformers. Other methods of transformer diagnostics based on the measurement of dielectric properties are high time constant polarization spectrum measurement by means of recovery voltage measurement and loss tangent and capacity measurement. To perform dielectric measurements on a transformer it has to be taken out of service and the conductors connecting to the measured winding have to be dismounted.
The above mentioned properties are all dependent on temperature. The temperature of the transformer, due to its size, cannot be treated as homogeneous. At the same time during measurements we have to settle for the indication of the temperature gauge of the transformer of the temperature calculated from the DC resistivity measurements of the winding. The latter gives more accurate results, since we measure the dielectrics separating the core from the windings themselves.
Insulation resistivity measurement is carried out as current measurement in case of DC voltage excitation. After switching of the voltage source the current decays near exponentially and it becomes constant just after a shorter or longer time, meaning that the voltage/current ratio – the insulation resistance – is increasing accordingly. This can be easily understood if we consider the general equivalent circuit of insulating materials (Figure 2). When we switch on the DC supply, the current will have different components. The fastest decaying is the component charging C geo, the geometric or vacuum capacitance. This component is also present when there is no insulating material between the electrodes. Its name comes from the fact that it symbolizes the capacitance which is given from the electrode configuration. Due to electric field, polarization effects start to develop in the material, which process needs time. The R i C i elements represent the magnitude and through the time constant of the RC element the velocity of development. The stationary current we would like to measure is coming from R 0.
Considering the time constants of the polarization effects and the restrictions of field measurements, the R o
insulation resistance is defined as the resistivity value measured after 60 seconds of switching on the power supply. The insulation resistivity should be measured on every voltage level and phase. Commercially available devices usually operate with 1 kV, 2.5 kV or 5 kV of maximum voltage. As mentioned before, R o is temperature dependent. Accordingly, the measured value has to be corrected with a method given in the concerning standard to a reference temperature.
As the condition of the transformer insulation is represented not only in the insulation resistance but also in the polarization effects, the so called absorption coefficient (K A) was introduced to represent both of them. It is calculated as the ratio of the value measured at 60 and 15 seconds (K A =R o 60/R o15). The value of K A is decreasing with the aging of the insulation. Another advantage of using the absorption coefficient is that it characterizes the effects in the insulating material, and with calculation of the ratio the effects of the electrode configuration is eliminated, so that results from different transformer constructions can be compared.
Figure 2 Partial discharge measurement
3. Partial discharge measurement
3.1. Definition, types
If we place insulating material between electrodes and we start to elevate the electric field, we get very low current until we stay below the electrical strength of the material. Exceeding the electrical strength the material cannot resist further to the electrical field and breakdown occurs. Partial discharges occur when the insulation breaks down partially, but the discharge does not bridge the electrodes. Basically 3+1 types of partial discharges
Insulation diagnostics
(PD) can be distinguished: internal or void discharge, surface discharge, corona discharge plus treeing, which means the presence of PD and is a process very close to breakdown (Figure 3…Figure 6).
Figure 3
Figure 4
Figure 5
Figure 6
The application of PD measurement as a diagnostic tool has several reasons. The high temperature of discharges, even when they are just partial, degrades the organic insulation materials. Compared to the other ageing processes, they lead the fastest to breakdown, accordingly we can expect this measurement to predict breakdown. PD can be also an indicator of failure mechanisms, even if they do not cause degradation themselves. Their appearance can indicate e.g. the delamination of the layers of a multi-layer insulation.
3.2. PD measurement techniques
Partial discharges do not mean the bridging of the electrodes and transferring charge from one electrode to other, but in the small space where the PD occurs, ionization processes are initiated and due to the electric field the ions and electrons start to move, charge separation is evolving. Due to their small weight, electrons can accelerate to almost the speed of light. On the electrodes the charge separation appears as a small amount of charge and accordingly a small current impulse. At the location of the PD the current impulse has a very short duration in orders of nanoseconds. During its propagation – either in cables or in winding systems – the current
impulse is suffering dispersion and during propagation the high frequency components are attenuated heavily, and accordingly the rising time is getting longer.
Figure 7
The real amount charge flowing in the discharge itself is not measureable at the electrodes. This can be understood considering the capacitive equivalent circuit of partial discharges (Figure 7). In the circuit the C v
capacitance represents the capacitance of the void itself, C s represents the dielectric “in series” with this, while C p represents the capacitance of all the other dielectric (e.g. the capacitance of the cable section). Prior to the PD the C v capacitance of the void is charged to a voltage V b. In the moment of the PD, this voltage collapses to a voltage V r called remaining voltage. The voltage change occurring on the C p capacitance is approximately dependent on the C s /C p ratio, the so called apparent charge measurable at the electrodes is approximately proportional to C s.
The conventional measurement technique (Figure 8) is based on the measurement of the apparent charge. As a first approach, the level of degradation of the insulation can be considered as to be proportional to the apparent charge. Accordingly the measurement is carried out with an integrating circuit, which higher cutoff frequency is usually not higher than 1 MHz, common values are between 200 and 800 kHz. As the C s capacitance is different for each specimen, the measuring system has to be calibrated. This is performed by the injection of a known charge impulse into the specimen through the calibrating capacitor (C s). The function of the elements of the circuit:
1. The HV transformer feeds the circuit with the necessary high AC voltage,
Figure 8
1. the role of the choke coil, as a high impedance at high frequencies, is to be a barrier for the high frequency PD impulses, so that they flow through the measuring impedance; at the same time, it filters noise coming from the transformer,
2. the impulse generator together with the C s capacitor form the direct calibrating circuit,
3. the Cc coupling capacitor is high impedance for the power frequency test voltage, accordingly keeps high voltage away from the measuring impedance; for the high frequency PD impulses it is small impedance, so that it does not limit their propagation towards the measuring impedance
4. the role of the measuring or detection impedance is to convert current impulses into measurable voltage pulses; it is designed to give a voltage impulse whose height is proportional to the apparent charge,
5. the oscilloscope or any other data acquisition device is meant to register and evaluate the measurements.
The conventional measurement technique is still the most widely used technique thanks to the experience with it. Nevertheless, expectations towards diagnostic systems initiate further development. Online measurements
Insulation diagnostics
carried out without taking the device out of service are much more complicated to perform. To achieve the necessary signal to noise ratio the bandwidth of the measurement system has to be broadened. With this purpose high frequency current transformers (HFCTs) and voltage dividing capacitors are also applied. The HFCTs are generally Rogowski-coils or ferrite-core current transformers. With these the higher cutoff frequency of the bandwidth can be as high as 30 MHz. In research laboratories experiments with extremely high, 2 GHz bandwidth are carried out.
The PD impulses have components in the high frequency regimes, the sudden flow of charges initiate electromagnetic waves. Recently, RF and UHF antennae are also used for the detection of discharges.
It is also possible to measure PD with non-electrical methods. PD induce sudden temperature rise, which also initiates an acoustic wave. With acoustic detectors, commonly in the ultrasound frequency range, these can be easily detected. Undoubted advantage of this kind of measurement is that it is inherently able to locate discharge sources. Nevertheless, their low sensitivity is an issue to keep always in mind. There are commercially available systems for continuous online monitoring of power transformers. These consist of more, usually piezoelectric sensors, with that they are able to pinpoint exactly the failure spots.
During the discharges the electrons get to an excited state. While the fall back to their original position, they emit their energy as photons, most of them in the UV light range. In case of transparent insulating media PD can be detected optically.
3.3. Data processing
The reasons for post-measurement data processing are:
1. achieve as effective noise filtering as possible,
2. automatically distinguish between different types of discharges sources and separation from noise, 3. location the failure.
The noise filtering is necessary because the PD impulses are minute signals, usually in orders of picocoulombs.
These have to be measured in a noisy industrial or substation environment. Furthermore the external noise or the switching impulses of power electronics can be very similar to the PD signals. If we are not prepared for that, the measurement can give a false positive result, which means that we qualify a device in good condition as faulty. Needless to say what the reactions of the leader of the substation or power plant would be due to the money spent on the “reparation” of a device in good condition.
Fortunately there are techniques that help us to prevent these mistakes to happen. At the beginnings of PD measurements digital techniques were not yet available, so the measurements had to be carried out in the presence of an expert, who, with many years of experience, from the flashing signals appearing on the oscilloscope screen was able to distinguish between noise and several discharge sources. They discovered that different phenomena have different behavior in function of the phase angle of the test voltage. This is of big importance, because the different phenomena represent different levels of danger to the insulation. Research during the last two decades all had the goal to translate the knowledge of the experts to a sophisticated automated system. Below a list of these techniques can be found. Their detailed explanation is beyond the scope of this syllabus.
1. pulse phase analysis, PPA
It is based on the fact that the distribution of discharges along the test voltage is different for noise and for the different phenomena:
1. noise has no correlation with test voltage phase, while disturbances (e.g. phase controlled power electronics) have perfect correlation,
2. corona discharges appear symmetrically to the peak of the voltage, 3. surface discharges occur after the zero crossing,
4. internal discharges appear before the zero crossing and they do not appear after the peak.
This technique was supplemented with several further methods:
1. statistical analysis: it describes the distribution of discharges quantitatively with in terms of statistical expressions and their relation to the normal distribution (mean value, skew, kurtosis etc.); gives good results if only one type of discharge source is present, but it is not able to separate different phenomena,
2. neural networks: tries to simulate human recognition; needs large amount of teaching information and has quite high computation resource demands,
3. fuzzy logic: partial discharges are dependent in a complex way on many, sometimes not known phenomena;
exactly this kind of phenomena is called “fuzzy” in English, accordingly fuzzy logic is inherently able to process PD signals; it can handle problems whose relations are not known or vague; for proper operation it needs large number of rules, that are usually unknown for real insulations,
4. wavelet transform: the goal of its application is noise reduction; it lies between time and frequency domain analysis; after decomposing a signal into different “wavelets”, it is able to distinguish between noise and PD impulses,
5. fractal analysis: as fractals are able to describe the shape of objects, they are able to describe the three- dimensional patterns of the PPA.
1. Pulse magnitude analysis, PMA
During the measurement the magnitude of discharges is recorded and a histogram is calculated. The Weibull- distribution if fit to the resulting density. According to recent research the scale and shape parameter of the Weibull-distribution are characteristic to the PD type. In case of more PD sources, the five parameter distribution is used, where the distribution is the sum of two two-parameter distribution and the fifth coefficient describes the weight of each phenomenon in the resulting distribution.
1. Time-frequency mapping
It is a newly developed technique. PD signals are measured with very high bandwidth. The impulses are treated separately, and not their integrated charge but their length and characteristic frequency content are measured.
Then the discharges are mapped on a two dimensional diagram in function of the length and frequency.
Different phenomena has different location on the map and the borders of the groups are determined by means of fuzzy-c clustering.
3.4. PD measurement on electrical rotating machines
In case of rotating machines the assessment of the type and danger of the discharges is essential, as their insulation over 3 kV cannot be designed to be PD free (in other devices, e.g. cables, their presence is practically unacceptable). In most cases, PD is not dangerous, because many parts are made of PD resistant materials like mica. Accordingly, the measurement system has to indicate failure if the magnitude of the discharges is too high. The only question to answer is the meaning of “too high”… Based on the experience, which in case of rotating machines includes already 20 years of online measurements, critical levels can be determined.
The online monitoring of PD – their continuous measurement – is the most widely used in the insulation diagnostics of stators. In North-America almost 50% of the power plant generators are equipped with this kind of devices and are used to plan maintenance. PD is usually indicator (but not a root cause) of the following failures:
1. overheating, 2. cyclic load,
3. contamination with partly conducting particles, 4. loose winding in the stator slots,
5. different manufacturing problems, like improper impregnation, improper separation of high voltage parts.
Insulation diagnostics
In most cases 80 pF (almost standardized) coupling capacitors are used, measuring devices have high bandwidth to achieve good signal-to-noise ratio.
4. Measurement tasks to perform
4.1. Insulating resistance
Insulating resistance measurement is carried out at the High Voltage Laboratory of the Electric Power Engineering Department. The specimen is an inductive, oil-paper insulated voltage transformer. The type of the measuring device is Metrel TeraOhm 5 kV.
As first step the green “Guard” output has to be connected to earth. Then the device can be connected to the 230 V power source. After switching on, wait until the self calibration finishes. Then the measurement cables can also be connected to the proper output.
As a voltage transformer is measured, the voltage should be chosen relatively low, to 250 V. The length of the measurement should be 60 seconds, the value recorded during the measurement should be the resistance value at 15 seconds.
The task is to determine the insulating resistance and the absorption coefficient between the high and low voltage winding of the transformer, between the high voltage winding and the core, and between the low voltage winding and the core. For measuring between the core and windings, the earthing has to be removed from the transformer.
4.2. Partial discharge measurement
Measurements are carried out in the designated room of the High Voltage Laboratory.
Figure 9
Figure 9 shows the measurement arrangement. The system consisting of the detection impedance and the measuring device has a bandwidth of 40 kHz – 200 kHz, consequently this is a conventional measuring device.
During the laboratory practice, the following specimens will be measured:
1. high voltage current transformer, 2. plane-needle electrodes,
3. insulating plane between plane electrodes of different size.
During the measurement simpler, directly measurable quantities will be used as mentioned in the syllabus.
1. On the above specimens, the inception and extinction voltage of the PD have to be determined (the voltage where the magnitude of PD overpasses a limit), and from that the hysteresis will be observed.
2. Measure the PD magnitude in function of test voltage.
3. The PD patterns on the oscilloscope will be analyzed and the distribution in function of the test voltage phase will be described.
5. Test questions
1. The knowledge of all the laboratory safety regulations is the prerequisite of beginning the measurements.
2. Draw the reliability-time diagram of the equipments with and without diagnostics. Denominate the reason of failures on the different sections and describe the possible actions.
3. On what factors is the value of insulation resistance dependent?
4. What is the main difference between the volume resistivity and insulation resistivity?
5. Draw the general equivalent circuit of the insulating materials and denominate the role of each component.
6. What is absorption coefficient and what are the advantages of its application?
7. Enumerate the types of partial discharges.
8. Why is PD measurement a valuable measurement technique?
9. Draw the arrangement of the conventional PD measurement and shortly describe the role of its elements.
10. What types of non-electrical PD measurement techniques exist?
11. What are the goals of data processing techniques?
12. What poses a big problem to PD diagnosis of rotating machines?
13. What types of failures can be detected on rotating machines with PD measurement?
6. References
1. Luspay Ödön. Közép- és Nagyfeszültségű Hálózati Berendezések Diagnosztikai Vizsgálata. s.l. : Magyar Áramszolgáltatók Egyesülete, 2000.
2. Dr. Horváth Tibor, László Tamás, dr. Máthé Balázs, dr. Németh Endre. Villamos szigetelések vizsgálata.
Budapest : Műszaki Könyvkiadó, 1979.
3. dr. Németh Endre, Dr. Horváth Tibor. Nagyfeszültségű szigeteléstechnika. Budapest : Tankönyvkiadó, 1990.
4. Partial Discharge Diagnostics and Electrical Equipment Insulation Condition Assessment. Stone, Greg C.
5, October 2005, IEEE Transactions on Dielectrics and Electrical Insulation, Vol. 12.
5. Evolution of Slot Partial Discharges under Electrical, Thermal and Mechanical Stresses. M. Lévesque, C.
Hudon, M. Bélec, E. David. Vancuver, Canada : s.n., 2008. IEEE International Symposium on Electrical Insulation.
6. Identification of Defects Generating PD in AC Rotating Machines by Means of Fuzzy-Tools. A. Contin, A.Tessarolo. Vancuver, Canada : s.n., 2008. IEEE International Symposium on Electrical Insulation.
7. Stator Insulation Problems Associated with Low Voltage and Medium Voltage PWM Drives. G.C. Stone, I.
M. Culbert, B.A. Lloyd. 2007. IEEE Cement Industry Technical Conference.
Insulation diagnostics
7. Test log
7.1. Insulation resistance measurement
Time of measurement:
Place:
Name of students + NEPTUN CODE:
Between HV and LV winding Between HV winding and core Between LV winding and core R 15
R 60
K A
7.2. Partial discharges measurement
The measurements are carried out with elevation of the voltage from inception voltage to 7 kV and the apparent charge and the voltage is recorded in four points lying between them. Afterwards the voltage is gradually decremented and values are recorded in four points until the extinction of the discharges. The magnitude for the inception and extinction voltage (qmin) has to be determined according to the noise level, values between 1…50 pC can be chosen, common values are between 5…10 pC.
7.2.1. PD measurement in current transformer
Apparent charges: qmin = …..
Inception voltage: Uinc = …..
Extinction voltage: Uext = …..
U [kV] Uinc
7kV
Ue xt
q [pC]
Description of phase resolved PD diagram. Which type of PD occurred?
7.2.2. PD measurement in case of needle-plane electrodes
Apparent charges: qmin = …..
Inception voltage: Uinc = …..
Extinction voltage: Uext = …..
U [kV] Uinc
7kV
Ue
xt
q [pC]
Description of phase resolved PD diagram. Which type of PD occurred?
7.2.3. PD measurement in case of plane insulator between different sized plane electrodes
Apparent charges: qmin = …..
Inception voltage: Uinc = …..
Extinction voltage: Uext = …..
U [kV] Uinc
7kV
Ue xt
q [pC]
Description of phase resolved PD diagram. Which type of PD occurred?
2. fejezet - Investigation of electrical switching devices
1. Knowledge base necessary for accomplishing the lab work:
1. Overcurrent, overload current, fault current, short-circuit current;
2. Structure and operation of low and medium voltage circuit breakers;
3. Operation of vacuum circuit breakers;
4. Relays, releases, current transformers;
5. Protection characteristics;
6. Coordination of protecting devices;
7. Role of contactors, their operation.
2. Investigation of medium voltage vacuum circuit breaker
Nowadays, the users are not confined to only one pre-set overload characteristic curve with state-of-the-art protecting devices. The user can set the operation of these units within specified limits. This makes possible to adjust the protection to the needs of a protecting system, and to accomplish current and/or time discrimination with other protecting devices. Circuit breakers in medium voltage systems do not include built-in protection.
However, flexibility is essential in power distribution, especially if such overload can occur in the system, which could not be predicted during the design process. In this case, it is enough to fine-tune the protection characteristics.
The SIPROTEC–4 type protection unit is a numerical protection relay that also performs control and monitoring functions and therefore supports the user in cost-effective power system management, and ensures reliable supply of electric power to the customers. The integrated control function permits control of disconnect devices (electrically operated/ motorized switches) or circuit-breakers via the integrated operator panel. The present status (or position) of the primary equipment can be displayed. 7SJ63 supports substations with single and duplicate busbars. The number of elements that can be controlled (usually 1 to 5) is only restricted by the number of inputs and outputs available. As an example, Fig. 1 shows the connection diagram of circuit breaker control function.
Fig. 1. Typical wiring for motor direct control; Q0 circuit breaker, Y circuit breaker coils, R relay, In digital input
2.1. Tasks to be accomplished
The connection diagram for the measurement can be seen in Fig. 2.
Fig. 2. Connection diagram for the investigation of a medium voltage vacuum circuit breaker
2.2. The devices used for the measurement
1. M1: SIEMENS 3AE1103-1 12 kV vacuum circuit breaker,
2. VR: SIEMENS SIPROTEC 7SJ63 programmable, multifunction protection relay, 3. CTr: SIEMENS 4MC6353-BX current transformer, 400:1,
Investigation of electrical switching devices
4. T1: toroid transformer; 1 KVA, 220/0-240 V, 5. T2: 230/24 V separating transformer, 6. T3: 230/230 V separating transformer, 7. A1: ammeter; 5…100 A;
8. SK: EAW type 230V, synchronous clock,
9. K1: switch for disabling/enabling protective function.
2.3. Measurement and evaluation
Steps of measurement:
Protection can be disabled by turning switch K1 into STOP position. This has been accomplished by the programming of the protective relay (see R11, R12, and R13 in Fig. 3). The output R12 provides a close command to the CB. This can be controlled from through the user interface of the control panel. Output R11 opens the CB contacts, and output R13 is reserved for the protecting operation. If the protection is enabled, then R11 is blocked by the program in the control panel. By closing switch K1, the outputs R11 and R13 will be connected parallel, and any of the output contacts, including the output programmed for protection, can trigger the CB. By opening K1, output R13 will be detached, therefore the protection cannot give an open command to the circuit breaker.
After disabling the protection, and closing the vacuum circuit breaker, the current can be set by the toroid transformer. The value of the current can be read from the ammeter or from the display of the control panel.
Note: A rated CB current of 200 A is programmed in the protection relay. After setting the current, the CB should be opened. This makes possible to enable the protection by turning switch K1 into START position.
When the synchronous clock is reset to zero, the CB can be closed from the control panel. The current starts to flow in the circuit until the protection interrupts it. The synchronous clock indicates the time elapsed before the CB opened.
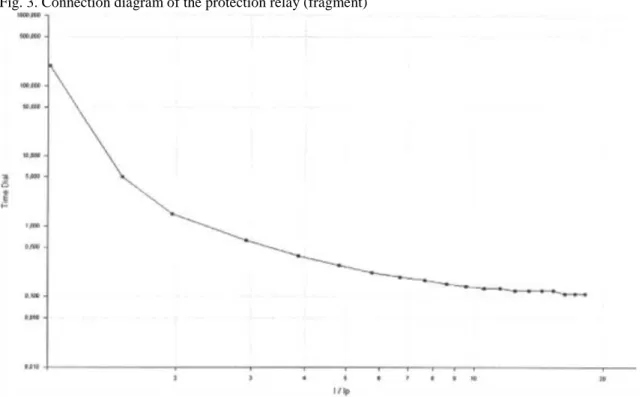
The programmed overload time-current characteristic curve is plotted in Fig. 4.
Fig. 3. Connection diagram of the protection relay (fragment)
Fig. 4. Programmed time-current characteristic curve
3. Investigation of MCB overload behavior
Fig. 5. Current limiting circuit breaker: 1-contact; 2-electromagnetic fast tripping release; 3-slide bar; 4-arc guide electrode; 5-arch chute cover; 6-balancing conductor; 7-arc chute; 8-deion plates; 9-bimetallic overload release; 10-fixing plate; 11-thermo-element
3.1. Measurement and evaluation
1. Measurement of the bimetallic overload relay‟s time-current characteristic, and comparison of this with the standard characteristics.
Figure 6 shows the connection diagram of the measurement.
Investigation of electrical switching devices
Fig. 6. Connection diagram for the investigation of MCB overload characteristics
3.2. The devices used for the measurement
1. VP: panel; 0,96 kVA, 380/24 V,
2. T1: toroid transformer; 1 KVA, 220/0-240 V, 3. F: coreless choke coil; 50 Hz, max 2.25 A, 4. A1: ammeter; 5…100 A,
5. M1: MCB, 6. Oscilloscope,
7. BE1: Setting resistance.
3.3. Steps of measurement and evaluation
It is important that the bimetallic strip must cool back to the ambient temperature before each measurement.
This can be ensured by waiting 4-5 minutes between two measurements. The smallest disconnection current of the fast tripping release and the characteristics of the overload relay have to be measured according to the circuit in Fig. 6. By slowly raising the supply voltage with the toroid transformer (T1), the smallest disconnecting current (Ir) of the fast tripping release can be found. During this test, the bimetallic strip can heat up, therefore it must be cooled back to ambient temperature before the next test. The characteristic curve of the overload release can be recorded with currents less than Ir. It is advised to start the measurement with higher currents, in order to wait less for the cooling. Smaller the current, less the tripping time and more the necessary time for cooling.
The test current can be set with the help of the setting resistance (RSet), during the cooling periods. The standard MCB characteristics can be seen in Fig. 7, whereas Fig. 8 shows the characteristic curve with given tolerance. The measured characteristic curve has to be compared graphically with these curves.
Fig. 7. Time-current characteristic curves of MCBs
Fig. 8. Standard characteristic curves of MCBs
3.4. References and further readings
[1]
Koller L., Novák B, Electrical switching devices and insulators, TÁMOP, 2011.
[2]
Koller L., Kisfeszültségű kapcsolókészülékek, Műegyetemi kiadó, 2005.
[3]
Koller L., Kisfeszültségű kapcsolókészülékek szerkezete és üzeme, Műegyetemi kiadó, 2005.
[4]
Koller L., Nagyfeszültségű kapcsolókészülékek, Műegyetemi kiadó, 2005.
3. fejezet - Measurement of Magnetic Field of Electric Machines
1. Object of measurement
Unwanted effects occur very often relating to the usage of electric energy. These unwanted effects are the consequences of different physical phenomena, mainly regarding to the fields in the neighborhood of transmission lines, substations, transformers and switchgears. The effect of the fields are twofold: in one hand they have influence on the biological processes, on the other hand they have influence on other electric and electronic equipment and systems. In order to avoid the unwanted effects, the tolerable limit values are specified by recommendations, directives or standards.
The biological limit values are specified in the EU (and in Hungary too) in mandatory directives according to the recommendations created by WHO (World Health Organization). These limits are specified by the 63/2004.
(VII. 26.) ESzCsM directive in Hungary. The limitation of exposure of the general public to electric and magnetic fields at 50 Hz frequency are the following:
1. electric field: 5000 V/m 2. magnetic induction: 100 μT
The typical values of the magnetic induction close to certain household appliances can be seen in the following table:
Appliance Magnetic induction
[μT]
Cooker 500…1000
Iron 10…100
Hair drier 1000…2500
Vacuum cleaner 10…1000
Table lamp 500…1000
Tv receiver 100…500
Washing-machine 10…100
Electric razor 500…1000
Drilling machine 100…500
2. Measurement tasks
The task is the measurement of the magnetic induction generated by the 600 kV test transformer in the High Voltage Laboratory.
2.1. Indoor measurement perpendicular to the cable duct
2.2. Outdoor measurement close to the transformer, perpendicular to the cable duct
2.3. Outdoor measurement between the high voltage laboratory and the transformer, parallel to the cable duct
3. Procedure of the measurement
The measurement has to be carried out by the EMDEX II instrument. The EMDEX II, shown in the Figure below, is a programmable data acquisition meter designed primarily to measure magnetic field intensity. It consists of an 8-bit computer with an ultraviolet erasable programmable read-only-memory (EPROM) operating program, 156 kbytes of CMOS RAM (for data storage), a signal processing board, and magnetic field sensors.
The EMDEX II is able to measure the magnetic induction in the range of 0.1 mG to 3.0 Gauss
Fig.1: The EMDEX II field meter
The recommended setting of the instrument is the following:
1. measurement rate: 3 s;
2. frequency bandwidth: broadband (40-800 Hz).
The measurement has to be carried out in the HVL. An electric arc shall be created by the 600 kV test transformer. The length of the arc is about 0,5 m, and its time duration is about 1 minute in order to avoid the overheating of the transformer. The magnetic field generated by the cables in the cable duct should be measured during the presence of the arc. Care should be taken to the appropriate movement of the instrument in order to collect the most optimal number of measuring points. The distances between the measuring points should be uniform as far is possible. The available measuring time interval is about 1 minute. This allows to collect about 20 measured data. The cable duct is considered as reference, and the measurement has to be carried out in a zone perpendicular to the cable duct which has the width of 6 m (from -3 m to +3 m). If the sampling rate is 3 s, this corresponds about one measuring point in each 30 cm. The measurement is repeated parallel to the cable duct in a length of 6 m. Between two measurements under load condition (existing arc) the measurement should be repeated under no load condition in order to compare the results. One measurement should be done parallel and two measurements should be done perpendicular to the cable duct at two different locations.
The Linear Data Acquisition (LINDA) Measurement Wheel should be used with the EMDEX II. The LINDA enables the EMDEX II to make magnetic field and location measurements simultaneously. In order for the EMDEX II to be used with the LINDA wheel, the meter must be loaded with the LINDA Operating Program.
The data is transferred from the EMDEX II into a LINDA dataset, which can be analyzed and plotted using EMCALC 2000.
Measurement of Magnetic Field of Electric Machines
Fig.2: The Linear Data Acquisition (LINDA) Measurement Wheel
The EMDEX II is able to fix and store different measuring results in order to avoid the download of the data after each measurement. The results of the next measurement should be stored as a new “EVENT”. The stored data can be analyzed after the measurements with the EMCALC 2000 software. Having a length component, the EMCALC 2000 is able to plot the results versus the distance.
After starting the EMCALC 2000 software, the EMDEX II meter should be connected to the PC via an USB cable and the stored measuring results can be downloaded into the program. The software indicates the number of events and the samples of each event. Starting the evaluation, the software calculates and shows the followings:
1. minimum value: is the smallest value occurring in the set of measurements;
2. maximum value: is the largest value occurring in the set of measurements;
3. mean value: is the average value of a set of measurements;
4. median value of a set of measurements: is the measurement value above which half of the measurements lie;
5. the measuring points in the function of the distance;
6. diagram of the measured values in the function of the distance;
7. diagram of the measured values in the function of the time;
8. histogram: shows the number of given values from the resulting values;
9. table containing the measured data in percentage of the distance;
10. 3D chart of the measured data if the moving direction was changed during the measurement.
4. Operation of the 600 kV test transformer
The 600 kV test transformer, the outdoor transformers and the 10 kV and 6 kV switchgears of the High Voltage Laboratory (later as HVL) are supplied from the ELMŰ 10 kV transformer station in the cellar of the “A”
building. The 10 kV switchgear of the HVL consists of two cells. The “Input” cell (No.1) contains the 1T 10 kV circuit breaker with spring mechanism and two 50/5 A, two-core 10 kV typ. AM-10 current transducers. The cell No.2 supplies the outdoor transformers at 10 kV voltage level through the 1S disconnector. This cell contains three one-core voltage transducers (typ. FM 10) with 10 000/√3/100/√3 V voltage ratio. The outdoor transformers are supplied through cables with plastic insulation. The outdoor cable is connected to the “H”
network transformer through the “3S” 3-pole disconnector. The ratio of the transformer is 10/6 kV. The transformer is equipped with a gas relay. The 6 kV secondary voltage of the network transformer is connected to
the “E” matching and the “SZ” control transformer. The transformers are interconnected with aluminium busbars. The regulator of the control transformer can be set stepless, and it is equipped with down and upper end-switches. Both transformers have thermal and gas protection. The 6 kV controlled voltage is connected to the cell No. 1. This cell contains the following devices:
1. 6 kV vacuum circuit breaker (“2T”);
2. current transducer with 40/5 A ratio in one phase;
3. voltage transducer with 6000/100 V ratio between two phases;
4. disconnector (“2S”) for disconnection of the cable to the “P” transformer;
5. earthing disconnector („1FS”) for earthing of the cable to the “P” transformer, interlocked with the 2S disconnector.
The switchgear can be operated from the reconstructed control stand. The disconnectors can be operated by acknowledging switches (typ. BM2), the circuit breakers can be operated by operating-acknowledging switches (typ. SM2). The “SZ” control transformer can be set from this control stand too. The control stand contains the necessary electromechanical, electronic and digital protections and their fault display unit. The switchgear is equipped with the following protections:
1. two-step digital overcurrent protection at 10 kV produced by Protecta (typ. DTI2 EP);
2. electronic impedance protection produced by VEIKI-ERŐKAR (typ. D-Z);
3. electronic undervoltage relay produced by Protecta (typ. Eu);
4. time relays produced by BBC;
5. auxiliary relays (types: RUS, Finder, Schrack) for tripping, on/off operations, interlocks and indication;
6. MCB-s produced by BBC.
The wiring is made of MKH 1 kV Cu cables routing in plastic cable ducts and their ends are equipped with ferrules. The outdoor H, E and SZ transformers were reconstructed by Ganz Transelektro Rt.
4.1. Conditions and procedure of the switch on of the equipment
1. Before the switch on: visual inspection of the condition of the outdoor transformers and the test transformer (technical condition, condition of the insulators, busbars, oil leakage, connections etc.);
2. Visual inspection of the condition of the secondary supply system and the fault indicators and check the presence of the supply voltages;
3. Check the presence of the voltage at the head of the input 10 kV cable by a voltage indicator;
4. Check the ON position of the 1S, 3S, 2S, 4S or 5S (300 kV or 600 kV connection of the P transformer) disconnectors;
5. ATTENTION: The 4S and the 5S disconnectors are not interlocked! ON position of both disconnectors simultaneously is FORBIDDEN!
6. Check the position of the inhibit switch on the door of the 10 kV switchgear cell No.1 (the operation of the switchgears can be inhibited from here during service, maintenance, inspection etc.);
7. The control stand can be switched on by turning the key switch and pushing the ON switch. This will be indicated by the control lamp;
8. Check the down-end position of the control transformer, otherwise the switch on of the circuit breakers are not allowed.
Measurement of Magnetic Field of Electric Machines
9. Check the indications of the Retesz 1, Retesz 2, Retesz 3 interlock lamps; all three lamps should be on, otherwise the switching on of the circuit breakers are not allowed. The meaning of the indications:
10. One red and one green signal lamps are situated above the door at the right side of the control stand.
When the switchgear is switched off, the green lamp is on, the door can be used. When the 10 kV circuit breaker is switched on, the red lamp is on, the door must not be used. If any door is opened in this situation, the 10 kV circuit breaker will be switched off automatically, and a fault indication will occur.
11. If the above conditions are fulfilled, the H, E and SZ transformers can be switched on by the operation of the 1T 10 kV circuit breaker. The presence of the 10 kV can be checked by the voltmeter on the control stand.
12. If any abnormal event cannot be experienced, the P test transformer can be switched on by the operation of the 2T 6 kV circuit breaker. After switching on of the circuit breaker, the presence of the 6 kV voltage, the 6 kV operating current and the operating current of the P test transformer can be checked respectively by the 6 kV line-to line voltmeter, the ammeter supplied from the 40/5 A current transducer and the ammeter measuring the current of the 5/5 A current transducer of the P test transformer.
13. Now the output voltage of the P test transformer can be increased by the operation of the UP switch of the SZ transformer. The upper end position of the control transformer is indicated by a lamp on the control stand. During the operation of the control transformer an indicator lamp named ‟Szabályzó jár‟ (i.e.
„controller operates‟) is on.
14. In a case of any abnormality, fault or accident danger both circuit breakers of the two voltage levels (6 and 10 kV) must be switched off by the emergency off switch (big red push button located on the control stand).
4.2. Procedure of the switch off
1. After completing the measurements the equipment shell be switched off after setting the SZ transformer to the down-end position.
2. Switch off the 2T 6 kV, then the 1T 10 kV circuit breakers.
3. Switch off the 1S and the 2S disconnectors, and then switch off the supply voltage of the control stand.
4. After switching off the circuit breakers and the disconnectors a warning sign “SWITCH ON IS FORBIDDEN” („BEKAPCSOLNI TILOS”) shell be put on the key switch and the ON push button.
ATTENTION! The 600 kV test transformer can be operated by authorized persons only!
5. Control questions
1. Laboratory safety regulation
2. Operation rules of the 600 kV test transformer 3. Operation manual of the EMDEX II meter.
4. Measuring principle of the EMDEX II meter.
5. Knowledge of the EMCALC 2000 software.
6. Effects of the electric and magnetic fields.
7. Biological limit of the magnetic field.
6. Template of measuring report
6.1. Measurement of Magnetic Field of Electric Machines
Date of measurement:
Place of measurement:
Leader of measurement:
Names + NEPTUN codes of students:
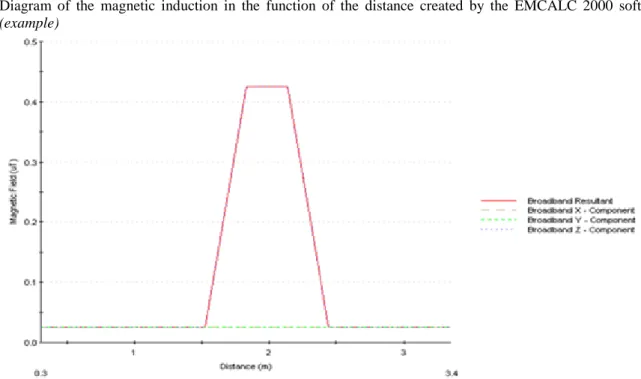
6.2. Indoor measurement perpendicular to the cable duct
The measured results: (example)
Diagram of the magnetic induction in the function of the distance created by the EMCALC 2000 software:
(example)
Evaluation:
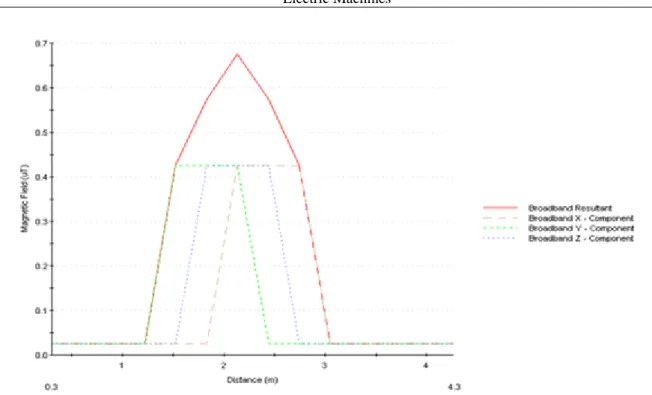
6.3. Outdoor measurement close to the transformer, perpendicular to the cable duct
The measured results: (example)
Diagram of the magnetic induction in the function of the distance created by the EMCALC 2000 software:
(example)
Measurement of Magnetic Field of Electric Machines
Evaluation:
6.4. Outdoor measurement between the high voltage laboratory and the transformer, parallel to the cable duct
The measured results: (example)
Diagram of the magnetic induction in the function of the distance created by the EMCALC 2000 software:
(example)
Evaluation:
4. fejezet - Investigation of windings of electric machines
This guide has been made for the MSc students of specialization “Electric machines and drives”. Knowledge connecting to the measurement of insulation resistance and partial discharges is now completed by overvoltage impulse tests. This topic is presented connecting to the examination of the insulation of transformers.
1. Distribution of the overvoltage inside the winding of transformers
To dimension the insulation between the turns and layers as well as the insulation between the winding and earth, it is necessary to know their electric stress. This stress in case of normal operation and AC test voltage is much lower than it is in case of an overvoltage, thus the letter one must be taken into consideration during dimensioning.
It is known, that the intensity of electric stress in a certain winding due to a given overvoltage is determined by the wave-impedance, the value of the inductance, resistance, from the point of the transient processes the winding can be substituted by simplified circuit diagram shown in Fig. 1. In this circuit diagram L and R represent the inductance and the resistance per a unity length, while C x and C f are the serial capacitance and the capacitance related to the ground.
Fig. 1.: Equivalent circuit of the winding
1.1. Initial voltage distribution inside the winding
When an overvoltage of a high initial steepness enters into the coil, the initial u C (x) voltage distribution will be practically determined by the capacitances. Its reason is that in case of a high du/dt steepness X C <<R<<X L. As a primary estimation resistance and inductive reactance can be considered to be infinity; in this case the voltage distribution at t=0 can be expressed by the following differentiating equation:
(1)
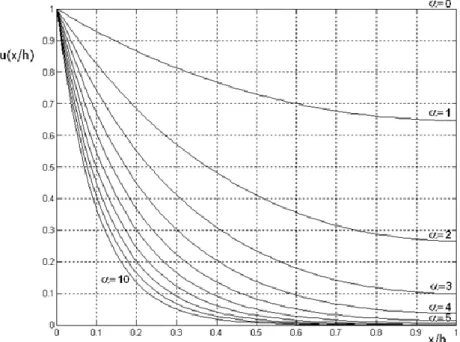
Assuming a coil with a length of h and grounded end the following initial distribution of potential can be obtained at u(0)=U and u(h)=0 parameters:
(2)
in the previous expression value of α can be expressed by
(3)
Investigation of windings of electric machines
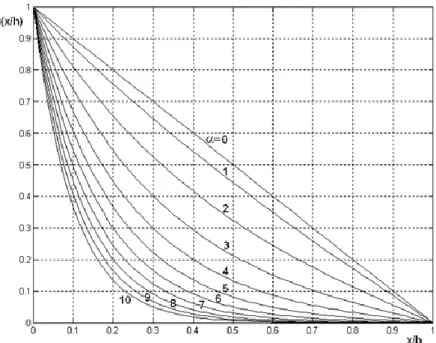
Calculating the potential distribution for different α values diagrams in Fig. 2 can be obtained. Serial capacitance related to the ground capacitance decreases with increasing α, thus voltage distribution becomes more uneven.
2. ábra: Initial distribution of voltage in a coil with grounded end
Uniform potential distribution can be accessed by decreasing the value of α(approximating α=0) by increasing the serial capacitance
Steepness of the potential distribution curve is the highest at the beginning of the coil (at t=0). It means, that the electric stress of insulation will be the highest at he beginning of the coil.
In case of a coil that has no grounded end, the following boundary condition is valid:
The voltage value can be calculated with the following formula:
(4)
The voltage of a given point reaches it steady state value after oscillations. The first – highest – overshoot can be not more than the difference between the steady state and the initial value. In practice the real oversoot is significantly less than the previous one because of the resistance of the coil and the damping effect of the iron core.
Fig. 3.: Initial voltage distribution along a coil with grounded end
Frequencies of oscillations are determined by the inductance and capacity of the coil. Usually more oscillations with different frequencies are superimposed. Time of oscillation depends on the damping. The total oscillation process can be longer than the standard incoming wave (1,2/50).
Initial voltage distribution curves for different α values in a coil with open end can be seen in Fig. 3. Comparing Fig. 2 and Fig. 3 it is interesting, that in case of α≥4, the initial voltage distribution is independent of the grounding of the end. Taking into consideration, that in case of power transformers usually α>5 is valid, voltage distribution in transformers with coils of star connection is independent from the grounding or not grounding of the star point.
1.2. Effect of steepness on the initial voltage distribution
Because of assumption R=∞ and L=∞ the diagrams of voltage distribution represented before are valid for impulses with steep front, practically for unit step. Decreasing the steepness of the front, resistance and inductance of the coil cannot be considered to be infinite related to the capacitances. In this case these elements are also influencing the potential distribution making it more uniform.
2. Voltage distribution after a certain time
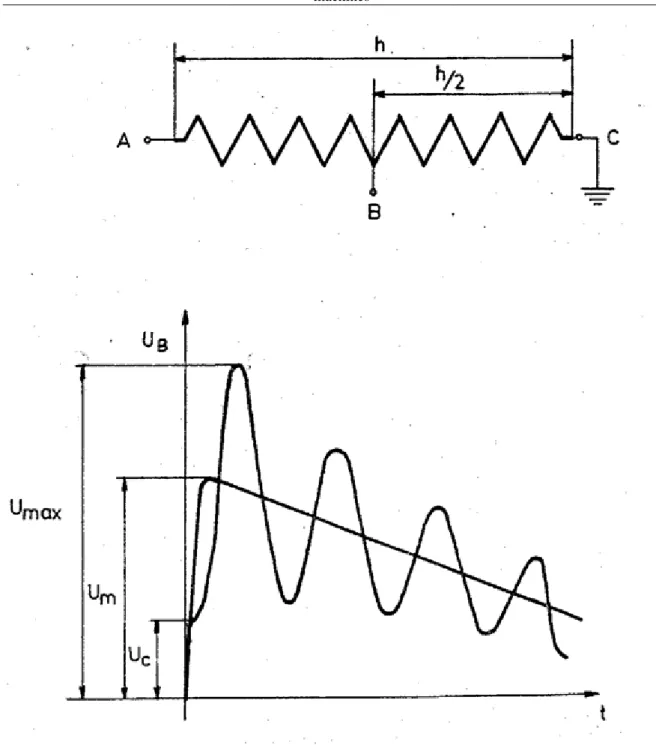
Let us select a point of the coil (for example point B in the middle) and examine the time function of the voltage (Fig. 4). Initial (capacitive) voltage U c appearing at the moment of the intrusion of voltage impulse is always less than the value at uniform potential distribution, in our case U C <U/2.
After a certain time (when the voltage impulse is at its descending part) the voltage distribution is determined by the resistance and inductance of the coil. Therefore the voltage is equal to the value at uniform distribution in case of unit step and nearly equal to the value at uniform distribution in case of decreasing voltage.
As it is known, a coil with given L and C s parameters has several self-frequencies, thus it is possible, that some of them are the same as the base frequency or its higher harmonics. Unit step contains the total spectrum of frequency, so all of the harmonic oscillations can be developed. As the steepness of the overvoltage impulse decreases, higher frequencies will be missing from the spectrum, number of higher harmonics developed is reducing, thus the oscillations become more and more “smooth”, base frequency becomes more and more dominant. At a signal with very low steepness, no oscillation is developing, so the voltage distribution along the coil will be nearly uniform.
Investigation of windings of electric machines
Fig. 4.: Change of voltage as a function of time at a given point of a coil
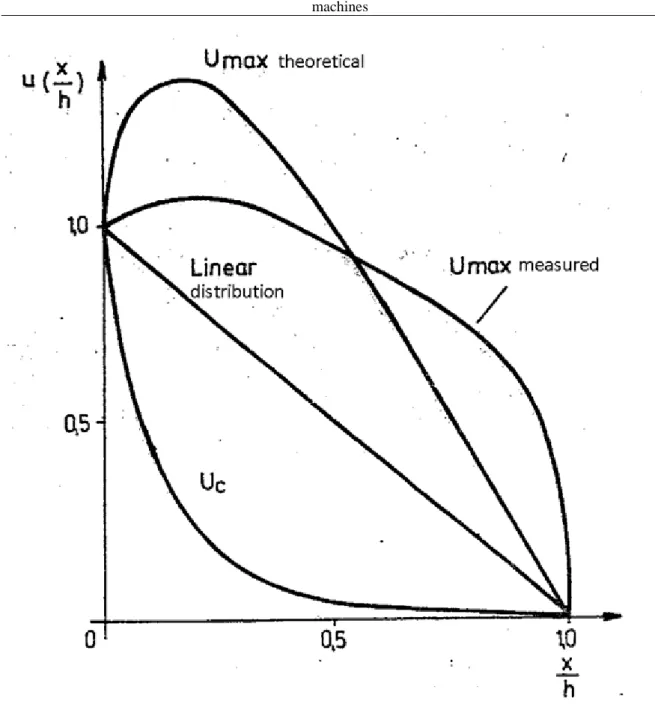
Usually the highest stress for the insulation is the first overshoot U max. It is independent from the fact, that this overshoot appears at different moments at different parts of the coil. Theoretical enveloping curve of maximal voltages (Fig. 5) can be easily constructed knowing the diagram of the initial voltage distribution in the following way. Calculate the difference between the uniform and initial voltage values and add it to the values of uniform distribution from point to point. The real voltage peaks are lower than the theoretical ones at the beginning of the coil because of the damping effects mentioned before. However at the end they can exceed the theoretical peaks because of the addition of reflected waves.
Fig. 5.: Enveloping curve of maximal voltages
2.1. Effect of the steepness of the damping part of the wave on voltage U
maxOscillations appearing inside the coil have much lower frequency than the frequency connected to the steepness of the front of incoming overvoltage impulse. As a result, at the moment, when the voltage reaches U max, the overvoltage impulse is beyond its maximum and it is decreasing. Voltages at certain points of the winding are oscillating around the value calculated for the uniform distribution. Thus it is obvious, that U max is higher in case of a wave with long damping part (meaning higher halfvalue-time) than in case of rapidly damping impulse. So the steepness of the back of the overvoltage wave (halfvalue-time) influences the maximal stress as well, see Fig. 6.
Investigation of windings of electric machines
Fig. 6.: Relationship between halfvalue-time and Umax
3. Examination with chopped voltage wave
Chopped voltage wave is generated e.g. when a protective spark gap at the input connection of a transformer starts to operate with a relatively low time delay (4-10 microseconds). In this case the front part and the peak of the overvoltage wave reach the winding of the transformer, but after the operation of the spark gape the voltage drops suddenly to zero. Standardized overvoltage impulse with chopped wave can be seen in Fig. 7.
7. ábra: Standard full and chopped wave
Investigation of windings of electric machines
Steepness of the wave at the moment of chopping is significantly higher than the steepness at the front.
(Standard lightning impulse has a front time of 1,2 μs and a halfvalue-time of 50 μs.) For outer insulators like supporting and bushing insulators, chopped overvoltage wave is a lower stress related to the total one, because the time during the insulator is under the effect of the overfolage is shorter, thus the probability of flashover or breakdown is lower.
For inner insulations the chopped overvoltage impulse can be a higher stress because of two reasons. On one hand, because of the very high steepness of the chopping a very non-iniform voltage distribution can be generated with oscillations of high magnitude. On the other hand, these oscillations are superimposed to the ones generated by the front of the overvoltage, thus it is possible, that two waves with the same phase are added (intensification). Thus, the magnitude of the resultant wave can be higher than the maximal value of the oscillations generated by the front or the chopping separately. Decreasing parameter α, stresses caused by the copped wave are also decreasing.
4. Experimental study of voltage distribution, deteminaton of oscillation diagram
Time function of voltage at certain points of the winding is similar to the one represented in Fig. 8. From such a diagram initial capacitive voltage U c and highest voltage peak U max can be determined directly. Their change along the winding can be constructed as well.
Fig. 8. ábra: Time function of voltage at a given connection point
Oscillation diagram representing the voltage at different time and positions can be constructed by the following way. Voltage values at moments t 1, t 2, t 3, ... are determined from oscillograms recorded as a function of time at different points. (See Fig. 8.) Doing this for several point if the winding it is possible to draw how the voltage is changing along the coil at given time moments (t 1, t 2, t 3, ...), see Fig. 9. Drawing such diagrams (usually five to ten ones) in one figure, the oscillation diagram can be obtained. (Fig. 10.)
9. ábra: Voltage distribution along the wingding at t=t1
From the oscillation diagram it is possible to determine the voltage distribution along the coil at different time moments.
Investigation of windings of electric machines
10. ábra: Oscillation diagram of a coil
4.1. Examination of stresses in a transformer of delta connection
It is typical, that an overvoltage impulse reaches the transformer travelling along two or three phase conductors.
In transformers, where the coils are connected in delta, the overvoltage wave reach the end of the coils at the same time, thus the stress is significantly different related to the star connection.
11. ábra: Voltage distribution of a coil in a delta connection