materials
Article
Utilization of Carbon Nanospheres in Photocatalyst Production: From Composites to Highly Active
Hollow Structures
Tamás Gyulavári1,2 , Gábor Veréb1,3,* , Zsolt Pap1,4,5,*, Balázs Réti2, Kornelia Baan2, Milica Todea4,6, Klára Magyari4 , Imre Miklós Szilágyi7 and Klara Hernadi1,2
1 Research Group of Environmental Chemistry, Institute of Chemistry, University of Szeged, H-6720 Szeged, Tisza Lajos krt. 103, Hungary
2 Department of Applied and Environmental Chemistry, University of Szeged, H-6720 Szeged, Rerrich tér 1, Hungary
3 Institute of Process Engineering, Faculty of Engineering, University of Szeged, H-6725 Szeged, Moszkvai krt.
9, Hungary
4 Nanostructured Materials and Bio-Nano-Interfaces Center, Interdisciplinary Research Institute on Bio-Nano-Sciences, Babes-Bolyai University, RO–400271 Cluj-Napoca, Treboniu Laurian 42, Romania
5 Institute of Environmental Science and Technology, University of Szeged, H-6720, Szeged, Tisza Lajos krt.
103, Hungary
6 Department of Molecular Sciences, Faculty of Medicine, Iuliu Ha¸tieganu University of Medicine and Pharmacy, RO–400012 Cluj-Napoca, Romania
7 Department of Inorganic and Analytical Chemistry, Budapest University of Technology and Economics, H-1111 Budapest, Hungary
* Correspondence: verebg@mk.u-szeged.hu (G.V.); pzsolt@chem.u-szeged.hu (Z.P.);
Tel.:+36-62-546-582 (G.V.);+36-62-544-338 (Z.P.)
Received: 8 July 2019; Accepted: 7 August 2019; Published: 9 August 2019 Abstract: Titanium dioxide–carbon sphere (TiO2–CS) composites were constructed via using prefabricated carbon spheres as templates. By the removal of template from the TiO2–CS, TiO2hollow structures (HS) were synthesized. The CS templates were prepared by the hydrothermal treatment of ordinary table sugar (sucrose). TiO2–HSs were obtained by removing CSs with calcination. Our own sensitized TiO2was used for coating the CSs. The structure of the CSs, TiO2–CS composites, and TiO2–HSs were characterized by scanning electron microscopy (SEM), infrared spectroscopy (IR), X-ray diffraction (XRD), X-ray photoelectron spectroscopy (XPS), and diffuse reflectance spectroscopy (DRS). The effect of various synthesis parameters (purification method of CSs, precursor quantity, and applied furnace) on the morphology was investigated. The photocatalytic activity was investigated by phenol model pollutant degradation under visible light irradiation (λ>400 nm). It was established that the composite samples possess lower crystallinity and photocatalytic activity compared to TiO2
hollow structures. Based on XPS measurements, the carbon content on the surface of the TiO2–HS exerts an adverse effect on the photocatalytic performance. The synthesis parameters were optimized and the TiO2–HS specimen having the best absolute and surface normalized photocatalytic efficiency was identified. The superior properties were explained in terms of its unique morphology and surface properties. The stability of this TiO2–HS was investigated via XRD and SEM measurements after three consecutive phenol degradation tests, and it was found to be highly stable as it entirely retained its crystal phase composition, morphology and photocatalytic activity.
Keywords: titanium dioxide; carbon spheres; hollow structures; composite; visible light;
photocatalysis; phenol
Materials2019,12, 2537; doi:10.3390/ma12162537 www.mdpi.com/journal/materials
Materials2019,12, 2537 2 of 20
1. Introduction
TiO2 nanoparticles in the excited state are capable of generating free radicals resulting in photoinduced reactions like disinfection [1–5], degradation of various organic pollutants [6–9], and production of H2, as an alternative green energy source [8,10–12]. Despite the well-known advantages of TiO2(it is cheap, chemically stable, and available in large quantities in pure form), it has relatively wide band gap (3.02 eV for rutile and 3.20 eV for anatase [13]). This feature limits the scope of its practical applications as it can only be excited efficiently by UV photons. Over the last three decades, a large number of publications were dedicated to the improvement of the photocatalytic activity and the excitability of TiO2. These included doping with various non-metals [2,6,10,14], modifying with noble metals [15–17], sensitizing with dyes [18,19], synthesizing TiO2with various morphologies [11,20], and coupling TiO2with other semiconductors [21–23]. A promising direction is the use of different forms of carbon, e.g., carbon nanotubes [2,24–26], graphite oxide [27], activated carbon [7], graphene [28], and graphene oxide [1]. Carbon materials have the potential of improving the photocatalytic activity of TiO2by (1) narrowing the band gap of the semiconductor, (2) decreasing the recombination rate of photogenerated charge carriers, (3) providing more active reaction/adsorption centers in greater amounts and higher surface area, (4) acting as a photosensitizer for the photocatalytic reactions, and (5) prolonging the lifespan of charge carriers [27,29,30]. There are numerous examples described in the literature where most of these advantageous effects were observed when amorphous (that is, not crystalline) carbon was used [31–33].
Recently, semiconductor-based hollow structures have been extensively investigated due to their exceptional optical, optoelectronic, magnetic, electrical, thermal, and chemical properties [34–37].
Multiple reflections within the hollow cavity may lead to more efficient light harvesting resulting in the production of more photogenerated charge carriers, thus increasing the photocatalytic efficiency of the semiconductor. For the preparation of spherical hollow structures the use of various methods (e.g., hydrothermal, sonochemical, and template-based) [38] have been reported. One of the most appropriate template materials are carbon spheres, due to their environmentally friendly nature and the high hydrophilicity due to the polar –OH and –C=O surface groups [39]. Additionally, the properties of these spheres are finely tunable, including diameter, surface area, accretion and carbon layer arrangement [40,41]. The beneficial effects of the unique morphology on the photocatalytic activity have been reported in numerous publications [38,42].
In the current paper, CSs were prepared by a facile, hydrothermal method from ordinary table sugar and used as templates to synthesize TiO2–CS composites and TiO2–HS by template removal method. For the TiO2 coating our own synthesis method (from a previous publication [43]) was used, which resulted in highly visible light-active TiO2(denoted as ‘Rutile-H2’). To the best of our knowledge, coating carbon spheres with TiO2rather than using titanium dioxide precursors (i.e., using existing synthesis method to form TiO2coating) has not been reported so far. Moreover, publications about visible light-active titania hollow structures are scarce, so a further aim of this paper was to give information about beneficial synthesis parameters in relation with visible light-active hollow structural titanium dioxides. To this, an attempt was made to further increase the photocatalytic activity of the Rutile-H2 sample and to describe in detail the differences of its structure and photocatalytic activity before (composite material) and after (hollow structure) removing the CS template, in the case of visible light irradiation.
2. Materials and Methods
2.1. Materials
To prepare the TiO2–CS composites and TiO2hollow structures, Ti(IV) butoxide (Sigma-Aldrich, Schnelldorf, Germany; reagent grade; 97%), HCl (VWR Chemicals, Debrecen, Hungary; 37%), NaOH (Molar Chemicals, Halásztelek, Hungary; a.r.; 50%) H2O2(Sigma-Aldrich, Schnelldorf, Germany; 30%), and ultrapure water (Millipore Milli-Q, Budapest, Hungary) were used. Carbon sphere templates
Materials2019,12, 2537 3 of 20
were synthesized by using ordinary table sugar (sucrose, Magyar Cukor Zrt., KoronásTM, Kaposvár, Hungary) as carbon source, acetone (Molar Chemicals; 99.96%), and Milli-Q water for their purification.
As model pollutant phenol (Spektrum 3D; analytical grade) was used to examine the photocatalytic activities. Our own ‘Rutile-H2’ TiO2(a nonhollow structural, rutile TiO2with improved visible light excitability, published in our previous work [43]) and ‘Rutile-H2_calc’ (a TiO2synthesized by the calcination of Rutile-H2 the same way as the TiO2hollow structures were synthesized, only without the addition of CS templates) were used as references together with commercial Evonik Aeroxide P25.
2.2. Preparation of the Carbon Sphere Templates
The synthesis method of carbon sphere templates (CSs) was based on our recent publication [41]. In a Teflon-lined stainless steel autoclave (Vtotal=623 mL), 180.7 mL 0.15 M sucrose solution was prepared and the pH was set to 12 using 2 M sodium hydroxide (Vfill/Vtotal=29%). Then, the hydrothermal treatment of CSs was carried out by placing the autoclave in a drying oven at 180◦C for 12 h. Subsequently, the brownish-black product was collected as soon as the autoclave cooled down to room temperature. To remove the residual organic contaminants formed during the hydrothermal synthesis, two different purification methods were applied and compared: membrane filtration and centrifugation. For the membrane filtration 250 mL of the CS suspension was membrane filtered through a polyvinylidene fluoride (PTFE) ultrafilter membrane in a batch-stirred membrane reactor (Millipore, XFUF07601, Burlington, MA, USA) under vigorous magnetic stirring until the volume reduction ratio (VRR) was 5 (200 mL permeate and 50 mL concentrate were produced). Then, the concentrate was purified by various cycles of acetone or Milli-Q water addition, followed by repeated filtrations. One cycle meant the addition of 200 mL acetone or Milli-Q water and the subsequent filtration, until reaching the desired VRR=5 value. The lowest degree of purification was carried out by the utilization of 1 acetone and 1 Milli-Q cycle, a medium purification by 3 acetone and 1 Milli-Q cycles, and, meanwhile, the most purified CS was prepared by 5 acetone and 2 Milli-Q water cycles, respectively. Total amounts of the employed acetone and Milli-Q water were 100–500 mL/g CS and 100–200 mL/g CS, respectively. At the second part of the research, centrifugation was used for the purification of CSs, which proved to be a more feasible method. CSs were washed in three cycles using solely acetone. The rate of centrifugation was 13,400 rpm and the total amount of acetone was 80 mL/g CS. At the end of both purification methods, the solid product was dried in air at 40◦C and was ground in agate mortar.
2.3. Preparation of the TiO2–CS Composites and TiO2Hollow Structures
For the synthesis of the TiO2coating our own synthesis method (described in detail in our recent publication [43]) was applied (resulting the ‘Rutile-H2’ TiO2), as follows. For a typical synthesis, 3.5 mL Milli-Q water was poured into a beaker and 1.3 mL hydrogen peroxide, and 1.58 mL hydrochloric acid was added to it under vigorous magnetic stirring. Then, to the previously prepared solution 2.14 mL Ti(O-nBu)4
was added dropwise at a constant rate of 1 mL·min−1. Subsequently, after waiting 60 min to ensure the phase separation of the organic and inorganic phase of the titanium dioxide precursor, the bottom, dark orange colored inorganic phase containing the peroxo-titanium complex was isolated using a separatory funnel. In the next step, the coating process took place by adding 1.9 g of the previously prepared CSs to the titania containing inorganic phase, which was then sonicated for 10 min. The as-prepared suspension was aged for 48 h at 55◦C to initiate the crystallization process, resulting in the TiO2–CS composites.
Afterwards, CSs were eliminated by calcination using either muffle furnace (Nabertherm B 180 type) without additional air supply or a tube furnace (Thermolyne 21100 type) under continuous air supply (0.5 dm3·min−1) with a heating rate of 5◦C·min−1for 4 h at 400◦C resulting the TiO2–HSs (based on the TG-DTG measurements of our previous publication applying 400◦C was sufficient to remove the CS templates [41]). The names of the TiO2samples are as follows; ‘H2_HS_X’, where H2 refers to our previous
‘Rutile-H2’ TiO2whose synthesis method was used for the coating process, HS refers to hollow structures, and X is the number indicating the synthesis conditions. The applied CSs, the name of the TiO2samples and the various synthesis conditions were summarized in Table1.
Materials2019,12, 2537 4 of 20
Table 1.Applied synthesis parameters during the preparation of TiO2-C composites and HSs (*: no HSs; **: moderate quality HSs; ***: excellent quality HSs).
CS Purification Method
Washing
Cycles TiO2 TiO2:CS
Weight Ratio Furnace Quality of HSs
Membrane filtration 3 H2_HS_1 0.84
Muffle (without air
supply)
*
Membrane filtration 1 H2_HS_2 0.26
Muffle (without air
supply)
**
Membrane filtration 3 H2_HS_3 0.26
Muffle (without air
supply)
**
Membrane filtration 5 H2_HS_4 0.26
Muffle (without air
supply)
**
Centrifugation - H2_HS_5 0.26
Muffle (without air
supply)
***
Centrifugation - H2_HS_6 0.26
Tube (with constant air
supply)
***
2.4. Characterization Methods and Instrumentation
X-ray diffractograms were acquired by using a Rigaku diffractometer. The settings for the measurements were 30 mA, 40 kV,λCu Kα=0.15406 nm, and the 20–40 (2θ◦) interval was recorded.
The Scherrer equation was applied for the evaluation of mean primary crystallite sizes. For the estimation of anatase and rutile weight fractions the peak areas at 25.3 (2θ◦) and 27.5 (2θ◦) were utilized, respectively, using the following equation [44,45].
WR= AR
0.884×AA+AR
where WR is the ratio of rutile crystal phase and AA and AR are the peak areas of anatase and rutile, respectively.
A Hitachi S-4700 Type II scanning electron microscope (SEM, Tokyo, Japan) was used to determine the samples’ particle sizes. For the production and acceleration of electron beam a cold field emission gun and 10 kV acceleration voltage was applied, respectively. The morphology was observed by collecting the secondary electrons with an Everhart–Thornley detector. The as-recorded SEM micrographs were used to examine the diameters of the hollow structures.
To obtain the diffuse reflectance spectra (DRS), a Jasco-V650 spectrophotometer (JASCO Deutschland GmbH, Pfungstadt, Germany) was used, which was equipped with an ILV-724-type integration sphere. The spectra were recorded in theλ=220 to 800 nm region.
FT-IR measurements were conducted on a Jasco 6000 spectrometer. The parameters for the process were spectral resolution 4 cm−1, 400–4000 cm−1range. For the evaluation of TiO2samples, they were added to KBr powder, from which pellets were produced.
The BET method was used to calculate the specific surface areas of the titanium dioxide samples, for which a BELCAT-A device was used to record the isotherms at 77 K via N2adsorption.
For the X-ray photoelectron spectroscopy (XPS) measurements a Specs Phoibos 150 MCD type device was used. The apparatus included the following parts: a hemispherical analyzer, a monochromatic Al-Kαsource (1486.6 eV) at 14 kV and 20 mA, and a charge neutralization device. For the measurements the samples were installed on double-sided carbon tapes. The applied settings during the process were as follows: X-ray source, 200 W, and the pressure in the analysis varied between 10−9–10−10 mbar. The binding energy scale was charge referenced to the C1s at 284.6 eV.
Materials2019,12, 2537 5 of 20
Analyzer pass energy of 20 eV in steps of 0.05 eV was applied to obtain high resolution Ti2p and O1s spectra. CasaXPS software was used for the evaluation of the data.
2.5. Evaluation of the Photocatalytic Efficiencies
Photocatalytic performance of the TiO2–CS composites and hollow structures was investigated by the photocatalytic decomposition of phenol (cphenol = 0.1 mM) under visible light irradiation (λ>400 nm). For the excitation of the photocatalysts, 4 conventional energy saving lamps (Düwi 25920/R7S-24W) were used, which surrounded a double-walled glass vessel containing the samples.
During the entire procedure a constant temperature of 25◦C was set, and air was continuously supplied into the photoreactor via a glass tube to maintain the dissolved oxygen level. In the thermostating jacket of the glass vessel 1 M NaNO2solution was circulated in order to cut-offUV photons (λ<
400 nm). The emission spectrum of the lamp can be seen in Figure S1. The suspensions of the photocatalysts containing the model contaminant phenol were left to be stirred in the dark for 30 min to reach adsorption/desorption equilibrium. The changes in the phenol concentration were followed by a Hitachi high performance liquid chromatography (HPLC) system equipped with a Lichrospher RP 18 column. As eluent, 50–50% methanol/water mixture was applied, and the detection wavelength was 210 nm. The possible mechanism of the photocatalytic oxidation of phenol has been extensively investigated in the literature [46–48] and based on the published results a figure representing the possible reactions and byproducts of phenol was constructed (Figure1), which was used to investigate the intermediates formed during the degradation process.
Materials 2019, 12, x FOR PEER REVIEW 5 of 21
settings during the process were as follows: X-ray source, 200 W, and the pressure in the analysis varied between 10−9–10−10 mbar. The binding energy scale was charge referenced to the C1s at 284.6 eV. Analyzer pass energy of 20 eV in steps of 0.05 eV was applied to obtain high resolution Ti2p and O1s spectra. CasaXPS software was used for the evaluation of the data.
2.5. Evaluation of the Photocatalytic Efficiencies
Photocatalytic performance of the TiO2–CS composites and hollow structures was investigated by the photocatalytic decomposition of phenol (cphenol = 0.1 mM) under visible light irradiation (λ >
400 nm). For the excitation of the photocatalysts, 4 conventional energy saving lamps (Düwi 25920/R7S-24W) were used, which surrounded a double-walled glass vessel containing the samples.
During the entire procedure a constant temperature of 25 °C was set, and air was continuously supplied into the photoreactor via a glass tube to maintain the dissolved oxygen level. In the thermostating jacket of the glass vessel 1 M NaNO2 solution was circulated in order to cut-off UV photons (λ < 400 nm). The emission spectrum of the lamp can be seen in Figure S1. The suspensions of the photocatalysts containing the model contaminant phenol were left to be stirred in the dark for 30 min to reach adsorption/desorption equilibrium. The changes in the phenol concentration were followed by a Hitachi high performance liquid chromatography (HPLC) system equipped with a Lichrospher RP 18 column. As eluent, 50–50% methanol/water mixture was applied, and the detection wavelength was 210 nm. The possible mechanism of the photocatalytic oxidation of phenol has been extensively investigated in the literature [46–48] and based on the published results a figure representing the possible reactions and byproducts of phenol was constructed (Figure 1), which was used to investigate the intermediates formed during the degradation process.
Figure 1. Possible intermediates of phenol during its photocatalytic oxidation [46–48].
3. Results and Discussion
3.1. Characterization of the Carbon Sphere Templates
According to X. Sun and Y. Li, during the hydrothermal synthesis of carbon spheres the following steps occur (in accordance with the LaMer model [49]); (i) after reaching the necessary
Figure 1.Possible intermediates of phenol during its photocatalytic oxidation [46–48].
3. Results and Discussion
3.1. Characterization of the Carbon Sphere Templates
According to X. Sun and Y. Li, during the hydrothermal synthesis of carbon spheres the following steps occur (in accordance with the LaMer model [49]); (i) after reaching the necessary concentration and temperature of the solution, aromatic compounds and oligosaccharides form (indicated by the
Materials2019,12, 2537 6 of 20
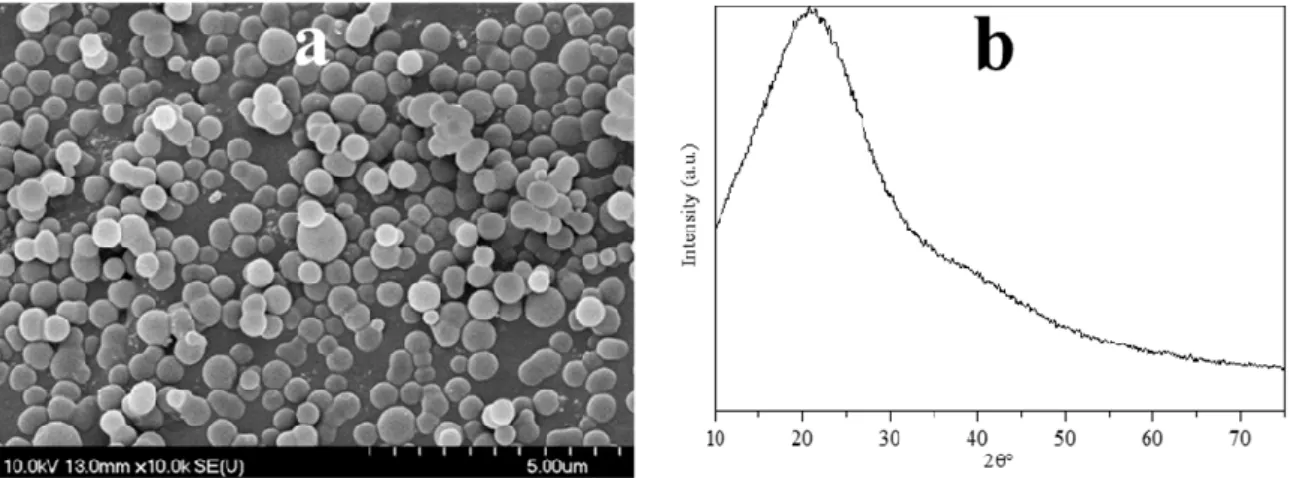
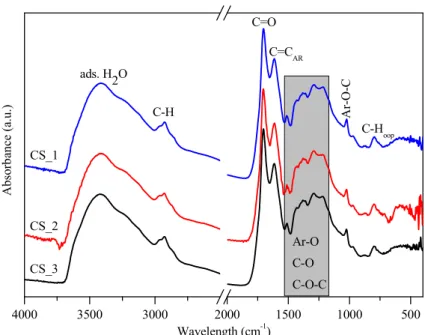
increasing viscosity and the orange/red color of the solution), then polymerization occurs; (ii) the solution reaches supersaturation resulting in nucleation followed by the cross-linking of linear/branch-like oligosaccharides and other macromolecules; and (iii) the as-formed nuclei grow uniformly and isotropically by the diffusion of solutes reaching its final size [50]. To remove the previously mentioned organic residues, two different methods were applied: membrane filtration and centrifugation. In our previous publication the carbon spheres were purified with vacuum filtration and characterized in detail [41]; however, in this work, new purification methods were applied in order to develop a more suitable method providing better yield, since vacuum filtration had very low flux (resulting in low CS yield) due to the fouling of the filter; meanwhile, membrane filtration enabled magnetic stirring to be applied during the filtration. Based on the SEM and XRD analysis, no differences were observed between the variously purified CSs, thus one typical SEM micrograph and XRD diffractogram were represented in Figure2. The SEM micrographs showed well-defined sphere morphology with a mean diameter of 458 nm±75 nm. Based on the XRD analysis, one broad peak was observed at ~22 (2θ◦), which was attributed to amorphous carbon, and no other reflections were detected, as expected [41]. The correlation between carbon sphere purity and the quality of the resulting hollow structures was investigated by using CSs purified via membrane filtration with different amounts of acetone, which were characterized further by FT-IR measurements (Figure3). Additionally, the carbonization of sucrose solution during the hydrothermal treatment was also examined. Absorption bands at 3420, 2920, 1700, and 1615 cm−1 can be attributed to physisorbed water, C–H stretching vibration, C=O stretching vibration, and C=C vibration in the aromatic ring, respectively [51]. The signals in the spectral range of 1100 to 1400 cm−1correspond to C–OH stretching vibration and OH bending vibration, indicating the presence of hydroxyl groups in large quantities [50,52]. The FT-IR spectra indicated no significant difference between the quality of the carbon spheres’ surface and purity, from which it can be presumed, that by the utilization of these CSs no considerable difference should be observable in the properties of the resulting HSs.
Materials 2019, 12, x FOR PEER REVIEW 6 of 21
concentration and temperature of the solution, aromatic compounds and oligosaccharides form (indicated by the increasing viscosity and the orange/red color of the solution), then polymerization occurs; (ii) the solution reaches supersaturation resulting in nucleation followed by the cross-linking of linear/branch-like oligosaccharides and other macromolecules; and (iii) the as-formed nuclei grow uniformly and isotropically by the diffusion of solutes reaching its final size [50]. To remove the previously mentioned organic residues, two different methods were applied: membrane filtration and centrifugation. In our previous publication the carbon spheres were purified with vacuum filtration and characterized in detail [41]; however, in this work, new purification methods were applied in order to develop a more suitable method providing better yield, since vacuum filtration had very low flux (resulting in low CS yield) due to the fouling of the filter; meanwhile, membrane filtration enabled magnetic stirring to be applied during the filtration. Based on the SEM and XRD analysis, no differences were observed between the variously purified CSs, thus one typical SEM micrograph and XRD diffractogram were represented in Figure 2. The SEM micrographs showed well-defined sphere morphology with a mean diameter of 458 nm ± 75 nm. Based on the XRD analysis, one broad peak was observed at ~22 (2θ°), which was attributed to amorphous carbon, and no other reflections were detected, as expected [41]. The correlation between carbon sphere purity and the quality of the resulting hollow structures was investigated by using CSs purified via membrane filtration with different amounts of acetone, which were characterized further by FT-IR measurements (Figure 3). Additionally, the carbonization of sucrose solution during the hydrothermal treatment was also examined. Absorption bands at 3420, 2920, 1700, and 1615 cm−1 can be attributed to physisorbed water, C–H stretching vibration, C=O stretching vibration, and C=C vibration in the aromatic ring, respectively [51]. The signals in the spectral range of 1100 to 1400 cm−1 correspond to C–OH stretching vibration and OH bending vibration, indicating the presence of hydroxyl groups in large quantities [50,52]. The FT-IR spectra indicated no significant difference between the quality of the carbon spheres’ surface and purity, from which it can be presumed, that by the utilization of these CSs no considerable difference should be observable in the properties of the resulting HSs.
Figure 2. Typical SEM micrograph (a) and XRD diffractogram (b) of the obtained carbon spheres.
Figure 2.Typical SEM micrograph (a) and XRD diffractogram (b) of the obtained carbon spheres.
Materials2019,12, 2537 7 of 20
Materials 2019, 12, x FOR PEER REVIEW 7 of 21
Figure 3. IR spectra of carbon spheres purified with increasing amounts of acetone (CS_1 < CS_2 <
CS_3, respectively) by membrane filtration.
3.2. Comparison of the TiO2–CS Composite and TiO2 Hollow Structure
TiO2–CS composite (denoted as ‘H2_CS_0’) was synthesized by coating CS purified by membrane filtration with our previous ‘Rutile-H2’ titanium dioxide (via the method described in Section 2.3), and was compared to the TiO2 hollow structure (denoted as ‘H2_HS_0’), which was obtained by the calcination of the composite in muffle furnace. The as-prepared composite and hollow structure were characterized by XRD (Figure S2), and it was found that both contained anatase phase (72% and 62% and D = 9.7 nm, 14.2 nm for H2_CS_0 and H2_HS_0, respectively) to a larger extent, compared to rutile phase (28%, 38% and D = 16.4 nm, 17.9 nm, for H2_CS_0 and H2_HS_0, respectively). The main difference in the diffraction patterns of the 2 samples was the level of crystallinity (the intensity of the diffractions of H2_HS_0 was much higher), which can be explained by the result of calcination (as well as the increase in crystallite sizes). This result is in good accordance with our previous observations that applying amorphous carbon results in the coating being amorphous and, similarly, that using crystalline carbon template results in crystalline coating [53]. Afterwards, these samples were characterized by IR measurements (Figure S3) and as expected, all of the peaks observed earlier in the previous section in case of CSs, also appeared in case of the composite sample. Additionally, a less intense peak at 1029 cm−1 was detected, which can be attributed to residues of disaccharides [54,55]. The broad absorption band between 400–600 cm−1 can be assigned to the transverse optical vibration of Ti–O bonds [56], proving the presence of TiO2 coating layer. Most importantly, these measurements were followed by the evaluation of photocatalytic activity (Figure S4), and it was found, that H2_CS_0 possessed less than half of the photocatalytic efficiency of the H2_HS_0 sample. To sum up, it was observed, that compared to Rutile-H2, the presence of carbon spheres significantly decreased the crystallinity and photocatalytic activity of the sample. Concurrently, compared to H2_CS_0 composite sample, after calcination, the H2_HS_0 sample possessed higher crystallinity as expected and also higher photocatalytic activity, which can be attributed to the resultant effect of higher crystallinity and presumably, the increased light-harvesting capabilities due to the unique morphology. Based on that discovery, the composite samples (and H2_HS_0 TiO2) were not investigated and discussed further in this paper, and more emphasis were put on the characterization of hollow structures, since despite the increased photocatalytic activity of the hollow structural TiO2, (in comparison with the composite material) the photocatalytic activity of Rutil-H2 still has not been exceeded.
As the next step, our aim was to investigate if by the application of variously purified carbon spheres and different synthesis parameters the beneficial properties of the unique morphology can
4000 3500 3000 2000 1500 1000 500
CS_1
CS_2
Absorbance (a.u.)
Wavelength (cm-1) ads. H
2O C-H
C=O C=CAR
Ar-O C-O C-O-C
Ar-O-C
C-Hoop
CS_3
Figure 3.IR spectra of carbon spheres purified with increasing amounts of acetone (CS_1<CS_2<
CS_3, respectively) by membrane filtration.
3.2. Comparison of the TiO2–CS Composite and TiO2Hollow Structure
TiO2–CS composite (denoted as ‘H2_CS_0’) was synthesized by coating CS purified by membrane filtration with our previous ‘Rutile-H2’ titanium dioxide (via the method described in Section2.3), and was compared to the TiO2hollow structure (denoted as ‘H2_HS_0’), which was obtained by the calcination of the composite in muffle furnace. The as-prepared composite and hollow structure were characterized by XRD (Figure S2), and it was found that both contained anatase phase (72% and 62%
and D=9.7 nm, 14.2 nm for H2_CS_0 and H2_HS_0, respectively) to a larger extent, compared to rutile phase (28%, 38% and D=16.4 nm, 17.9 nm, for H2_CS_0 and H2_HS_0, respectively). The main difference in the diffraction patterns of the 2 samples was the level of crystallinity (the intensity of the diffractions of H2_HS_0 was much higher), which can be explained by the result of calcination (as well as the increase in crystallite sizes). This result is in good accordance with our previous observations that applying amorphous carbon results in the coating being amorphous and, similarly, that using crystalline carbon template results in crystalline coating [53]. Afterwards, these samples were characterized by IR measurements (Figure S3) and as expected, all of the peaks observed earlier in the previous section in case of CSs, also appeared in case of the composite sample. Additionally, a less intense peak at 1029 cm−1was detected, which can be attributed to residues of disaccharides [54,55].
The broad absorption band between 400–600 cm−1can be assigned to the transverse optical vibration of Ti–O bonds [56], proving the presence of TiO2coating layer. Most importantly, these measurements were followed by the evaluation of photocatalytic activity (Figure S4), and it was found, that H2_CS_0 possessed less than half of the photocatalytic efficiency of the H2_HS_0 sample. To sum up, it was observed, that compared to Rutile-H2, the presence of carbon spheres significantly decreased the crystallinity and photocatalytic activity of the sample. Concurrently, compared to H2_CS_0 composite sample, after calcination, the H2_HS_0 sample possessed higher crystallinity as expected and also higher photocatalytic activity, which can be attributed to the resultant effect of higher crystallinity and presumably, the increased light-harvesting capabilities due to the unique morphology. Based on that discovery, the composite samples (and H2_HS_0 TiO2) were not investigated and discussed further in this paper, and more emphasis were put on the characterization of hollow structures, since despite the increased photocatalytic activity of the hollow structural TiO2, (in comparison with the composite material) the photocatalytic activity of Rutil-H2 still has not been exceeded.
Materials2019,12, 2537 8 of 20
As the next step, our aim was to investigate if by the application of variously purified carbon spheres and different synthesis parameters the beneficial properties of the unique morphology can be utilized, thus surpassing the photocatalytic activity of the reference Rutile-H2 TiO2. By the utilization of the various as-prepared carbon spheres, TiO2–CS composites were synthesized, then, by their subsequent calcination, the TiO2hollow structures were obtained, which will be discussed in detail.
The applied CSs, the name of the TiO2samples and the various synthesis conditions were summarized in Table1. For the first synthesis of composite and HS, membrane filtered CS was applied, and the applied quantity of the precursor was three times higher compared to the one written in Section2.3.
After performing the coating and subsequent SEM measurement, it was found that the quantity of TiO2precursor was too high, which resulted in the formation of irregular TiO2–CS composite (in terms of shape) and TiO2nanoparticle aggregates (Figure4a). Accordingly, after calcination (sample denoted as ‘H2_HS_1’) no regular HSs were observed (Figure4b) therefore the quantity of the TiO2precursor was reduced to one third (as the volumes are described in Section2.3), which resulted in successful coating of the CSs (Figure5).
Materials 2019, 12, x FOR PEER REVIEW 8 of 21
be utilized, thus surpassing the photocatalytic activity of the reference Rutile-H2 TiO2. By the utilization of the various as-prepared carbon spheres, TiO2–CS composites were synthesized, then, by their subsequent calcination, the TiO2 hollow structures were obtained, which will be discussed in detail. The applied CSs, the name of the TiO2 samples and the various synthesis conditions were summarized in Table 1. For the first synthesis of composite and HS, membrane filtered CS was applied, and the applied quantity of the precursor was three times higher compared to the one written in Section 2.3. After performing the coating and subsequent SEM measurement, it was found that the quantity of TiO2 precursor was too high, which resulted in the formation of irregular TiO2– CS composite (in terms of shape) and TiO2 nanoparticle aggregates (Figure 4a). Accordingly, after calcination (sample denoted as ‘H2_HS_1’) no regular HSs were observed (Figure 4b) therefore the quantity of the TiO2 precursor was reduced to one third (as the volumes are described in Section 2.3), which resulted in successful coating of the CSs (Figure 5).
Figure 4. SEM micrographs of the H2_HS_1 sample before (a) and after (b) calcination.
Figure 5. Typical SEM micrograph of samples H2_HS_2-4 before calcination.
By the utilization of CSs purified by membrane filtration with increasing amount of acetone/water (denoted as CS_1, CS_2, and CS_3, purified by the application of 1, 3, and 5 acetone washing cycles and 1, 1, and 2 Milli-Q washing cycles, respectively), further TiO2 HSs were synthesized (denoted as ‘H2_HS_2-4’), which displayed the desired hollow structural morphology based on the SEM micrographs (Figure 6a–c); however, the morphology was still imperfect, as a significant amount of damaged structures were also observed.
Figure 4.SEM micrographs of the H2_HS_1 sample before (a) and after (b) calcination.
Materials 2019, 12, x FOR PEER REVIEW 8 of 21
be utilized, thus surpassing the photocatalytic activity of the reference Rutile-H2 TiO2. By the utilization of the various as-prepared carbon spheres, TiO2–CS composites were synthesized, then, by their subsequent calcination, the TiO2 hollow structures were obtained, which will be discussed in detail. The applied CSs, the name of the TiO2 samples and the various synthesis conditions were summarized in Table 1. For the first synthesis of composite and HS, membrane filtered CS was applied, and the applied quantity of the precursor was three times higher compared to the one written in Section 2.3. After performing the coating and subsequent SEM measurement, it was found that the quantity of TiO2 precursor was too high, which resulted in the formation of irregular TiO2– CS composite (in terms of shape) and TiO2 nanoparticle aggregates (Figure 4a). Accordingly, after calcination (sample denoted as ‘H2_HS_1’) no regular HSs were observed (Figure 4b) therefore the quantity of the TiO2 precursor was reduced to one third (as the volumes are described in Section 2.3), which resulted in successful coating of the CSs (Figure 5).
Figure 4. SEM micrographs of the H2_HS_1 sample before (a) and after (b) calcination.
Figure 5. Typical SEM micrograph of samples H2_HS_2-4 before calcination.
By the utilization of CSs purified by membrane filtration with increasing amount of acetone/water (denoted as CS_1, CS_2, and CS_3, purified by the application of 1, 3, and 5 acetone washing cycles and 1, 1, and 2 Milli-Q washing cycles, respectively), further TiO2 HSs were synthesized (denoted as ‘H2_HS_2-4’), which displayed the desired hollow structural morphology based on the SEM micrographs (Figure 6a–c); however, the morphology was still imperfect, as a significant amount of damaged structures were also observed.
Figure 5.Typical SEM micrograph of samples H2_HS_2-4 before calcination.
By the utilization of CSs purified by membrane filtration with increasing amount of acetone/water (denoted as CS_1, CS_2, and CS_3, purified by the application of 1, 3, and 5 acetone washing cycles and 1, 1, and 2 Milli-Q washing cycles, respectively), further TiO2HSs were synthesized (denoted as ‘H2_HS_2-4’), which displayed the desired hollow structural morphology based on the SEM micrographs (Figure6a–c); however, the morphology was still imperfect, as a significant amount of damaged structures were also observed.
MaterialsMaterials 2019, 12, x FOR PEER REVIEW 2019,12, 2537 9 of 209 of 21
Figure 6. SEM micrographs of the H2_HS_2 (a), H2_HS_3 (b), and H2_HS_4 (c) samples (synthesized by the application of membrane filtered carbon spheres using increasing amounts of acetone/water, respectively) after calcination.
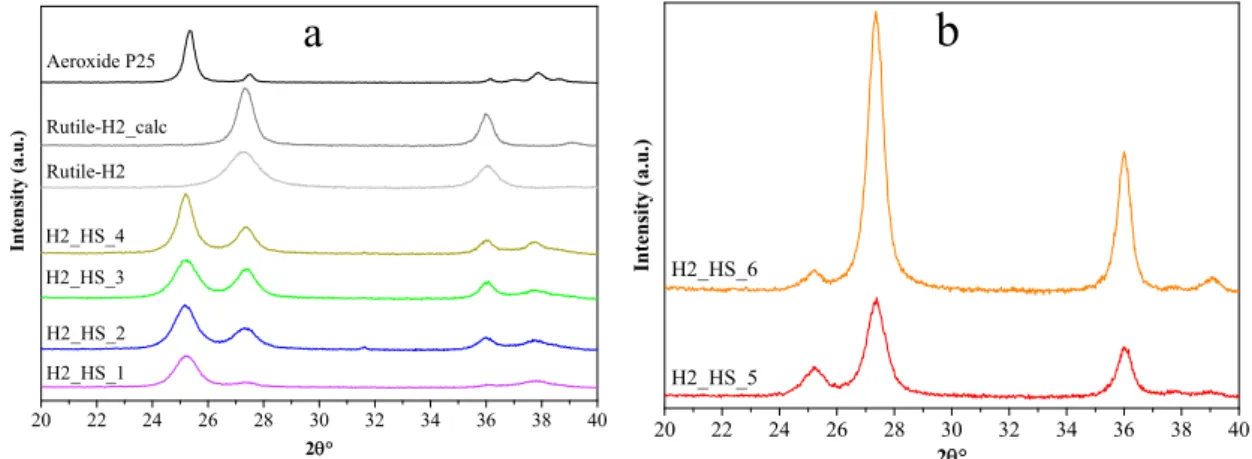
The quality of HSs was mostly uniform, which is in good accordance with the IR results, since the features of the CSs’ surface were generally identical. At this point, the crystallinity of the as-prepared TiO2 HSs, and reference photocatalysts (Evonik Aeroxide P25, Rutile-H2, and Rutile-H2_calc) was determined by XRD measurements (Figure 7a). The crystal phase distributions and average primer particle sizes are presented in Table 2. Samples H2_HS_1-4 contained predominantly anatase (1 0 1) phase (main diffraction peak at 25.6 2θ°). The size of the primer crystallites, which were the building elements of the hollow structures, varied between 9.3 and 15.0 nm. Reference photocatalysts Rutile-H2 (D = 7.3 nm) and Rutile-H2_calc (D = 14.1 nm) contained only rutile (1 1 0) (main diffraction peak at 27.2 2θ°). The size increase (and concurrent considerable loss of specific surface area) of Rutile-H2_calc can be explained by the result of calcination.
Commercial Aeroxide P25 contained 90 wt% anatase and 10 wt% rutile (Danatase = 25.4 nm and Drutile = 40 nm).
Figure 7. X-ray diffraction patterns of our own anatase phase and reference TiO2-s (a) and our own rutile phase TiO2-s (b).
To sum up the results so far, the synthesis parameters applied in the case of sample H2_HS_1 were not adequate, but after the reduction of precursor quantity (samples H2_HS_2-4), the coating process was successful (in the case of all the subsequent samples). However, the morphology was still imperfect (because of the considerable number of damaged spheres formed during the calcination) and our samples contained mainly anatase phase which is not excitable by visible light.
Also, membrane filtration as a purification method did not prove to be feasible and economical enough: until achieving VRR = 5 volume reduction ratio in every cycle, still high amount of residuals (~20% of the initial amount of the given cycle) can remain in the solution (and higher VRR would be very hard to achieve, due to the observed significant flux reduction, despite the intensive stirring).
Three times repeated centrifugation can result in several orders of magnitude higher purification efficiency of the CSs. Additionally, in the publication of Mahyar et al. they showed, that media with
20 22 24 26 28 30 32 34 36 38 40
Aeroxide P25
a
Rutile-H2_calc Rutile-H2
H2_HS_4 H2_HS_3
H2_HS_2
Intensity (a.u.)
2°
H2_HS_1
20 22 24 26 28 30 32 34 36 38 40
H2_HS_6
H2_HS_5
Intensity (a.u.)
2°
b
Figure 6.SEM micrographs of the H2_HS_2 (a), H2_HS_3 (b), and H2_HS_4 (c) samples (synthesized by the application of membrane filtered carbon spheres using increasing amounts of acetone/water, respectively) after calcination.
The quality of HSs was mostly uniform, which is in good accordance with the IR results, since the features of the CSs’ surface were generally identical. At this point, the crystallinity of the as-prepared TiO2HSs, and reference photocatalysts (Evonik Aeroxide P25, Rutile-H2, and Rutile-H2_calc) was determined by XRD measurements (Figure7a). The crystal phase distributions and average primer particle sizes are presented in Table2. Samples H2_HS_1-4 contained predominantly anatase (1 0 1) phase (main diffraction peak at 25.6 2θ◦). The size of the primer crystallites, which were the building elements of the hollow structures, varied between 9.3 and 15.0 nm. Reference photocatalysts Rutile-H2 (D=7.3 nm) and Rutile-H2_calc (D=14.1 nm) contained only rutile (1 1 0) (main diffraction peak at 27.2 2θ◦). The size increase (and concurrent considerable loss of specific surface area) of Rutile-H2_calc can be explained by the result of calcination. Commercial Aeroxide P25 contained 90 wt% anatase and 10 wt% rutile (Danatase=25.4 nm and Drutile=40 nm).
Materials 2019, 12, x FOR PEER REVIEW 9 of 21
Figure 6. SEM micrographs of the H2_HS_2 (a), H2_HS_3 (b), and H2_HS_4 (c) samples (synthesized by the application of membrane filtered carbon spheres using increasing amounts of acetone/water, respectively) after calcination.
The quality of HSs was mostly uniform, which is in good accordance with the IR results, since the features of the CSs’ surface were generally identical. At this point, the crystallinity of the as-prepared TiO2 HSs, and reference photocatalysts (Evonik Aeroxide P25, Rutile-H2, and Rutile-H2_calc) was determined by XRD measurements (Figure 7a). The crystal phase distributions and average primer particle sizes are presented in Table 2. Samples H2_HS_1-4 contained predominantly anatase (1 0 1) phase (main diffraction peak at 25.6 2θ°). The size of the primer crystallites, which were the building elements of the hollow structures, varied between 9.3 and 15.0 nm. Reference photocatalysts Rutile-H2 (D = 7.3 nm) and Rutile-H2_calc (D = 14.1 nm) contained only rutile (1 1 0) (main diffraction peak at 27.2 2θ°). The size increase (and concurrent considerable loss of specific surface area) of Rutile-H2_calc can be explained by the result of calcination.
Commercial Aeroxide P25 contained 90 wt% anatase and 10 wt% rutile (Danatase = 25.4 nm and Drutile = 40 nm).
Figure 7. X-ray diffraction patterns of our own anatase phase and reference TiO2-s (a) and our own rutile phase TiO2-s (b).
To sum up the results so far, the synthesis parameters applied in the case of sample H2_HS_1 were not adequate, but after the reduction of precursor quantity (samples H2_HS_2-4), the coating process was successful (in the case of all the subsequent samples). However, the morphology was still imperfect (because of the considerable number of damaged spheres formed during the calcination) and our samples contained mainly anatase phase which is not excitable by visible light.
Also, membrane filtration as a purification method did not prove to be feasible and economical enough: until achieving VRR = 5 volume reduction ratio in every cycle, still high amount of residuals (~20% of the initial amount of the given cycle) can remain in the solution (and higher VRR would be very hard to achieve, due to the observed significant flux reduction, despite the intensive stirring).
Three times repeated centrifugation can result in several orders of magnitude higher purification efficiency of the CSs. Additionally, in the publication of Mahyar et al. they showed, that media with
20 22 24 26 28 30 32 34 36 38 40
Aeroxide P25
a
Rutile-H2_calc Rutile-H2
H2_HS_4 H2_HS_3
H2_HS_2
Intensity (a.u.)
2°
H2_HS_1
20 22 24 26 28 30 32 34 36 38 40
H2_HS_6
H2_HS_5
Intensity (a.u.)
2°
b
Figure 7.X-ray diffraction patterns of our own anatase phase and reference TiO2-s (a) and our own rutile phase TiO2-s (b).
To sum up the results so far, the synthesis parameters applied in the case of sample H2_HS_1 were not adequate, but after the reduction of precursor quantity (samples H2_HS_2-4), the coating process was successful (in the case of all the subsequent samples). However, the morphology was still imperfect (because of the considerable number of damaged spheres formed during the calcination) and our samples contained mainly anatase phase which is not excitable by visible light. Also, membrane filtration as a purification method did not prove to be feasible and economical enough: until achieving VRR=5 volume reduction ratio in every cycle, still high amount of residuals (~20% of the initial amount of the given cycle) can remain in the solution (and higher VRR would be very hard to achieve, due to the observed significant flux reduction, despite the intensive stirring). Three times repeated centrifugation can result in several orders of magnitude higher purification efficiency of the CSs.
Additionally, in the publication of Mahyar et al. they showed, that media with different polarity
Materials2019,12, 2537 10 of 20
(a series of primer alcohols) can set up the formation of different crystal phases [57]. Based on this, it can be assumed that by applying different solvents for washing the surface of the CSs, differences in the quality of the surface can be induced, influencing the forming crystal phase composition of the deposited TiO2. Since our goal was to synthesize visible light-active TiO2-s, to which rutile phase is more advantageous (as it is excitable by visible light), further on only acetone was used as purifier solvent, and the more feasible centrifugation was applied as the purification method of CSs (sample H2_HS_5).
Table 2.Phase composition, average primary particle sizes, band gaps, and specific surface areas of the investigated TiO2-s.
Titanium-dioxide
Phase Composition
Anatase Rutile
wt%
Particle Size (nm)
wt%
Particle Size (nm)
Average Diameter
(nm)
Specific Surface Area
(m−2g−1)
Band Gap (eV)
r0,phenol (10−10 M s−1)
r0,phenol(10−12 M m−2s−1)
Surface Normalized
H2_HS_1 87.72 9.7 12.28 10.7 - 89 3.14 8.1 9.1
H2_HS_2 66.42 10.3 33.58 9.7 1202 70 3.14 6.03 8.6
H2_HS_3 56.91 9.3 43.09 10.8 1137 65 3.15 5.26 8.1
H2_HS_4 64.1 15 35.9 12.9 1237 46 3.13 7.02 15.3
H2_HS_5 20.0 12.3 80.0 12.9 880 40 3.13 24.63 61.6
H2_HS_6 4.8 18 95.2 15.5 943 46 3.13 13.65 29.7
Rutile-H2 <1 - >99 7.3 - 237 3.11 18.3 7.7
Rutile-H2_calc <1 - >99 14.1 - 39 3.09 3.4 8.8
Aeroxide P25 90 25.4 10 40 - 49 3.11 12.3 25.1
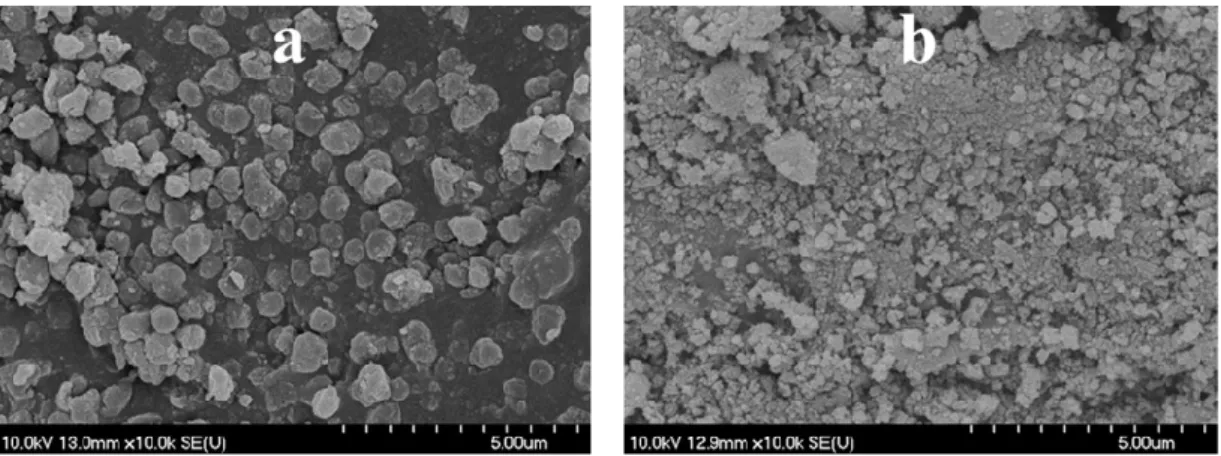
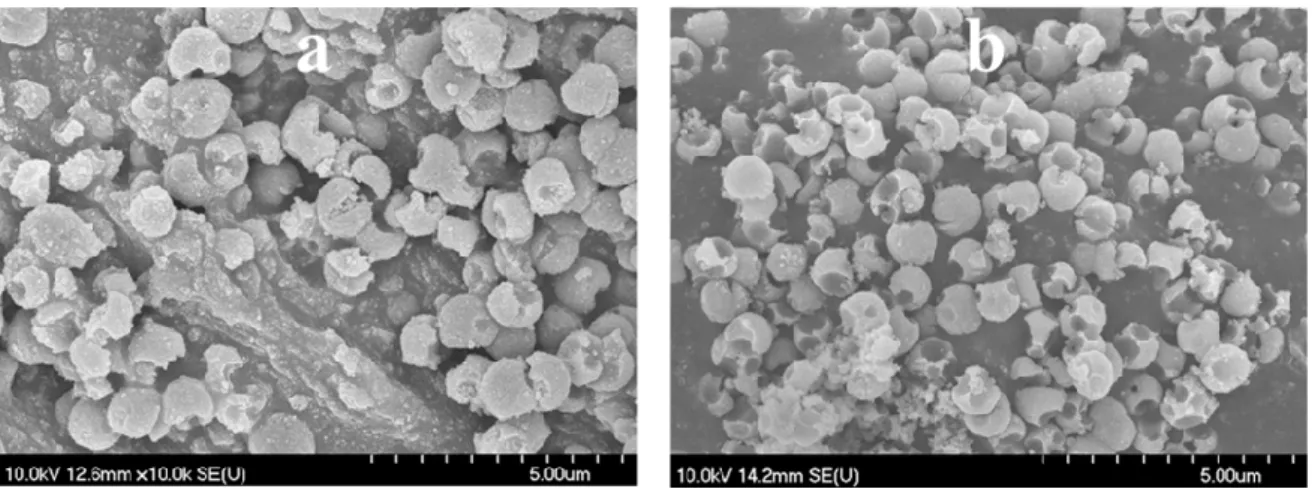
Moreover, since after the reduction of precursor quantity the coating process was always successful and the damaged structures were obtained only after calcination, another sample was synthesized where tube furnace with air supply was used for the elimination of carbon spheres (sample H2_HS_6), in contrast with using muffle furnace without additional air supply (samples H2_HS_1-5). Applying such synthesis parameters, samples H2_HS_5-6 both possessed perfect hollow structural morphology (Figure8a,b) and were predominantly rutile phase (Figure7b). Based on their greater rutile content and, more importantly, the perfect morphology, it is expected that these TiO2-s (H2_HS_5-6) should have increased photocatalytic efficiency under visible light irradiation compared to the other TiO2-s in the series (H2_HS_1-4), as rutile absorbs visible light (having a band gap of 3.02 eV [13]) and anatase does not, the hollow structure may enable better utilization of visible light, as this was already proved in the case of UV irradiation of TiO2hollow structures [38,42]. To sum up, it was deduced, that the quality of HS morphology is largely dependent on the precursor quantity and the purification method of carbon spheres.
Materials 2019, 12, x FOR PEER REVIEW 10 of 21
different polarity (a series of primer alcohols) can set up the formation of different crystal phases [57]. Based on this, it can be assumed that by applying different solvents for washing the surface of the CSs, differences in the quality of the surface can be induced, influencing the forming crystal phase composition of the deposited TiO2. Since our goal was to synthesize visible light-active TiO2-s, to which rutile phase is more advantageous (as it is excitable by visible light), further on only acetone was used as purifier solvent, and the more feasible centrifugation was applied as the purification method of CSs (sample H2_HS_5).
Table 2. Phase composition, average primary particle sizes, band gaps, and specific surface areas of the investigated TiO2-s.
Titanium-dioxide
Phase Composition Anatase Rutile
wt%
Particle Size (nm)
wt%
Particle Size (nm)
Average Diameter
(nm)
Specific Surface Area (m−2 g−1)
Band Gap (eV)
r0,phenol (10−10 M
s−1)
r0,phenol (10−12 M m−2 s−1) Surface Normalized
H2_HS_1 87.72 9.7 12.28 10.7 - 89 3.14 8.1 9.1
H2_HS_2 66.42 10.3 33.58 9.7 1202 70 3.14 6.03 8.6
H2_HS_3 56.91 9.3 43.09 10.8 1137 65 3.15 5.26 8.1
H2_HS_4 64.1 15 35.9 12.9 1237 46 3.13 7.02 15.3
H2_HS_5 20.0 12.3 80.0 12.9 880 40 3.13 24.63 61.6
H2_HS_6 4.8 18 95.2 15.5 943 46 3.13 13.65 29.7
Rutile-H2 <1 - >99 7.3 - 237 3.11 18.3 7.7
Rutile-H2_calc <1 - >99 14.1 - 39 3.09 3.4 8.8
Aeroxide P25 90 25.4 10 40 - 49 3.11 12.3 25.1
Moreover, since after the reduction of precursor quantity the coating process was always successful and the damaged structures were obtained only after calcination, another sample was synthesized where tube furnace with air supply was used for the elimination of carbon spheres (sample H2_HS_6), in contrast with using muffle furnace without additional air supply (samples H2_HS_1-5). Applying such synthesis parameters, samples H2_HS_5-6 both possessed perfect hollow structural morphology (Figure 8a,b) and were predominantly rutile phase (Figure 7b). Based on their greater rutile content and, more importantly, the perfect morphology, it is expected that these TiO2-s (H2_HS_5-6) should have increased photocatalytic efficiency under visible light irradiation compared to the other TiO2-s in the series (H2_HS_1-4), as rutile absorbs visible light (having a band gap of 3.02 eV [13]) and anatase does not, the hollow structure may enable better utilization of visible light, as this was already proved in the case of UV irradiation of TiO2 hollow structures [38,42]. To sum up, it was deduced, that the quality of HS morphology is largely dependent on the precursor quantity and the purification method of carbon spheres.
Figure 8. SEM micrographs of the H2_HS_5 (a) and H2_HS_6 (b) samples.
Figure 8.SEM micrographs of the H2_HS_5 (a) and H2_HS_6 (b) samples.
Materials2019,12, 2537 11 of 20
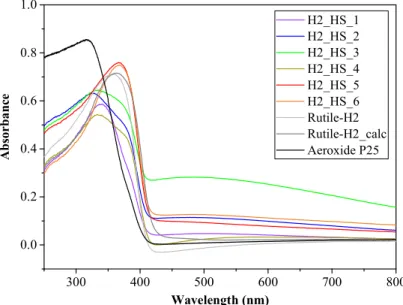
The light absorption of the TiO2-s was determined by diffuse reflectance spectroscopy (DRS). As it can be seen in Figure9, the TiO2HSs possess greater light absorption in the visible light region compared to reference Rutile-H2 and Aeroxide P25. The band gap energies determined from the derivative DR spectra were 3.14, 3.14, 3.15, 3.13, 3.13, and 3.13 eV for H2_HS_1-6 photocatalysts, and 3.11, 3.09, and 3.11 eV for Rutile-H2, Rutile-H2_calc, and Aeroxide P25, respectively. Based on the DRS results, samples H2_HS_1–6 possess very similar values, thus possible differences in their photocatalytic activity presumably will not be attributable to their band gaps. Surface properties of TiO2HSs were characterized by FT-IR spectroscopy (Figure10). In the FT-IR, a spectrum with a broad band centered at 3400 cm−1with a sharp band at 1630 cm−1was observed, which can be associated with the stretching and bending vibrations of the surface OH groups [58,59]; moreover, the bands around 480 and 540 cm−1correspond to Ti–O bond [56]. The shape of these latter bands in this region varied in accordance with the different crystal phases; anatase had less defined Ti–O stretch band as it possesses less ordered structure (compared to rutile); consequently, in the case of mixed crystal phases, the infrared absorption bands also represented this transmission between the two crystal phases [60].
Materials 2019, 12, x FOR PEER REVIEW 11 of 21
The light absorption of the TiO2-s was determined by diffuse reflectance spectroscopy (DRS). As it can be seen in Figure 9, the TiO2 HSs possess greater light absorption in the visible light region compared to reference Rutile-H2 and Aeroxide P25. The band gap energies determined from the derivative DR spectra were 3.14, 3.14, 3.15, 3.13, 3.13, and 3.13 eV for H2_HS_1-6 photocatalysts, and 3.11, 3.09, and 3.11 eV for Rutile-H2, Rutile-H2_calc, and Aeroxide P25, respectively. Based on the DRS results, samples H2_HS_1–6 possess very similar values, thus possible differences in their photocatalytic activity presumably will not be attributable to their band gaps. Surface properties of TiO2 HSs were characterized by FT-IR spectroscopy (Figure 10). In the FT-IR, a spectrum with a broad band centered at 3400 cm−1 with a sharp band at 1630 cm−1 was observed, which can be associated with the stretching and bending vibrations of the surface OH groups [58,59]; moreover, the bands around 480 and 540 cm−1 correspond to Ti–O bond [56]. The shape of these latter bands in this region varied in accordance with the different crystal phases; anatase had less defined Ti–O stretch band as it possesses less ordered structure (compared to rutile); consequently, in the case of mixed crystal phases, the infrared absorption bands also represented this transmission between the two crystal phases [60].
Figure 9. Diffuse reflectance (DR) spectra of the investigated TiO2-s.
Figure 10. IR spectra of the investigated TiO2-s.
300 400 500 600 700 800
0.0 0.2 0.4 0.6 0.8 1.0
Absorbance
Wavelength (nm)
H2_HS_1 H2_HS_2 H2_HS_3 H2_HS_4 H2_HS_5 H2_HS_6 Rutile-H2 Rutile-H2_calc Aeroxide P25
4000 3500 3000 1500 1000 500
Rutile-H2_calc
H2_HS_6 H2_HS_5 H2_HS_4 H2_HS_3 H2_HS_2
Absorbance (a.u.)
Wavenumber (cm ) H2_HS_1
Ti-O
surf. -OH ads. H 2O
Wavenumber (cm-1)
Figure 9.Diffuse reflectance (DR) spectra of the investigated TiO2-s.
Materials 2019, 12, x FOR PEER REVIEW 11 of 21
The light absorption of the TiO2-s was determined by diffuse reflectance spectroscopy (DRS). As it can be seen in Figure 9, the TiO2 HSs possess greater light absorption in the visible light region compared to reference Rutile-H2 and Aeroxide P25. The band gap energies determined from the derivative DR spectra were 3.14, 3.14, 3.15, 3.13, 3.13, and 3.13 eV for H2_HS_1-6 photocatalysts, and 3.11, 3.09, and 3.11 eV for Rutile-H2, Rutile-H2_calc, and Aeroxide P25, respectively. Based on the DRS results, samples H2_HS_1–6 possess very similar values, thus possible differences in their photocatalytic activity presumably will not be attributable to their band gaps. Surface properties of TiO2 HSs were characterized by FT-IR spectroscopy (Figure 10). In the FT-IR, a spectrum with a broad band centered at 3400 cm−1 with a sharp band at 1630 cm−1 was observed, which can be associated with the stretching and bending vibrations of the surface OH groups [58,59]; moreover, the bands around 480 and 540 cm−1 correspond to Ti–O bond [56]. The shape of these latter bands in this region varied in accordance with the different crystal phases; anatase had less defined Ti–O stretch band as it possesses less ordered structure (compared to rutile); consequently, in the case of mixed crystal phases, the infrared absorption bands also represented this transmission between the two crystal phases [60].
Figure 9. Diffuse reflectance (DR) spectra of the investigated TiO2-s.
Figure 10. IR spectra of the investigated TiO2-s.
300 400 500 600 700 800
0.0 0.2 0.4 0.6 0.8 1.0
Absorbance
Wavelength (nm)
H2_HS_1 H2_HS_2 H2_HS_3 H2_HS_4 H2_HS_5 H2_HS_6 Rutile-H2 Rutile-H2_calc Aeroxide P25
4000 3500 3000 1500 1000 500
Rutile-H2_calc
H2_HS_6 H2_HS_5 H2_HS_4 H2_HS_3 H2_HS_2
Absorbance (a.u.)
Wavenumber (cm ) H2_HS_1
Ti-O
surf. -OH ads. H 2O
Wavenumber (cm-1)
Figure 10.IR spectra of the investigated TiO2-s.
![Figure 1. Possible intermediates of phenol during its photocatalytic oxidation [46–48]](https://thumb-eu.123doks.com/thumbv2/9dokorg/1078928.72664/5.892.243.647.562.978/figure-possible-intermediates-phenol-photocatalytic-oxidation.webp)