1
THESES OF DOCTORAL (PhD) DISSERTATION
Vántus Viola
UNIVERSITY OF KAPOSVAR
FACULTY OF AGRICULTURAL AND ENVIRONMENTAL SCIENCES
2018
2
UNIVERSITY OF KAPOSVAR
FACULTY OF AGRICULTURAL AND ENVIRONMENTAL SCIENCES
Head of PhD School
Prof. Dr. KOVÁCS MELINDA
the correspondent member of the Hungarian Academy of Sciences
Supervisor
Dr. ZSOLNAI ATTILA scientific advisor
EXAMINATION THE INTERACTION BETWEEN THE RABBIT CAECAL MICROBIOTA AND T-2-, FUMONISIN
B1-MYCOTOXINS, AND THE ROLE OF CERTAIN PRE- AND PROBIOTICS, WITH MOLECULAR GENOMIC
METHOD Made by
VÁNTUS VIOLA
DOI: 10.17166/KE2019.005
KAPOSVÁR
3 1. Background of the research
The rabbit (Oryctolagus cuniculus) is an economically important and significant meat-producing farm animal, which has also become essential as a major laboratory model in several fields such as digestive physiology or toxicology by the present day.
Rabbit meat prodution can play a significant role in solving the probleam of meat shortage in many regions of the world, particularly because of their high potential for reproduction, rapid growth rate, short generation interval, abundant nutritional spectrum, limited living space and simply rearing. However (pre- and post-weaning) mortality until marketing limits the quantity of meat to be sold, therefore a lower income would be obtained (Rashwan and Marai, 2000). Rabbit production is currently concerned by digestive pathologies which are mostly encountered around weaning, leading to high morbidity and mortality (Bennegadi et al. 2003). Pre- and post-weaning periods are particularly important to establish resistance to digestive disorders in young rabbits and infectious digestive disorders account for a high incidence of mortality after weaning (Marlier et al. 2003).
Rabbits are hindgut fermenters; the digestive tract is adapted to process large amounts of fibre-rich feed by microbial fermentation which takes place in the caecum (Harcourt-Brown 2004). Composition and activity of caecal
4
microbiota have a strong influence on health, because of their role in nutrition, pathogenesis and immune function (Gibson & Roberfroid 1995).
Caecotrophy is a very characteristic feature of this species that promotes the complete digestion of feed components, facilitates the assimilation of proteins and other nutrients synthesised by the caecal ecosystem, and maintains the microbial populations.
The gastrointestinal health of domestic rabbits greatly depends on the balance of the normal microbiota. Any disruption of the digestive process, mostly related to diet or stress, results in intestinal diseases.
Although preventive medication with antibiotics (given under veterinary prescription) helps to control the weaning period, there is an urgent need to find alternatives to maintain health with a reduced use of drugs (Gidenne et al. 2012). As alternative to antibiotics several studies have been carried out on rabbits testing different feed additives (e.g. herbal extracts, pro- and prebiotics) because of their growth-promoting effects (Dalle Zotte et al.
2016).
To extension the knowledge of this area aimed to evaluate the effect of the two natural feed additives: spirulina (Arthrospira platensis) and thyme (Thymus vulgaris L.) on the caecal microbiota in rabbit using molecular genomic methods like qPCR.
5
The caecum is colonised by microbiota forming bacteria to protect against pathogens (binding sites on the coverage) and to facilitate gut development (mucosal histology, immune system) in early period of milk feeding. So the existence of normal microbiota in the gastrointestinal tract (GIT, gastrointestina) is an essential component of health. The lymphoid tissue is the place of interaction between the gut bacteria and the immune system;
especially the gut-associated lymphoid tissue (GALT) and mucosa-associated lymphoid tissue (MALT).
Mycotoxins are a type of toxic secondary metabolites of moulds, which may persist in feed. Mycotoxin contamination can occur in all agricultural products under conditions favouring fungal growth.
Toxic substances eg. a significant proportion of mycotoxins in feed are entering into the body by the gastrointestinal tract. The role of GIT is dual: it is the main site for nutrition and absorption and itis the barrier between the external and internal environment (homeostasis protection). GIT is the first line of defense after contact with toxin contamined food, which cause high degree of toxic load for the GIT . The absorption of the mycotoxins into the body is therefore carried out in the GIT, thereby affecting the absorption of other substances and altering the functioning of GALT. Microorganisms forming the ecosystem of GIT can convert mycotoxins so they can be excreted by the bile in the unchanged or metabolized form.
6
Our knowledge of the effects of mycotoxins on the gut and the composition and functioning of the GIT microbial is incomplete. For the purpose of exploring these context and effect mechanisms I examined (in vitro and in vivo) the effect of mycotoxins present in food chain: how certain mycotoxins influence the composition and function of the intestinal microbiota. In this context I also examined if probiotics and prebiotics used as feed supplements provide preventive effects, by promoting eubiosis in the rabbit in case of prolonged toxic exposure. My studies of Fusarium toxins include T-2 toxin and fumonisin B1 (FB1), given that these are very common mycotoxins in Hungary with serious animal and human health effects.
The gastrointestinal microbiota is made up hundreds of bacteria. Since only 24 to 40% of the species can be cultured in vitro (Tannock et al., 2000), molecular microbiology techniques are now used to provide more sensitive and accurate parameters for biodiversity and stability (Takahiro et al.,2003). The comparison between data acquired from molecular procedures and classical methods is problematic. By using molecular techniques – most of it based on 16S rRNA gene analysis - the determined microbe number is ten times greater than it is obtained by culturing procedure (Carabano et al.,2006).
As a result of the development of these results and methods a new field of research has emerged and is called a "molecular microbial ecology". This will allow the fullest possible description and monitoring of the microbial
7
ecosystems that populate the GIT. In my in vivo and in vitro experiments I studied the effects of two different feed additives (pre and probiotics) and mycotoxins on the caecal microbiota using the molecular genomic method (qPCR).
The objectives of the dissertation
During the experimnets I sought the answer to the following questions:
1. Could the spirulina (Arthrospira platensis) and the thyme be (Thymus vulgaris L.), effectively applied as an alternative to the preventive and/or growth promoting use of antibiotics; and what is the effect of these natural feed additives on the caecal microbiota of young rabbits?
2. Do probiotics (Bacillus cereus var. Toyoi spores) and prebiotics (mannan oligosaccharide) used as feed supplements provide preventive effects by promoting eubiosis in the rabbit in case of prolonged toxic exposure?
3. How do the T–2- and fumonisine B1-mycotoxins affect the composition and function of the rabbit caecal microbiota in vivo, and in vitro?
8 2. Materials and methods
Experiments were conducted Pannon White breed (bred in University of Kaposvár) rabbits. After weaning (35 days of age, 952±81 g body weight) rabbits were housed in wire-mesh cages (3 rabbits/cage; size of a cage: 61 x 32 x 30 cm, length x width x height). The temperature and the photoperiod were 15-18 °C and 16L:8D, respectively. From 21 days of age all rabbits were fed ad libitum with 170-176 g/kg crude protein and 10.14 MJ energy/kg DE content basal diet containing 10% starch, 5% soluble fibre and 22.6% acid detergent fibre without any anticoccidials or any other medication.
2.1 Effects of spirulina and/or thyme supplementations on caecal microbiota
After weaning rabbits were randomly sorted to 4 dietary groups (n=42).
C: basal diet (control)
S: basal diet + 5% spirulina (Arthrospira platensis) T: basal diet + 3% thyme (Thymus vulgaris L.) ST: basal diet + 5% spirulina + 3% thyme
9
Fodder supplementation with spirulina and/or thyme (purchsased from commercial source in Italy) was performed in treated groups at 5 to 11 weeks of age.
At 49, 63 and 77 days of age (sampling times: 1, 2, 3) 6 healthy animals from each experimental group were randomly selected and slaughtered at 02:00 p.m. The digestive tract was removed and caecum was separated.
Approximately 1.5 grams of fresh caecal content were placed into sterile Eppendorf tubes from each animal, thereafter frozen and stored at -80 °C until performing analyses of bacterial community.
After preparation of the samples (recovery of the bacterial DNA content in pure form), the total bacterial content, Bacteroides, Clostridium leptum and Clostridium coccoides were quantitated by quantitative real time PCR (qPCR) using MxPro 3000P qPCR (Agilent Technologies, Santa Clara , California).
The research protocol was reviewed by the Animal Use and Care Administrative Advisory Committee and approved by the Agricultural Administrative Authority (Protocol No. 23.1/02322/006/2008).
10
2.2 Effect of T-2 mycotoxin on intestinal microbiota, investigation of plausible guarding effects of pro- and prebiotics.
Suckling rabbits (n=180) were randomly sorted to the following dietary groups:
K: basal diet (control) Pro: basal diet + probiotic Pre: basal diet + prebiotic
Propre: basal diet + pro- and prebiotic
The rabbits began to consume the experimental diets before weaning - by commencing the first solid feed intake - until 11 weeks of age. Te probiotic used were Bacillus cereus var. toyoi spores (Toyocerin, Asahi Vet. S.A., Barcelona, Spain) at concentration 0.2% (2x10⁵/g), The prebiotic was 2%
mannan-oligoszaccharide (MOS) (Bio-Mos, Alltech Hungary, Budapest). The weaning was made at 35 days of age. At weaning (1st sampling point) and at 10-week-old (2nd sampling point), 6-6 rabbit/groups were examined (for total 24-24 animal). Between 8th and 10th weeks 6-6 rabbits/groups (K, Pro, Pre, Propre) were fed with 2 mg/kg of T-2-toxin supplemented diet.
11
The mycotoxin-supplemented diet groups:
K_M basal diet + T–2
Pro_M basal diet + probiotic +T–2 Pre_M basal diet + prebiotic + T–2
Propre_M basal diet + pro- és prebiotic + T–2
Mycotoxin-supplemented groups were also slaughtered and tested (6 animals/group, total 24 animals) after 3 weeks of toxin supplementation, n.b.
11 weeks of age.
T-2 toxin was experimentally prepared using Fusarium sporotrichioides NRRL 3299 strain on maize germ (Fodor et al., 2006). The fungal culture was mixed with the basic feed of the experimental animals so that contaminated feeds contained 2 mg/kg T-2 toxin. The mycotoxin concentration of control and experimental feed was determined by LC-MS (Shimadzu, Kyoto, Japan). T-2 detection limit (LOD) was 10 ng/kg. Control diet did not contain detectable amounts of T-2, and none of the diets contained detectable amounts of deoxynivalenol and zearalenone.
The digestive tract was removed and caecum was separated. From each animal approximately 1.5 grams of fresh caecal content were placed into sterile Eppendorf tubes, thereafter frozen and stored at -80 °C until analyses of bacterial community. After preparation of the samples (recovery of the
12
bacterial DNA content in pure form) the bacterial contents were quantitated by quantitative real time PCR (qPCR) using MxPro 3000P qPCR (Agilent Technologies, Santa Clara , California).
The research protocol was reviewed by the Animal Use and Care Administrative Advisory Committee and approved by the Agricultural Administrative Authority (Protocol No. SOI/31/254-3/2013).
2.3 Effects of Fumonisin B1 mycotoxin and/or Mannan- oligosaccharide supplements on rabbit caecal microbiota
Our method was based on Fodor et al. (2007) to determine the microbial metabolism of fumonisin B1. Caecal content originated from 42 days old freshly slaughtered animals (n = 3), which were previously fed according to De Blas and Mateos (2010). After homogenisation 3.33 g caecal content (ca.
30% dry matter content) per test tube was pre-incubated (24 h, 37 °C, under anaerobic conditions), suspended in 6.67 ml McDougall buffer solution (9.8 g NaHCO3, 9.3 g Na2HPO4 × 12H2O, 0.57 g KCl, 0.47 g NaCl, 0.12 g MgSO4 × 7H2O, 0.04 g CaCl2 and 1000 ml distilled water; pH 8.3) (10% suspension).
After a further 4 hour preincubation period (37 ° C, anaerobic conditions), the test substances were added to the contents of each test tube forming the following groups in the experimental compilation:
13
(1) control (caecal content + McDougall buffer)
(2) toxin treatment (caecal content + McDougall buffer + FB1) (3) MOS treatment (caecal content + McDougall buffer + MOS)
(4) combined treatment (caecal content + McDougall buffer + FB1 + MOS).
The dosage of FB1 (F1147; Sigma Aldrich, Germany) (Groups 2 and 4) was 0.05 mg/3.33g of caecal content, while the concentration of MOS (Alltech Hungary Kft. Budapest, Hungary) (Groups 3 and 4) was 10 mg/3.33 g of caecal content. After homogenization the tubes were again placed in an anaerobic incubator. Prior to incubation (1st sampling, absolute control) and after incubation time of 12, 24 and 36 hours (2nd, 3rd and 4th sampling) 1.5 g (n = 4) of mixture was placed in sterile Eppendorf tubes and stored at -80 ° C until DNA extraction. After preparation of the samples (recovery of the bacterial DNA content in pure form) the total bacterial content, E.coli and Bacteroides were quantitated by quantitative real time PCR (qPCR) using MxPro 3000P qPCR (Agilent Technologies, Santa Clara , California).
2.4 Quantitative PCR
After bacterial DNA extraction from the samples the quantity of total bacteria and bacteria belonging to different phyls (Firmicutes, Bacteroidetes, Actinobacteria) and E. coli (Proteobacteria) was determined by quantitative
14
PCR with a Stratagene Mx 3000P QPCR apparatus (Agilent Technologies, Santa Clara, California) applying bacterial target-specific primers and SYBR® Green. The selection of the investigated bacterial groups was based on their role in digestion or in gastrointestinal diseases. Primer selection was based on literature.
The next step in each experiment was to amplify the target sequence of the selected bacteria using the MxPro 3000P qPCR (Agilent Technologies, Santa Clara, CA) located at the Molecular Biology Laboratory of the University of Kaposvár.
Cloning of amplified PCR products in plasmid was carried out at the Experimental Medical Research Institute (Budapest). After concentration determination of plasmid solutions I prepared a dilution series from the solutions. I calculated the bacterial load of the sample from the calibration lines obtained from the dilution series of plasmids containing PCR products at known concentrations.
Accumulation of PCR product was monitored by SYBR® Green dye in PCR Master Mix (Brillant II SYBR® QPCR Low Rox Master Mix, Agilent Technologies, Santa Clara, CA). SYBR® Green is an intercalating molecule that binds to double-stranded (ds) DNA. In intercalated form its fluorescence intensity is approx. 2000 times higher than that of the naked double-stranded DNA. Its excitation maximum is 494 nm with an emission maximum of 521
15
nm, the intensity proportionally increases with the increasing amount of multiplicating dsDNA in PCR. In Real-Time PCR the detection of SYBR® Green fluorescence is performed at the end of each chain extension steps.
The qPCR was carried out in a 25 μl/tube reaction mixture containing 12.5 μl Brilliant II SYBR QPCR Low ROX Master Mix (Agilent Technologies, Santa Clara, California), 0.2 μM of each primer, 10.5 μl sterile DEPC-treated distilled water and 1 μl of DNA extract. The reaction master mix was manually compiled. Triplicate reactions for all samples were set up by QIAgility HEPA/UV workstation (for automated PCR setup, with UV light and HEPA filter) to reduce manual error among triplicates.
The PCR program consisted of 10 min at 95 °C, 40 cycles with 30 sec at 95 °C, 1 min at 60 °C. Specificity of the PCR reactions was checked by melting point analysis. Ct values of the samples served as the basis for monitoring the changes in the bacterial community. Plasmids were diluted to prepare the standard curve. The conversion of plasmid concentration to copy number was based on Lee at al.’s work (2006). The obtained copy numbers of the samples were normalised to one gram of incubation mix. Subsequently, data from the experiment were statistical evaluated.
16 2.5 Statistical analysis
The qPCR dataset was analysed with the General Linear Model (GLM) procedure of the SPSS program (version 20) to determine differences between the amounts of the investigated bacterial groups, where the sampling points (e.g. 0, 1, 2 and 3) and treatments (e.g. C, MOS, FB1 and MOS+FB1) were included as fixed effects and the bacterial copy numbers as dependent variable.
The formula of GLM included the following:
yij = μ + sampling pointi + treatment + sampling pointi × treatmentj + eij
where y is the copy number of the investigated bacteria (e.g.
Bacteroides) and μ is the general mean, sampling points is the sampling time of the caecal-content (e.g. 1, 2, 3, 4). Treatment/diet indicates the impact of the supplements (e.g. control, MOS, FB1, MOS+FB1) and e is the residual error. The significance of differences was tested by LSD post hoc test.
17 3. Results and evaluation
3.5 Effects of spirulina and/or thyme supplementation on the caecal bacterial community
According to my results, the copy number of the examined groups are the follows:
- Total bacteria 2.75x10¹² - 2.24x10¹³ - C. leptum 5.25x10¹¹ - 1.82x10¹² - Bacteroides 5.89x10¹⁰ - 1.10x10¹². - C. coccoides 2.5x10¹⁰ - 6.91x10¹¹
Clostridium leptum was the highest in the total bacterial content followed by the genus Bacteroides followed by Clostridium coccoides.
Quantitative data of the examined bacterial groups are given in Table 1-4, data shown according the supplemented feed and sampling time.
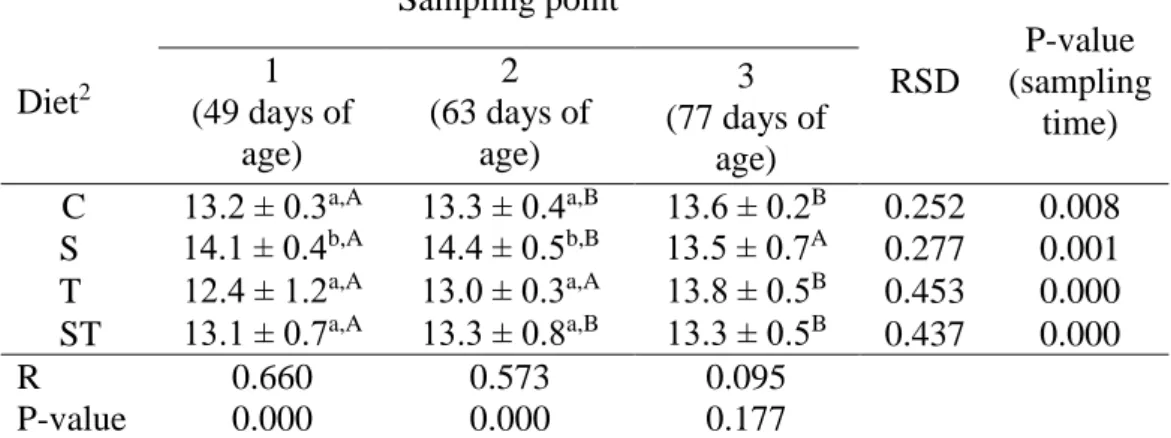
Spirulina (S) supplementation (5%) resulted in significantly higher total bacterial content (Table 1) compared to control group (C) at 49 and 63 days, but at sampling 3 (77 days) I did not find any treatment effect. Combined treatment (ST) and thyme alone (T) did not affect the total bacterial content.
18
Table 1. Quantitative change in total bacterial content1 of rabbit caecal sample by sampling time and feed supplement (n=72)
1 Results are expressed as the mean of the log10 value ± SEM calculated of targeted bacteria copy number in 1 gram of caecal sample
2 Abbreviations mean – control (C), spirulina (S), thyme (T), spirulina and thyme (ST)
a,b,c Values within a column in the same sampling time, with different superscripts differ significantly at P<0.05
A,B,C Values within a row in the same diet, with different superscripts differ significantly at P<0.05
The amount of Bacteroides (Table 2) temporary increased in the spirulina-treated group (S), at 63 days of age it was significantly greater than in the control (C) group. Thyme treatment (T) resulted less Bacteroides at the first sampling, but at the third sampling it has higher copy number, than in the control group. The combined treatment (ST) at the end of the experiment resulted higher Bacteroides amount compared to the C and S groups.
Diet2
Sampling point
RSD
P-value (sampling
time) 1
(49 days of age)
2 (63 days of
age)
3 (77 days of
age)
C 13.2 ± 0.3a,A 13.3 ± 0.4a,B 13.6 ± 0.2B 0.252 0.008 S 14.1 ± 0.4b,A 14.4 ± 0.5b,B 13.5 ± 0.7A 0.277 0.001 T 12.4 ± 1.2a,A 13.0 ± 0.3a,A 13.8 ± 0.5B 0.453 0.000 ST 13.1 ± 0.7a,A 13.3 ± 0.8a,B 13.3 ± 0.5B 0.437 0.000 R
Squared
0.660 0.573 0.095
P-value (diet)
0.000 0.000 0.177
19
Table 2. Quantitative change in total Bacteroides content1 of rabbit caecal sample by sampling time and feed supplement (n=72)
1 Results are expressed as the mean of the log 10 value ± SEM calculated of targeted bacteria copy number in 1 gram of caecal sample
2 Abbreviations mean – control (C), spirulina (S), thyme (T), spirulina and thyme (ST)
a,b,c Values within a column in the same sampling time, with different superscripts differ significantly at P<0.05
A,B,C Values within a row in the same diet, with different superscripts differ significantly at P<0.05
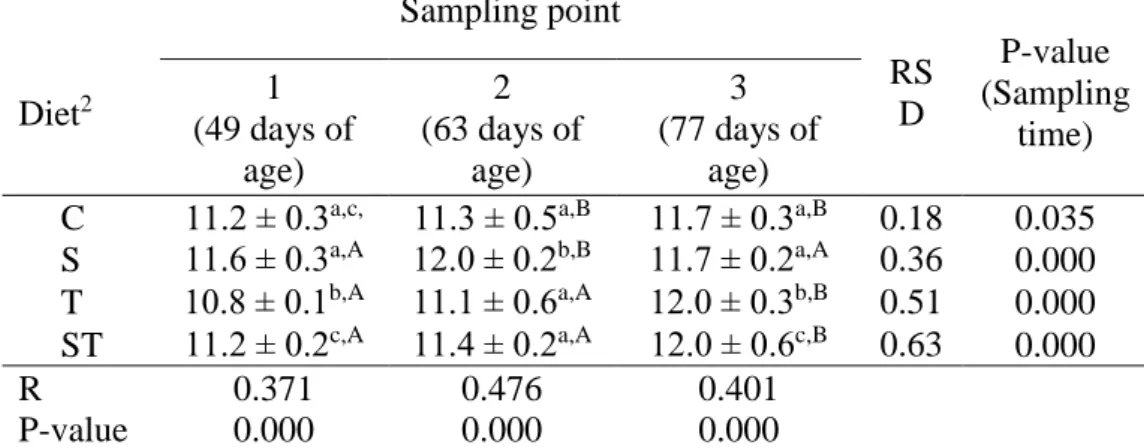
Thyme alone (T) and combined with spirulina (ST) reduced the amount of Firmicutes (Clostridium leptum and Clostridium coccoides) on days 49 and 63 compared to control (C) (Table 3-4). While the addition of spirulina (S) exhibited its antimicrobial effect at 63 and 77 days of age. During the whole experiment, less C. coccoides was present than C. leptum in the caecal content (the difference was 14% on average).
Diet2
Sampling point
RS D
P-value (Sampling
time) 1
(49 days of age)
2 (63 days of
age)
3 (77 days of
age) C 11.2 ± 0.3a,c,
A
11.3 ± 0.5a,B 11.7 ± 0.3a,B 0.18 5
0.035 S 11.6 ± 0.3a,A 12.0 ± 0.2b,B 11.7 ± 0.2a,A 0.36
4
0.000 T 10.8 ± 0.1b,A 11.1 ± 0.6a,A 12.0 ± 0.3b,B 0.51
1
0.000 ST 11.2 ± 0.2c,A 11.4 ± 0.2a,A 12.0 ± 0.6c,B 0.63
4
0.000 R
Squared
0.371 0.476 0.401
P-value (diet)
0.000 0.000 0.000
20
Table 3. Quantitative change in total Clostridium leptum content1 of rabbit caecal sample by sampling time and feed supplement (n=72)
1 Results are expressed as the mean of the log 10 value ± SEM calculated of targeted bacteria copy number in 1 gram of caecal sample
2 Abbreviations mean – control (C), spirulina (S), thyme (T), spirulina and thyme (ST)
a,b,c Values within a column in the same sampling time, with different superscripts differ significantly at P<0.05
A,B,C Values within a row in the same diet, with different superscripts differ significantly at P<0.05
Table 4. Quantitative change in total Clostridium coccoides content1 of rabbit caecal sample by sampling time and feed supplement (n=72)
1 Results are expressed as the mean of the log 10 value ± SEM calculated of targeted bacteria copy number in 1 gram of caecal sample
2 Abbreviations mean – control (C), spirulina (S), thyme (T), spirulina and thyme (ST)
a,b,c Values within a column in the same sampling time, with different superscripts differ significantly at P<0.05
A,B,C Values within a row in the same diet, with different superscripts differ significantly at P<0.05
Diet2
Sampling point
RSD
P-value (Sampling
time) 1
(49 days of age)
2 (63 days of
age)
3 (77 days of
age)
C 12.1 ± 0.3a 12.1 ± 0.3a 12.1 ± 0.3a 0.010 0.845 S 12.1 ± 0.2a,A 11.9 ± 0.3b,B 11.8 ± 0.2b,A 0.296 0.001 T 11.7 ± 0.2b,A 11.7 ± 0.2b,A 12.3 ± 0.2a,B 0.605 0.000 ST 11.7 ± 0.2b,A 11.8 ± 0.1b,A 12.2 ± 0.2a,B 0.509 0.000 R
Squared
0.371 0.267 0.344
P-value (diet)
0.000 0.003 0.000
Diet2
Sampling point
RS D
P-value (Sampli
ng time) 1
(49 days of age)
2 (63 days of
age)
3 (77 days of
age)
C 11.3 ± 0.3a,A 11.5 ± 0.4a,A 11.8 ± 0.4a,B 0.25 8
0.007 S 11.3 ± 0.3a,A 10.7 ± 0.4b,B 10.5 ± 0.2b,B 0.59
3
0.000 T 10.4 ± 0.2b,A 10.6 ± 0.3b,A 11.1 ± 0.2b,B 0.50
7
0.000 ST 10.4 ± 0.2b,A 10.6 ± 0.1b,A 11.0 ± 0.2b,B 0.55
5
0.000 R
Squared
0.544 .0
0.437 0.507
P-value (diet)
0.000 0.000 0.000
21
During the sampling period the total bacterial content of the cecum was slightly increased (C, T and ST) or did not change (S) during the experiment.
The copy number of the Bacteroides and the Firmicutes increased by the time except for the S group where they remained unchanged and decreased on the 63rd day.
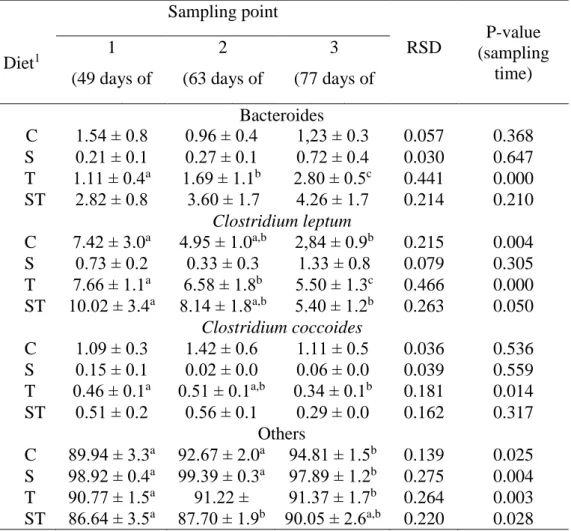
Table 5 shows the ratio of the bacterial groups compared to the total bacterial content. The amount of bacteria tested ranged from 0.6 to 13.4% of the total bacterial content, the highest (1-7.4%) in the control, and the lowest (0.02-1.33%) in the spirulina group was present. Changes over time (age) can be observed in particular of C. leptum ratio, which reduced by one third (from 7.42 to 2.84 %) in the control and in the combined treated group (ST). As a result of the thyme supplementation, the ratio of C. leptum and C. coccoides also decreased
22
Table 5. Distribution of studied bacterial groups expressed as % of total bacteria related to diet and sampling time (n=288)
1 Abbreviations mean – control (C), spirulina (S), thyme (T), spirulina and thyme (ST)
a,b,c Values within a row in the same diet, with different superscripts differ significantly at P<0.05
Diet1
Sampling point
RSD P-value (sampling
time) 1
(49 days of age)
2 (63 days of
age)
3 (77 days of Bacteroides age)
C 1.54 ± 0.8 0.96 ± 0.4 1,23 ± 0.3 0.057 0.368 S 0.21 ± 0.1 0.27 ± 0.1 0.72 ± 0.4 0.030 0.647 T 1.11 ± 0.4a 1.69 ± 1.1b 2.80 ± 0.5c 0.441 0.000 ST 2.82 ± 0.8 3.60 ± 1.7 4.26 ± 1.7 0.214 0.210
Clostridium leptum C 7.42 ± 3.0a 4.95 ± 1.0a,b 2,84 ± 0.9b
2,84.12 ± 1
0.215 0.004 S 0.73 ± 0.2 0.33 ± 0.3 1.33 ± 0.8 0.079 0.305 T 7.66 ± 1.1a 6.58 ± 1.8b 5.50 ± 1.3c 0.466 0.000 ST 10.02 ± 3.4a 8.14 ± 1.8a,b 5.40 ± 1.2b 0.263 0.050
Clostridium coccoides
C 1.09 ± 0.3 1.42 ± 0.6 1.11 ± 0.5 0.036 0.536 S 0.15 ± 0.1 0.02 ± 0.0 0.06 ± 0.0 0.039 0.559 T 0.46 ± 0.1a 0.51 ± 0.1a,b 0.34 ± 0.1b 0.181 0.014 ST 0.51 ± 0.2 0.56 ± 0.1 0.29 ± 0.0 0.162 0.317
Others
C 89.94 ± 3.3a 92.67 ± 2.0a 94.81 ± 1.5b 0.139 0.025 S 98.92 ± 0.4a 99.39 ± 0.3a 97.89 ± 1.2b 0.275 0.004 T 90.77 ± 1.5a 91.22 ±
1.4a,b
91.37 ± 1.7b 0.264 0.003 ST 86.64 ± 3.5a 87.70 ± 1.9b 90.05 ± 2.6a,b 0.220 0.028
23 3.5.1 Evaluating results
The use of spirulina and/or thyme supplements influenced the amount of the copy number of the bacteria examined between 49 and 77 days of age.
On the other hand their effect on the total bacteria number was only temporary (see spirulina supplementation on day 63) and no difference attributed to the supplementation compared to the control animals was detected on day 77.
There were more bacteria (total bacteria number) at 77 compared to 49 days of age, except in group S, where no increase was observed. The amount of bacterial community in the rabbit's caecum and colon is 12.1 ± 0.05 log10
copies/g of caecal content at 49-88 days of age, according to Michelland et al.
(2011). In my experiment, I found a higher bacterial content: 13.2 ± 0.3 to 13.6 ± 0.2 log10 copies/g caecal content (between day 49 and 77).
The development of the rabbit caecal microbiota after birth has been thoroughly studied using 16S rRNA gene approaches coupled with capillary electrophoresis single-stranded conformation polymorphism (CE-SSCP) and qPCR by Combes et al. (2011). According to their results the total bacteria copy number increased with age, the Bacteroides-Prevotella copy number also increased from 14 to 21 days of age, whereas it decreased between 35 and 70 days of age. Firmicutes groups established from the second week after birth and remained stable thereafter (the copy number did not change between 14 and 70 days of age). The amount of total bacteria and Bacteroides was less in
24
their investigation when compared to our results, likely due to the different hybrids used, the rabbit nutrition and management and the different oligonucleotide sequences used for PCR.
The composition of the caecal microbiota in young rabbits is highly variable between individuals up to 49 days of age, whereas it becomes homogenous by 70 days of age (Combes et al. 2011). According to this statement after 49 days of age it is less possible to modify the microbiota, through nutritional factors.
In my experiment, the use of spirulina and/or thyme supplements influenced the amount of the copy number of the individual bacteria examined between 49 and 77 days of age. On the other hand their effect on the total bacteria number was only temporary (see spirulina supplementation on day 63) and there was no difference compared to the control animals at day 77. There were more bacteria (total bacteria number) at day 77 compared to 49 days of age, except in group S, where no increase was observed.
In my experiment dietary inclusion of spirulina resulted in more Bacteroides on day 63 but significantly lower amount of Clostridia at 63 and at 77 days of age. Investigating the ratio of the examined bacterial groups within total bacteria, we can conclude that spirulina increased the ratio of the Bacteroides, C. leptum and C. coccoides as time went by, while the other three treatments led to the increase of the ratio of another, not identified bacteria.
25
The antimicrobial effect of thyme on the absolute Clostridia number was only temporary, prevailing on day 63. On the other hand thyme resulted in significantly decreasing percentage ratio (within total bacteria) of C. leptum and C. coccoides by 77 days of age. Results are in accordance with previous data; thyme (due to its volatile oils) exerts antimicrobial effects. Dorman &
Deans (2000) demonstrated that among many volatile oils tested, the oil (thymol) of Thymus vulgaris was found to have the widest antibacterial spectrum. Thymol has a phenolic structure and exerted greater inhibitory activity against Gram-positive bacteria, Clostridia included.
Overall it can be said that spirulina and thyme -separately or combined- in diets affected the composition of the caecal microbiota in weaned rabbits between 35 and 77 days of age. They affected the absolute number of total bacteria, Bacteroides, C. leptum and C. coccoides, and also the ratio of the mentioned bacteria within the total bacterial community. Spirulina dietary supplementation temporary increased the amount of total bacteria and Bacteroides, while resulted in less Clostridia. Thyme exerted its antimicrobial effect on Clostridia only till 63 days of age.
26
3.6 Effect of T-2 mycotoxin on intestinal microbiota, investigation of plausible guarding effects of pro- and prebiotics
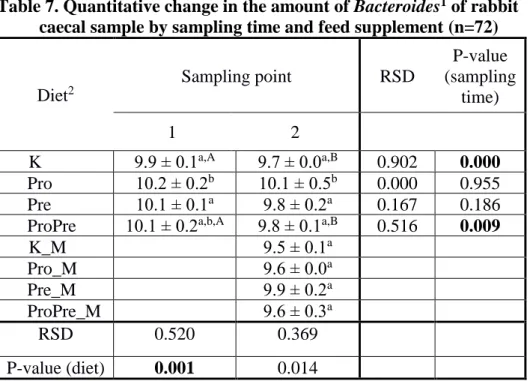
As a probiotic, Bacillus cereus var. Toyoi spores significantly increased the amount of Bacteroides (Table 7) and E. coli (Table 11), the total bacterial content decreased (Table 6) while the number of other bacterial groups under study did not change significantly.
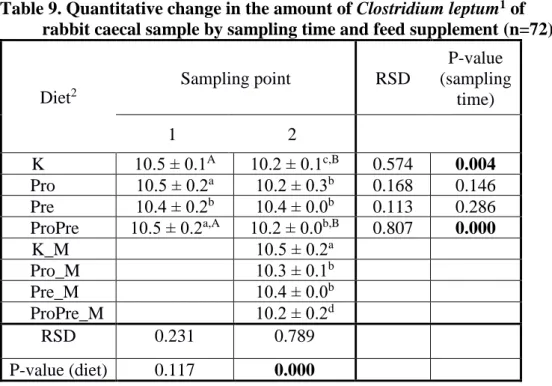
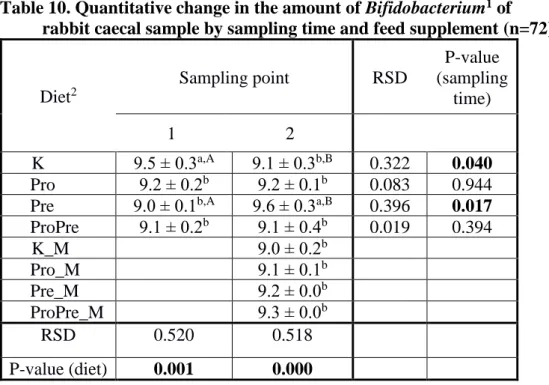
As a prebiotic, mannose oligosaccharide (MOS) caused significantly higher values of Clostridium leptum and Bifidobacterium copy numbers at the second sampling time (Tables 9 and 10) relative to the control group; for these bacterial groups the favorable prebiotic effect was confirmed.
In the case when I applied together the mannan-oligosaccharide (MOS) and the Bacillus cereus var. toyoi spores, I did not notice a significant, lasting change in the number of bacterial groups.
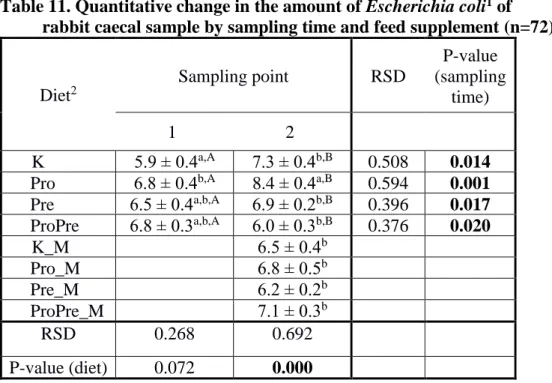
T-2 mycotoxin mixed with feed significantly reduced the amount of E.
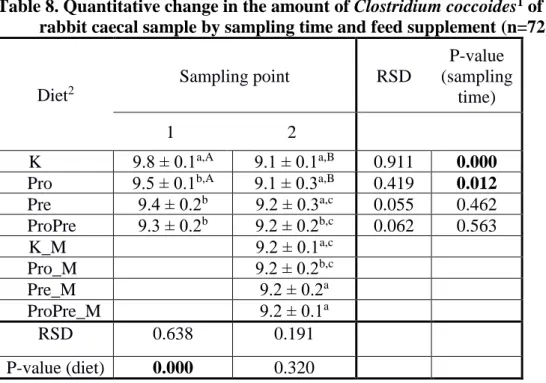
coli by 86.4% (Table 11). It had no significant effect on the total bacterial content (Table 6) and on the amount of Bacteroides, Clostridium coccoides, Clostridium leptum and Bifidobacterium groups (Tables 7, 8, 9, 10).
The total bacterial count was significantly higher in the diet-group consuming prebiotics and pre- and probiotics besides T-2 (Table 6) compared to the diet-group fed by mycotoxin contaminated (artificially) feed.
27
Table 6. Quantitative change in total bacterial content1 of rabbit caecal sample by sampling time and feed supplement (n=72)
1 Results are expressed as the mean of the log 10 value ± SEM calculated of targeted bacteria copy number in 1 gram of caecal sample
2 Abbreviations mean – control (K), probiotic (Pro), prebiotic (Pre), pro and prebiotic (ProPre), mycotoxin (_M)
a,b,c Values within a column in the same sampling time, with different superscripts differ significantly at P<0.05
A,B,C Values within a row in the same diet, with different superscripts differ significantly at P<0.05
Diet2
Sampling point RSD
P-value (sampling
time)
1 2
K Pro
12.9 ± 0.2a,A 12.3 ± 0.4b,B 0.771 0.000 Pro 12.2 ± 0.2b,A 12.0 ± 0.1a,B 0.447 0.009 Pre 12.7 ± 0.1c,A 12.5 ± 0.3b,B 0.465 0.015 ProPre 12.7 ± 0.1c,A 12.3 ± 0.3b,B 0.706 0.001 K_M
Pro
12.0 ± 0.1b
Pro_M 12.2 ± 0.1b
Pre_M 12.5 ± 0.3a,b
ProPre_M 12.5 ± 0.4c
RSD 0.705 0.615
P-value (diet) 0.000 0.000
28
Table 7. Quantitative change in the amount of Bacteroides1 of rabbit caecal sample by sampling time and feed supplement (n=72)
1Results are expressed as the mean of the log 10 value ± SEM calculated of targeted bacteria copy number in 1 gram of caecal sample
2 Abbreviations mean – control (K), probiotic (Pro), prebiotic (Pre), pro and prebiotic (ProPre), mycotoxin (_M)
a,b,c Values within a column in the same sampling time, with different superscripts differ significantly at P<0.05
A,B,C Values within a row in the same diet, with different superscripts differ significantly at P<0.05
Diet2
Sampling point RSD
P-value (sampling
time)
1 2
K Pro
9.9 ± 0.1a,A 9.7 ± 0.0a,B 0.902 0.000 Pro 10.2 ± 0.2b 10.1 ± 0.5b 0.000 0.955 Pre 10.1 ± 0.1a 9.8 ± 0.2a 0.167 0.186 ProPre 10.1 ± 0.2a,b,A 9.8 ± 0.1a,B 0.516 0.009 K_M
Pro
9.5 ± 0.1a
Pro_M 9.6 ± 0.0a
Pre_M 9.9 ± 0.2a
ProPre_M 9.6 ± 0.3a
RSD 0.520 0.369
P-value (diet) 0.001 0.014
29
Table 8. Quantitative change in the amount of Clostridium coccoides1 of rabbit caecal sample by sampling time and feed supplement (n=72)
1Results are expressed as the mean of the log 10 value ± SEM calculated of targeted bacteria copy number in 1 gram of caecal sample
2 Abbreviations mean – control (K), probiotic (Pro), prebiotic (Pre), pro and prebiotic (ProPre), mycotoxin (_M)
a,b,c Values within a column in the same sampling time, with different superscripts differ significantly at P<0.05
A,B,C Values within a row in the same diet, with different superscripts differ significantly at P<0.05
Diet2
Sampling point RSD
P-value (sampling
time)
1 2
K Pro
9.8 ± 0.1a,A 9.1 ± 0.1a,B 0.911 0.000 Pro 9.5 ± 0.1b,A 9.1 ± 0.3a,B 0.419 0.012 Pre 9.4 ± 0.2b 9.2 ± 0.3a,c 0.055 0.462 ProPre 9.3 ± 0.2b 9.2 ± 0.2b,c 0.062 0.563 K_M
Pro
9.2 ± 0.1a,c
Pro_M 9.2 ± 0.2b,c
Pre_M 9.2 ± 0.2a
ProPre_M 9.2 ± 0.1a
RSD 0.638 0.191
P-value (diet) 0.000 0.320
30
Table 9. Quantitative change in the amount of Clostridium leptum1 of rabbit caecal sample by sampling time and feed supplement (n=72)
1Results are expressed as the mean of the log 10 value ± SEM calculated of targeted bacteria copy number in 1 gram of caecal sample
2 Abbreviations mean – control (K), probiotic (Pro), prebiotic (Pre), pro and prebiotic (ProPre), mycotoxin (_M)
a,b,c Values within a column in the same sampling time, with different superscripts differ significantly at P<0.05
A,B,C Values within a row in the same diet, with different superscripts differ significantly at P<0.05
Diet2
Sampling point RSD
P-value (sampling
time)
1 2
K Pro
10.5 ± 0.1A 10.2 ± 0.1c,B 0.574 0.004 Pro 10.5 ± 0.2a 10.2 ± 0.3b 0.168 0.146 Pre 10.4 ± 0.2b 10.4 ± 0.0b 0.113 0.286 ProPre 10.5 ± 0.2a,A 10.2 ± 0.0b,B 0.807 0.000 K_M
Pro
10.5 ± 0.2a
Pro_M 10.3 ± 0.1b
Pre_M 10.4 ± 0.0b
ProPre_M 10.2 ± 0.2d
RSD 0.231 0.789
P-value (diet) 0.117 0.000
31
Table 10. Quantitative change in the amount of Bifidobacterium1 of rabbit caecal sample by sampling time and feed supplement (n=72)
1Results are expressed as the mean of the log 10 value ± SEM calculated of targeted bacteria copy number in 1 gram of caecal sample
2 Abbreviations mean – control (K), probiotic (Pro), prebiotic (Pre), pro and prebiotic (ProPre), mycotoxin (_M)
a,b,c Values within a column in the same sampling time, with different superscripts differ significantly at P<0.05
A,B,C Values within a row in the same diet, with different superscripts differ significantly at P<0.05
Diet2
Sampling point RSD
P-value (sampling
time)
1 2
K Pro
9.5 ± 0.3a,A 9.1 ± 0.3b,B 0.322 0.040
Pro 9.2 ± 0.2b 9.2 ± 0.1b 0.083 0.944
Pre 9.0 ± 0.1b,A 9.6 ± 0.3a,B 0.396 0.017 ProPre 9.1 ± 0.2b 9.1 ± 0.4b 0.019 0.394 K_M
Pro
9.0 ± 0.2b
Pro_M 9.1 ± 0.1b
Pre_M 9.2 ± 0.0b
ProPre_M 9.3 ± 0.0b
RSD 0.520 0.518
P-value (diet) 0.001 0.000
32
Table 11. Quantitative change in the amount of Escherichia coli1 of rabbit caecal sample by sampling time and feed supplement (n=72)
1Results are expressed as the mean of the log 10 value ± SEM calculated of targeted bacteria copy number in 1 gram of caecal sample
2 Abbreviations mean – control (K), probiotic (Pro), prebiotic (Pre), pro and prebiotic (ProPre), mycotoxin (_M)
a,b,c Values within a column in the same sampling time, with different superscripts differ significantly at P<0.05
A,B,C Values within a row in the same diet, with different superscripts differ significantly at P<0.05
The changes by time can be observed in tables 6-11. In the control group the total bacterial content, Bacteroides, Firmicutes and Bifidobacteria decreased, while E. coli copy number increased over time.
In case of probiotic-diet, total bacterial content and Clostridium coccides copy number decreased while E. coli increased. In the MOS- supplemented group the total bacterial content significantly decreased over time, but the amount of Bifidobacteria and E. coli increased.
Diet2
Sampling point RSD
P-value (sampling
time)
1 2
K Pro
5.9 ± 0.4a,A 7.3 ± 0.4b,B 0.508 0.014 Pro 6.8 ± 0.4b,A 8.4 ± 0.4a,B 0.594 0.001 Pre 6.5 ± 0.4a,b,A 6.9 ± 0.2b,B 0.396 0.017 ProPre 6.8 ± 0.3a,b,A 6.0 ± 0.3b,B 0.376 0.020 K_M
Pro
6.5 ± 0.4b
Pro_M 6.8 ± 0.5b
Pre_M 6.2 ± 0.2b
ProPre_M 7.1 ± 0.3b
RSD 0.268 0.692
P-value (diet) 0.072 0.000
33 3.6.1 Evaluating results
Saint-Cyr et al. (2013) investigated the effect of orally added Fusarium toxin (DON), (in humans) to intestinal microbiota by quantitative real-time PCR determination the dominant and subdominant bacterial groups of stool samples. During the first 3 weeks of DON exposure, a significant, 0.5 log10
increase was observed in the Bacteroides/Prevotella group and significant decrease (0.9 log10 CFU / g) was detected in Escherichia coli. In my experiment I studied the effect of T-2 exposure on intestinal microbiota by the same molecular genetic method, which also resulted in a significant decrease in the amount of Escherichia coli (0.8 log10 copies / g). In the above mentioned study, it has been shown that DON oral exposure has a significant effect on the intestinal microbial composition. My results shows that T-2 mycotoxin (by oral feed) has a significant influence on the intestinal microbial composition.
As a probiotic, Bacillus cereus var. toyoi spores increased the amount of Bacteroides and E. coli bacteria and reduced the total bacterial content significantly. Therefore, my results -based on molecular genetic studies- confirm previous conclusions obtained in other species and in rabbit based on conventional culturing methods (Scharlek et al., 2007; Bónai et al., 2008;
Gisbert et al., 2013), that we can change the intestinal microbial composition by supplemeted diets.
34
3.7 Effects of Fumonisin B1 mycotoxin and/or Mannan- oligosaccharide supplements on rabbit caecal microbiota
The use of FB1 resulted less total bacterial count of all sampling points, compared to the control samples. 12-hour incubation resulted a 66.5%
reduction in total bacterial content.
The addition of mycotoxin resulted an 80% decrease in E. coli compared to the control group after 12 hours incubation, but after 36 hours the difference was not significant.
After 36 h incubation, MOS treatment resulted the highest bacterial count (Table 12).
Growth of Bacteroides at 36 hours was slower than in control samples;
and that intensified in case of combination therapy.
The amount of E. coli was reduced by all treatments (MOS and FB1 alone or in combination) after 12 and 24 hours incubation, but the difference at the end of the experiment (after 36 hours incubation) was not significant.
Compared to the MOS treatment and the control group, the total bacterial content of MOS and FB1 group was lower, but this treatment resulted the highest Bacteroides copy number. For E. coli, the combined effect resulted in a similar copy number as MOS and FB1 alone.
35 Impact of incubation time
The total number of bacteria and Bacteroides in the control group decreased, while the E. coli copy number increased over time.
MOS treatment maintained the accumulation of total bacteria over time, while amount of total bacteria decreased in case of toxin and combined treatment.
FB1 had a greater and more rapid reduction effect on the number of bacteria compared to MOS + FB1 treatment.
36
Table 12. Effects of treatments (MOS, FB1) and time on the copy number of studied bacterial groups
1Results are expressed as the mean of the log 10 value ± SEM calculated of targeted bacteria copy number in 1 gram of incubation mix
2 Abbreviations mean – control (K), mycotoxin (FB1), prebiotikum (MOS), mycotoxin and prebiotikum (FB1+MOS)
a,b,c Values within a column in the same sampling time, with different superscripts differ significantly at P<0.05
A,B,C Values within a row in the same diet, with different superscripts differ significantly at P<0.05
Copy number 1 Sampling
point 1stsampling 2nd sampling 3rdsampling 4th sampling (Incubation
time, hours) (0) (12) (24) (36)
Treatment2
Total bacteria
K 13.35±0.1A 13.52±0.1aA 13.36±0.1aB 13.24±0.1aC FB1 13.35±0.1A 12.90±0.1bB 13.01±0.1bC 12.90±0.1cB MOS 13.35±0.1A 13.45±0.1aB 13.50±0.1aB 13.51±0.1bB FB1+MOS 13.35±0.1A 13.16±0.1bB 13.12±0.1bB 13.08±0.1cB
Bacteroides
Treatment2 K 11.27±0.0A 11.27±0.1aA.B 11.26±0.1aB 11.18±0.1aB.C FB1 11.27±0.0 11.33±0.3a 11.42±0.2a 11.44±0.2b MOS 11.27±0.0 11.35±0.2a 11.46±0.0a 11.39±0.2b FB1+MOS 11.27±0.0A 11.65±0.1bB 11.67±0.1bB 11.68±0.1cB E. coli
Treatment2 K 9.15±0.1A 11.12±1.0aB 11.20±0.5aA.B 11.44±0.4aB FB1 9.15±0.1A 8.81±0.1bA.C 9.72±0.6bB 10.04±0.2aC MOS 9.15±0.1A 9.33±0.1bA.B 9.39±0.1bA.B 9.47±0.2aB FB1+MOS 9.15±0.1A 9.65±0.1bA 10.76±0.2a.bB 10.98±0.1aC
37 3.7.1 Evaluating results
In this experiment, the total bacterial, Bacteroides and E. coli counts were tested with bacterial target-specific qPCR, as previously. Comparing my results to the study of Combes et al. (2011), the following differences can be identified: the total bacterial content and the initial amount of Bacteroides were higher in the incubation mixture (triple diluted caecum content), than the total bacterial content of the caecum by the experiment Combes et al. (2011).
The total number of bacteria expressed on the 35th day of life was 13.35
± 0.1 log10 in a 1 g incubation mixture; in contrast, Combes et al. (2011) established 11.35 ± 0.15 log10 copy counts in 1g of undiluted caecal content.
The amount of Bacteroides on day 35 was 11.27 ± 0.0 log10 in 1 g incubation mixture versus 10.58 ± 0.15 log10 copy number from 1 g of total caecal content, as described by Combes et al. (2011).
There is a possibility of certain degree of microbial metabolism of mycotoxins in the intestinal tract; or -through other mechanisms- toxins may influence the microbial composition. Some toxins may have an antimicrobial effect (Grenier and Applegate, 2013). Mycotoxins can not only affect on the community structure, but also on the composition on functional genes of the intestinal microbiota (Guo et al., 2014). However, only a few studies have been carried out to date, to find out the effect of oral mycotoxin exposure on the microbial community.
38
The first study on the effect of FB1 on bacterial growth was published in 1997 (Becker et al., 1997). Typically representative bacteria of human intestinal microbiota were incubated in vitro in the presence of 50-1000 μM FB1. Inhibition of bacterial growth was not observed, suggesting that FB1 was not toxic for the tested bacteria. The in vitro study of Antonissen et al. (2015) also did not show the inhibitory effect of FB1 on bacterial growth (at different concentrations); no differences were found between the microbial composition of the control and the chickens consuming the feed contaminated with toxin.
In my study, FB1 resulted lower amount of total bacteria and E. coli, but at the end of the experiment (last sampling) there were higher Bacteroides number compared to the control. My results are in accordance with Saint-Cyr et al. (2013), who investigated the effect of oral DON exposure on human intestinal microbiota: a significant increase was observed in the amount of Bacteroides / Prevotella while E. coli number decreased.
In my experiment, I successfully demonstrated the beneficial physiological effect of the mannan-oligosaccharide (MOS) with a significant increase in the total bacterial count and Bacteroides, which was supported by the decrease in the number of E. coli bacteria compared to the control group.
These results are in line with an in vivo study (in chicken) by Spring et al.
(2000), and with a rabbit experiment by Oso et al. (2013). The characteristic feature of the MOS the ability of binding to pathogenic bacteria expressing
39
type 1 fimbrias, such as E. coli, thus MOS may increase the resistance of early- weaned rabbits to digestive diseases.
In case of combined use (FB1+MOS), MOS limits the negative effect of FB1 on the total bacterial content (difference is not significant, but notable p = 0.058).
The decrease of total bacterial content and Bacteroides amount as the incubation time has passed can be explained by the depletion of the substrate.
The growth rate of bacteria is directly proportional to the amount of nutrients available (Monod, 1949). The number of non advantageous E. coli bacteria increased by incubation time, which can be explained by the very short generation time of this bacterial group and the reduction in the number of other, competing bacterial groups. In this case, the resource ratio competition model takes effect; the availability and proportion of nutrients consumed determines the proportion of different bacterial species within the bacterial community (Hibbing et al., 2010).
40 4. Conclusions and suggestions
4.1 Effects of spirulina and/or thyme supplementation on the caecal bacterial community
Using the quantitative real-time PCR and SYBR® Green method, I showed a higher total bacterial content (of rabbits caecum) in the same age, than Michelland et al. (2011) using ABI Prism 7900HT sequence detection system with TaqMan® universal PCR master mix.
During the study of the ratio of bacterial groups in the experiment, I came to the conclusion that the spirulina as a feed additive increased the proportion of Bacteroides, C. leptum and C.coccoides bacteria within the total bacteria content over time, while other three treatments resulted in the ratio increase of non investigated bacterial groups. The directly or indirectly acting mechanism of spirulina affecting the composition of the caecal microbiota, which reduces the proportion of the above mentioned bacteria is not yet known.
Based on my results and literature data (Rasmussen et al., 2009), spirulina likely have selective antimicrobial activity or it might serve as a substrate for certain microbes.
According to Combes et al. (2011), after 49th days of life we can less interfere the composition and quantity of the rabbit caecal microbiota with a supplemented diet . In contrast, in my experiment, spirulina and/or thyme supplementation had an effect on the number of copies of the examined
41
bacteria, in the intervals between days 49th and 77th, because there were also significant differences between 63 and 77 days of age.
The results of my experiments prove the validity of the practical use of the investigated feed additives (spirulina, thyme) at the described doses to modify the composition of the caecal microbiota. In addition to my own results, a recent scientific review (Assan, 2018), supports the beneficial physiological effect of many supplements. Based on the above, rabbit farmers can choose from a variety of options. Their decision may be affected by the treatment or prevention targets, besides the availability and kind of the applied dietary supplement (feed, drinking water, extract or whole vegetable portion).
I would suggest further studies on the use of spirulina and thyme. For the promotion of eubiosis, it would be important to develop their optimal proportion as accurately as possible.
42
4.2 Effect of T-2 mycotoxin on intestinal microbiota, investigation of plausible guarding effects of pro- and prebiotics
The addition of T-2 mycotoxin to feed has a remarkable effect on the intestinal microbial composition, but the prebiotics and combination of pre- and probiotics can moderate the bacterial-content-reducing effect of toxin.
The mannan oligosaccharide (MOS) as a prebiotic, itself did not affect the total amount of bacteria. However, with MOS supplementation, Clostridium leptum and Bifidobacterium copy numbers showed a significantly higher value compared to the control group; for these bacterial groups the favorable prebiotic effect was confirmed and is in line with the results of previous studies where other animal species, techniques and bacterial groups were used. Based on my results, the practical application of pre- and probiotics in feeding can be recommended due to their preventative and eubiosist- promoting effects.
43
4.3 Effects of Fumonisin B1 mycotoxin and/or Mannan- oligosaccharide supplements on rabbit caecal microbiota
The studied mycotoxin, FB1 has an adverse effect on the rabbit caecal ecosystem, which manifested in a significant, 66.5% decrease in bacterial count.
I demonstrated the beneficial physiological effect of mannan oligosaccharide (MOS) with a significant increase in total bacterial count and Bacteroides and a decrease in the number of E. coli bacteria. In addition to promoting eubiosis, MOS has limited the negative effect of FB1 on the total bacterial content.
Another important aspect of the study was that the effects of the applied prebiotic and mycotoxin could be evaluated in vitro, directly on the microbiota, so there could not be any possible influencing circumstances of the body and certain physiological mechanisms.
44 5. New scientific results
Based on the results of the experiments carried out, the following five new scientific results can be formulated:
1. Spirulina supplementation (5%) results in a significantly higher total bacterial content at 49th and 63rd days of life and temporarily increases the copy number of Bacteroides (at 63. day). Spirulina (5%) alone and in combination with thyme (3%) also reduces the amount of Firmicutes.
2. A T-2 toxin-containing diet (2 mg / kg), supplemented with prebiotics (MOS), prebiotics and probiotics (2% MOS + 0.2% (2x10⁵ / g) of Bacillus cereus var. toyoi) (p <0.05) increases the amount of bacteria found in the rabbit's caecum comparing to the group that consumes only the mycotoxin contaminated feed.
3. A T-2 mycotoxin (2 mg / kg) containing diet significantly reduces the amount of Escherichia coli in rabbit-caecum by 86.4%.
4. The in vitro added FB1 mycotoxin (0.05 mg / 3.33g caecal content), after a 12 hour incubation, significantly reduces the total number of bacteria (66.5%) and the Escherichia coli copy number (80%), alters microbial quantity and composition of the caecum .
5. The negative effect of FB1 mycotoxin in vitro (0.05 mg / 3.33g caecal content) on total bacterial content is limited (p = 0.058) if MOS prebiotic (10 mg / 3.33g caecal content) is added.
45
6. Publications from the topic of the dissertation Scientific publications in English
Bónai A, Bagóné Vántus V. 2013. Az elválasztási kor, valamint pro- és prebiotikumok alkalmazásának hatása a növendék házinyúl vakbél- mikrobiotára. Animal Welfare, Etológia és Tartástechnológia. Vol 9.
No 3. p.99-109.
Bagóné Vántus V, Kovács M, Zsolnai A. 2014. The rabbit caecal microbiota:
development, composition and its role in the prevention of digestive diseases – a review on recent literature in the light of molecular genetic methods. Acta Agraria Kaposváriensis, Vol 18 No 1, p.55-65
Bagóné Vántus V., Dalle Zotte A, Cullere M, Bónai A, Dal Bosco A, Szendrő Zs, Tornyos G, Pósa R, Bóta B, Kovács M, Zsolnai A. 2017.
Quantitative PCR with 16S rRNA-Gene-Targeted Specific Primers for Analysis of Caecal Microbial Community in Growing Rabbits after Dietary Supplementation of thyme (Thymus vulgaris) and spirulina (Arthrospira platensis). Italian Journal of Animal Science.
DOI:10.1080/1828051X.2017.1400413. Impact Faktor: 0,95.
Under submission
Bagóné Vántus V, Szabó-Fodor J, Gathira S. P. M, KovácsM, Ferenczi Sz, Stéger V, Zsolnai A. 2018. The effect of fumonisin B1 mycotoxin and/or mannan oligosaccharide supplementation on rabbit caecal microbiota in vitro. (– World Rabbit Science)
Foreign conference publication
Vántus V, Bónai A, Zsolnai A, Dal Bosco A, Szendrő Zs, Tornyos G, Bodnár Zs, Morsy W.A, Pósa R, Toldi M, Bóta B, Kovács M, Dalle Zotte A.
46
2012. Single and combined effect of dietary thyme (Thymus vulgaris) and Spirulina (Arthrospira platensis) on bacterial community in the caecum and caecal fermentation of rabbits. 20th Int. Symp. „Animal Science Days”, Krajnska gora, Slovenia, Sept. 19-21, 2012. Acta agriculturae Slivenica, Supplement 3, p. 77-81.
Vántus V, Dalle Zotte A, Kovács M, Dal Bosco A, Szendrő Zs, Zsolnai A.
2012. Dietary supplemetation of spirulina (Arthrospira platensis) and thyme (Thymus vulgaris L.). Part 3: Effect on caecal bacterial community in growing rabbits.10th WRSA World Rabbit Congress, 3- 6. September 2012, Sharm El Sheikh, Egypt, p. 84. pp. 669-672.
Bónai A, Dalle Zotta A, Kametler L, Vántus V, Morsy W. A, Matics Zs, Dal Bosco A, Szendrő Zs, Kovács M. 2012. Dietary supplemetation of spirulina (Arthrospira platensis) and thyme (Thymus vulgaris L.). Part 2: Effect on gastrointestinal growth, caecal microbiota and fermentation in rabbits. 10th WRSA World Rabbit Congress, 3-6.
September 2012, Sharm El Sheikh, Egypt, pp. 707-711.
Hungarian, foreign language conference publication
Vántus V, Dalle Zotte A, Kovács M, Dal Bosco A, Szendrő Zs, Zsolnai A.
Preliminary results on the Effect of Spirulina (Arthrospira platensis) and thyme (Thymus vulgaris) on bacterial diversity in the caecum of rabbits. Budapest, 2. June 2012. CEELA-II- 2012 Conference Budapest. p. 132-134.
47 Hungarian language conference publication
Vántus V, Dalle Zotte A, Kovács M, Dal Bosco A, Szendrő Zs, Zsolnai A.
Spirulina kiegészítés hatása a vakbél mikrobióta összetételére nyúlban.
24. Nyúltenyésztési Tudományos Nap, Kaposvár, 2012. p.117-120.
Bónai A, Dalle Zotte A, Vántus V, Morsy W. A, Kametler L, Matics Zs, Dal Bosco A, Szendrő Zs, Kovács M. Spirulina és kakukkfű kiegészítés hatása a nyulak vakbélfermentációjára. 24. Nyúltenyésztési Tudományos Nap, Kaposvár, 2012. p.111-114.
Conference presentations
Bagóné Vántus Viola: Vakbél mikrobióta-mikotoxin kölcsönhatás meghatározása mikrobiális genomikai módszerrel. PhD Kerekasztal Konferencia. Kaposvári Egyetem Állattenyésztési tudományok Doktori iskola. 2014.03.03.
Bagóné Vántus Viola: Genomiális szelekció nyúlban: aktuális tenyésztési programok. Beszámoló a Genomic selection in rabbit breeding training school (Valencia, 2013. június 24-28.) továbbképzés anyagáról (célok és kritériumok, modellek és módszerek, a BLUPF90 programcsalád alkalmazási lehetőségei) "Szakmai beszámolók továbbképzésekről 2013" témájú workshop. Kaposvári Egyetem Agrár- és Környezettudományi Kar Élettani, Biokémiai és Állategészségügyi Intézet, 2013. november 27.
Bagóné Vántus Viola: Effect of Spirulina and/or thyme supplementation on the caecal microbiota, Workshop. gut microbiota – methodologies, Kaposvári Egyetem, Élettani és Állathigiéniai Tanszék, 2013. 04. 24.
(Angol nyelvű előadás)


![].About ].Cancertherapyhasundergonesignificantimprove-ment,whichledtoincreasedlong-termsurvivalratesamongcancerpatients[ worldwide[ , ].Themostcommoncancerousdiseasesarebreastandlungcancersinwomenandmen,respectively[ InvestigationoftheAntihypertrophicandAn](data:image/gif;base64,R0lGODlhAQABAIAAAP///wAAACH5BAEAAAAALAAAAAABAAEAAAICRAEAOw==)