Casein probe–based fast plasmin determination in the picomolar range by an ultra-high frequency acoustic wave biosensor
Loránd Románszkia,b, Marek Tatarkoa,c, Mengchi Jiaoa, Zsófia Keresztesb, Tibor Hianikc*, Michael Thompsona*
aDepartment of Chemistry, University of Toronto, Lash Miller Laboratories, 80 St.
George Street, Toronto, Ontario M5S 3H6, Canada
bFunctional Interfaces Research Group, Institute of Materials and Environmental Chemistry, Research Centre for Natural Sciences, Hungarian Academy of Sciences,
Magyar tudósok körútja 2, 1117 Budapest, Hungary
cDepartment of Nuclear Physics and Biophysics, Faculty of Mathematics, Physics and Informatics, Comenius University, Mlynska dolina F1, 84248 Bratislava, Slovakia
*Corresponding authors. E-mail addresses: tibor.hianik@fmph.uniba.sk (T. Hianik);
mikethom@chem.utoronto.ca (M. Thompson) Abstract
Detection of residual plasmin activity in milk represents a difficult challenge for the dairy industry. Conventional methods are either too expensive or incapable of providing enough data from UHT treated milk. Acoustic wave–based biosensors operated in the thickness shear mode (TSM) showed potential for the detection of proteolysis of β-casein, a milk protein by protease plasmin. An ultra-high frequency device, the electromagnetic piezoelectric acoustic sensor (EMPAS), designed to enhance the sensitivity of TSM, was tested for detection of plasmin at low
concentrations. β-casein layers immobilised on the hydrophilic or hydrophobized surfaces of EMPAS quartz discs served as substrate for the enzyme. In contrast with conventional TSM devices, the shearing oscillations in EMPAS are induced
contactless, by a magnetic coil located 30 μm below the quartz crystal. This
configuration allows the registration of unusually high harmonics (up to the 49th-53rd), thus enhancing the sensitivity of detection. On both surface types, the adsorbed β- casein mass and the stability of the layer was compared, with the result that hydrophobic surfaces provide superior conditions for immobilisation than the hydrophilic case. Consequent proteolysis measurements of these substrate layers were carried out in a broad plasmin concentration range (32 pM – 10 nM) in flow mode. Initial reaction rates measured at different enzyme concentrations have been used to construct a calibration curve based on an inverse Michaelis–Menten type equation. The sensitivity of the EMPAS allowed measurements of as low as 32 pM concentration of plasmin, reaching (and often exceeding) levels comparable to state of the art techniques like ELISA. The presented method however, unlike ELISA, is effective on a timescale of minutes.
Keywords: Plasmin; β-casein; Electromagnetic piezoelectric acoustic sensor;
Inverse Michaelis–Menten equation
1. Introduction
The topic of standards in quality assurance in the food industry is currently the subject of much discussion in many countries of the European Union. New
techniques for quality testing are essential to provide the necessary regular but
*Revised Manuscript
Click here to view linked References
inexpensive appraisal of dairy production. In the case of dairy products, one of the main components of their taste and consistence is rooted in the nature of the particular protein composition. Casein is the major milk protein group, consisting of up to 2.5% of the total milk mass [1]. Bovine β-casein is one of the most abundant milk proteins and belongs to the Ca-sensitive phosphoproteins. The primary structure of β-casein is proline-rich, and the protein consists of 209 amino acid residues,
including five phosphorylated serines. The molecular mass is approx. 24 kD, and the isoelectric point is 5.2. β-casein has a tendency to associate at a critical
concentration of 0.5 mg/mL in aqueous solution. It is generally accepted that
β-casein is an intrinsically disordered protein [2–3] with an amphiphilic character [4], where the N-terminal region of the sequence is rich in polar and negatively charged amino residues, including all five phosphorylated serines, while most of the
hydrophobic and positive fragments are located in the C-terminus [5]. The diversity of casein types and their specific properties allow for the assembly of these molecules into a unique pseudo-micellar structure termed the “casein micelle”.
In bovine milk, protein cleavage is provided by the plasmin protease system.
Urokinase or tissue-type activators cleave the non-active zymogen plasminogen between Arg561 and Val562, creating the serine protease plasmin [6]. During the lactation period, typical plasmin concentrations fall in the 1–8 nM range. To prevent plasmin from cleaving β-casein causing the negative changes in milk, it is necessary to employ a proper heating technique, commonly ultra-high temperature (UHT) treatment, which can effectively inactivate plasmin [7]. However, if the technique is not properly applied, residual plasmin activity could remain and as the plasmin inhibitors are the least temperature-stable, this activity will be enhanced by
nonregulated activation of plasmin [8]. Traditional techniques of detection of residual plasmin activity are either not sensitive enough or too expensive to be employed for frequent use in dairy plasmin detection.
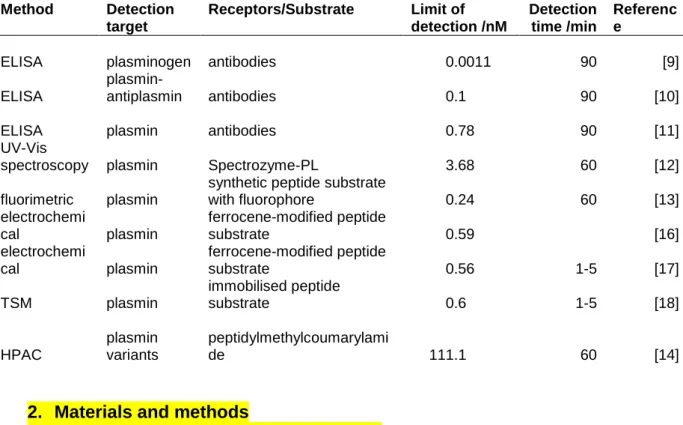
There are several methods available for the detection of protease chemistry. A traditional approach for the assay of proteins present in a sample is the enzyme- linked immunosorbent assay (ELISA) method. ELISA-based assays have been developed for a wide range of targets from the plasmin protease system in milk, such as plasminogen [9] and plasmin complexes [10]. Several specific plasmin ELISA tests are available [11], but these are inferior in sensitivity compared to the assays for other components of plasmin protease system. While these tests could reach the needed limit of detection (LOD) of nanomolar level for residual plasmin activity, they are lacking in expression of inhibitory effects of the protease system. Other methods capable of approaching the required LOD are spectroscopic methods. However, while UV-Vis spectroscopy [12] and fluorometric tests [13] are achieving an LOD below nanomolar level, synthetic substrates are necessary to consider them plausible for plasmin detection. Finally, high performance affinity chromatography (HPAC) is also an option, but its LOD is lacking in sensitivity for detection at hundreds of nanomolar level [14].
The plasmin is infiltrated into the milk from blood, where it plays an important role in the fibrin cloth degradation, ovulation, and activation of enzymes such as
collagenase. Therefore its detection in blood is also an important issue. For the detection of plasmin activity in the milk, blood stream and other body fluids, several methods are available: labelling with a radioactive tracer such as Tc 99m [15], silver staining and Coomassie brilliant blue. Detection of plasmin during pathogenic states was investigated and several methods were developed, including a test against dengue fever involving antibody-binding plasmin–antiplasmin complexes [10] or
fluorometric testing for plasmin activity during microbial keratitis, cornea ulcer and herpetic infection [13]. A comparison of the sensitivity of various plasmin detection methods is shown in Table 1.
A prospective method to overcome the problems of residual plasmin activity detection is the appliction of electrochemical biosensors. Ohtsuka et al. used a
specific peptide substrate modified with ferrocene and immobilised on a gold surface.
The substrate was cleaved by plasmin, and the decrease of the well-resolved redox current provided the signal [16]. This method was further developed by Castillo et al.
[17], and detection limit as low as 0.56 nM was achieved.
Another method that could possibly reach such sensitivity could be acoustic biosensor. Recently, the detection of plasmin by thickness shear mode (TSM)
technique was reported for the first time [18]. A short, specific peptide was used as a substrate and a high sensitivity was achieved (LOD: 0.65 nM).
In this work, the undesired casein cleavage by plasmin was investigated by using β-casein as a substrate for the determination of plasmin in the concentration range of 10 nM–32 pM by an electromagnetic piezoelectric acoustic sensor (EMPAS) [19-20].
In contrast with traditional TSM methods, the shearing oscillations in EMPAS are driven by an electromagnetic coil placed under the quartz crystal. This arrangement allows measuring at much higher harmonics, which results in an increased sensitivity.
We demonstrate for the first time the usage of electromagnetically driven piezo crystals for milk quality assessment, benefiting from the enhanced sensitivity and low detection limit provided by the possibility of measuring at the 49th harmonic.
Table 1. Comparison of sensitivity of various methods for the detection of plasmin and plasminogen published so far.
Method Detection target
Receptors/Substrate Limit of detection /nM
Detection time /min
Referenc e
ELISA plasminogen antibodies 0.0011 90 [9]
ELISA
plasmin-
antiplasmin antibodies 0.1 90 [10]
ELISA plasmin antibodies 0.78 90 [11]
UV-Vis
spectroscopy plasmin Spectrozyme-PL 3.68 60 [12]
fluorimetric plasmin
synthetic peptide substrate
with fluorophore 0.24 60 [13]
electrochemi
cal plasmin
ferrocene-modified peptide
substrate 0.59 [16]
electrochemi
cal plasmin
ferrocene-modified peptide
substrate 0.56 1-5 [17]
TSM plasmin
immobilised peptide
substrate 0.6 1-5 [18]
HPAC
plasmin variants
peptidylmethylcoumarylami
de 111.1 60 [14]
2. Materials and methods
2.1 Reagents and β-casein layer preparation
The amount, quality, stability and adsorption of the β-casein layer are very important for the success of the enzyme determination. These parameters were expected to be strongly influenced by the hydrophilic/hydrophobic nature of the solid substrate. Therefore, quartz crystals were subject to two different surface treatments, a hydrophilic and a hydrophobic one. Hydrophilic quartz surfaces were obtained by an intensive cleaning procedure involving Piranha mixture (H2O2, H2SO4). Warning:
Piranha is very aggressive liquid and should be handled with a special care.
Hydrophobic surfaces were prepared by surface modification with
octadecyltrichlorosilane (OTS) as detailed below. Quartz crystal discs were cleaned by sonication in detergent solution for 30 min in clean test tubes, followed by
copiously rinsing with tap water, and distilled water. Then, the discs were immersed for 30 min in 90°C Piranha solution (3:1 V/V mixture of 98% H2SO4 and 30% H2O2) pre-heated in a water bath, thoroughly rinsed with distilled water, methanol, sonicated in another portion of methanol for 2 min, followed by a rinse with methanol and then individually transferred into glass vials, which were subsequently placed in an oven maintained at 150°C for drying. After 2 h, the vials were immediately transferred into a humidity chamber (70-80% relative humidity, room temperature) for overnight surface moisturization. Quartz disks were individually transferred to silanized vials and moved into a glove box under nitrogen atmosphere. A solution of
octadecyltrichlorosilane (OTS) was prepared in a volumetric ratio of 1:1000 OTS to anhydrous toluene. Portions of 1 mL of the OTS solution were added to the vials. The vials were then capped, removed from the glove box, and allowed to stay on a shaker for 2 h. The quartz disks were then rinsed thoroughly with toluene, followed by
chloroform, and dried under a gentle stream of nitrogen before being stored in new scintillation vials.
Static contact angles (CA) were measured in a KSV CAM 01 (Biolin Scientific, Finland) instrument featuring a monochromatic LED light source and a telecentric video camera. 3 μL droplets, disposed from a Hamilton microsyringe, were formed at the tip of the blunt type needle and the syringe was lowered to the sample stage. On each sample, treated with different concentrations of OTS, three parallel
measurements were carried out. The software calculated the left and right CAs by fitting the Young–Laplace equation to the drop contour. The left and right CAs were averaged for each droplet. Three parallel samples of both types were measured at three different positions each, and the CAs of these nine measurements were averaged again.
Ultrapure water obtained by reverse osmosis (Thermo Scientific,
ρ = 18.2 MΩ∙cm) was used for the preparation of solutions. As a medium, 10 mM, pH=7.4 phosphate buffered saline (PBS) was used (10 mM Na2HPO4, 2 mM KH2PO4, 2.7 mM KCl and 137 mM NaCl) prepared from tablets (Sigma-Aldrich, Germany). The concentration of bovine β-casein (≥98%, Sigma-Aldrich, M ≈ 24 000 g/mol) solutions, prepared in PBS, was chosen to be 0.05 mg/mL in order to remain about ten times below the critical micelle concentration (CMC) of the protein (≈0.5 mg/mL, [21]).
Plasmin (PL) was obtained by activation of plasminogen from bovine plasma (PLG, lyophilized powder, Sigma-Aldrich) by urokinase (uPA) from human urine (EMD Millipore) using 1 mg plasminogen : 35 000 U urokinase ratio based on modified literature protocols [22–23]. After activation, the nominally 1 µM concentration of the PL was exactly determined by measuring the absorbance change at 405 nm wavelength in 60 seconds of a series of Spectrozyme-PL (H-D- norleucyl-hexahydrotyrosyl-lysine-p-nitroanilide, Sekisui Diagnostics, LLC, USA)
solutions prepared in Tris (2-amino-2-(hydroxymethyl)propane-1,3-diol) buffer (20 mM Tris + 150 mM NaCl at pH = 7.4), digested by the active enzyme, as
described in [24]. The active plasmin concentration was obtained as a parameter, by nonlinear fitting of the Michaelis–Menten equation to the obtained dA/dt (rate of absorbance change) vs. cS (Spectrozyme-PL concentration) data points. Dilutions of this stock solution were prepared in PBS. All experiments were carried out at 20 °C.
2.2 Acoustic wave measurements
The experiments were run using a home-built electromagnetic piezoelectric acoustic sensor (EMPAS) [19–20]. The whole setup (Figure 1) consisted of a Plexiglas flow- through cell (~78 μL internal volume), a ~5 mm diameter hand-wound coil of a 105 μm diameter polyurethane-coated copper wire (Goodfellow), a frequency generator (Hewlett Packard 8648B), a trimmer (muRata, Seminole, FL), placed in parallel with the coil terminals in order for the coil to be tuned to electrical resonance, a lock-in amplifier (SR510, Stanford Research Systems), a diode detector (made in house) to measure the voltage drop developed across the coil terminals at acoustic resonance, with the output being fed into the lock-in amplifier, a digital oscilloscope (Tektronix TDS 210), a syringe pump (Harvard Apparatus Pump 11) equipped with a 60 mL plastic syringe (Henke-Sass, Wolf GmbH, Germany), providing a flow rate of 34 µL/min. Teflon tubing (1.58 mm od, 0.8 mm id, Supelco, Bellefonte, PA) was used to connect the syringe, flow-through cell and sample vial. In order to minimize
temperature effect on the resonant frequency, AT-cut quartz crystal wafer resonators were used. The crystals (⌀ = 13 mm diameter, t = 83 µm thickness, (Laptech
Precision Inc., Bowmanville, Ontario, Canada), were operated at the 49th overtone of their f0 = 20 MHz fundamental frequency (f49 ≈ 984 MHz). A code running under LabView 6.0 was used to control the frequency generator and the lock-in amplifier, as well as for data acquisition.
Figure 1. Scheme of the experimental setup.
3. Results and discussion
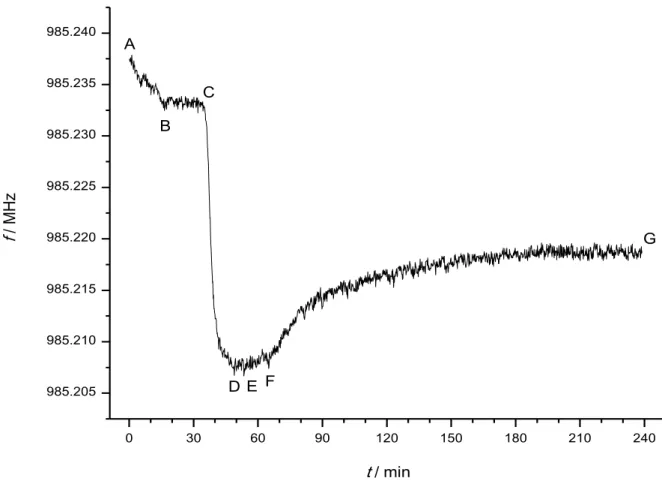
Figure 2 presents a typical frequency–time plot during an experiment. After an initial decay correlated with filling of the cell with buffer, temperature equilibration, etc.
(AB), the frequency stabilized after ~17 min (B). Then, the buffer was exchanged to β-casein solution (C), and consequently a steep frequency decay indicated the adsorption of the protein to the quartz crystal/liquid interface (CD). The adsorption reached equilibrium in about 15 min (D). The β-casein solution was then exchanged to buffer (E) to wash away any unbound protein molecule. The frequency accordingly increased slightly and the equilibrium was reached within a few minutes (F). Then, the buffer was exchanged to a freshly activated plasmin solution of approximately known concentration calculated from the stoichiometry of the activation reaction. The frequency increased asymptotically to reach a stable value (G) that corresponded to residues of the protein molecules that remained at the interface after the enzymatic cleavage and wash away of the other parts. Equilibrium was reached, depending on the plasmin concentration, within a few hours; however, the rate of the initial
frequency change, correlated to the enzymatic reaction rate, could be determined already after a few minutes. While the experiment was running, the exact
concentration of the plasmin solution was determined as detailed above. Such ∆f vs.
∆t curves were recorded for different plasmin concentrations, each one with new quartz crystal and newly adsorbed β-casein, and the initial, maximum rates of frequency change, (df/dt)0 were determined. Finally, the calibration curves were constructed.
0 30 60 90 120 150 180 210 240
985.205 985.210 985.215 985.220 985.225 985.230 985.235 985.240
F
f / MHz
t / min A
B C
D E
G
Figure 2. Typical frequency–time plot during an experiment. AB: baseline stabilization; BC: stable baseline; CD: adsorption of β-casein; DE: adsorption completed; EF: washing with buffer; FG: partial cleavage of β-casein layer by
plasmin. In this particular experiment, hydrophobized quartz crystal and 1 nM plasmin was used.
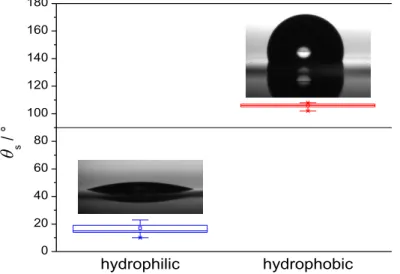
The cleaning procedure provided strongly hydrophilic quartz surfaces, characterized by a mean static water contact angle of 17°, whereas the silanization with OTS produced moderately hydrophobic surfaces with mean contact angle of 106°
(Figure 3), which is close to the literature values reported for a monolayer of OTS on oxidized silicon and alumina surfaces (102–111°, [25–27]). As expected, the two, markedly different, hydrophilic and hydrophobic surfaces led to very different β-casein adsorption profiles, different stability, and, consequently, different efficacy and sensitivity in plasmin determination. Except the difference in the surface
treatment of the quartz crystals, all other experimental conditions were kept the same.
Figure 3. Static water contact angles of cleaned, hydrophilic, and silanized,
hydrophobic quartz crystal sensors; boxplot representation of nine measurements on each surface type (3 separate measurements on each of the 3 parallel samples) in the whole, 0–180° domain. The boundary between the hydrophilic and hydrophobic region is marked at 90°. Inset illustrations are typical images of droplets.
Figure 4 illustrates the strikingly different adsorption behaviour on two different, hydrophilic and hydrophobic quartz crystals. ∆ff, the final, equilibrium frequency shift corresponding to the saturation of the surface with protein molecules, is the same,
−26.5 kHz for both surfaces. However, on the hydrophilic surface, the equilibrium is reached in only 167 min, whereas the result for the hydrophobic surface is more than six times faster (in only 27 min). Very similar adsorption behaviour was observed for all hydrophobic and hydrophilic crystals, with some statistical variance in the ∆ff
values being exhibited. The data for 14 adsorption experiments on hydrophilic quartz, followed by data for 7 experiments of buffer washing of the formed protein layer and 7 adsorption experiments on hydrophobic quartz, followed by data of 5 experiments of buffer washing of the formed protein layer are summarized as a boxplot chart in Figure 5. The mean and median ∆ff final frequency shifts corresponding to the two different surfaces are not significantly different; however the repeatability of the β-casein adsorption experiments is considerably better on hydrophobized quartz
hydrophilic hydrophobic
0 20 40 60 80 100 120 140 160 180
s / °
crystals: the interquartile range is 3, respectively 8 times, and the full range is 6, respectively 3 times narrower in the case of hydrophobic surfaces.
0 20 40 60 80 100 120 140 160 180
-25 -20 -15 -10 -5 0
1.0 0.9 0.8 0.7 0.6 0.5 0.4 0.3 0.2 0.1 0.0
ff
f / kHz
t / min
Figure 4. Typical adsorption curves of β-casein on clean, hydrophilic (□), respectively OTS-coated, hydrophobic (○) quartz crystal in terms of Δf frequency change (left y axis) and the corresponding normalized change (right y axis). Although the final frequency change of the crystal is the same for both cases, the equilibrium can be reached six times faster on a hydrophobic surface. The fitted curves are triple (2), respectively single exponential functions (3).
h-philic, ads. h-philic, ads., PBS h-phobic, ads. h-phobic, ads., PBS 0
10 20 30 40 50
Δff / kHz
Figure 5. Boxplot statistical representation of frequency changes after adsorption of β-casein onto hydrophilic and hydrophobic quartz crystals, followed by PBS wash.
The repeatability is considerably better on hydrophobized quartz crystal surfaces:
The corresponding mean and median ∆ff values are about the same for both surfaces, however, the interquartile range is 3, respectively 8 times, and the full range is 6, respectively 3 times narrower in the case of hydrophobic surfaces.
If the function connecting the obtained ∆ff frequency changes and the change of mass due to the adsorption of protein is known, 1) the expected frequency change upon adsorption of a protein monolayer can be predicted if information about the structure of such a monolayer is available, or inversely, 2) the adsorbed protein mass per unit area (surface concentration, also surface excess, Γ) can be estimated.
The Sauerbrey equation (1) [28] can be used to obtain a rough estimate for the surface concentration of the adsorbed β-casein layer. The median frequency shift after the adsorption of the protein to hydrophilic surfaces was −27.2 kHz, and
decreased to −19.7 kHz after rinsing with the buffer. Similarly, the median frequency shift after the adsorption to hydrophobic surfaces was −27.4 kHz, and decreased to
−24.2 kHz after rinsing with the buffer. Using these values, as well as A = 1.33 cm2 for the area of the resonator quartz crystal, ρ = 2.648 g/cm3 for the density of quartz, and μ = 2.947×10¹¹ g·cm−1·s−2 for the shear modulus of an AT-cut quartz crystal, f0 = 20 MHz base frequency, and n = 49th overtone, surface concentrations ranging from 4.4 to 6.2 mg/m2 were calculated, as listed in Table 2. It is interesting to compare this result estimate with the results of other researchers. The adsorption of β-casein onto various surfaces has been studied intensively by various methods such as the QCM, ellipsometry, neutron reflectivity, surface plasmon resonance and field-effect
transistor. The surface concentration and thickness of the adsorbed layer, the
adsorption rate and the layer stability have been found to depend on multiple factors such as surface chemical nature of the substrate, pH and ionic strength of the
solution and concentration of the protein. A comprehensive list of the found surface concentrations, the experimental conditions and references is given in the
Supplementary material. The surface concentration calculated from optical
measurement methods is usually about 20-25% of the value calculated from quartz crystal resonator based mass determination. The general explanation for this is that optical methods measure the optically dense part of the layer only (“dry mass”), whereas QCM senses the whole layer, with entrapped water and counter ions, and also the viscosity of the layer (“wet mass”). Our calculated surface concentrations fit well in the course of QCM-based literature data (Figure 6), which is also an indication that the Sauerbrey equation, applicable strictly speaking only for rigid, well-adhered layers in air, is a suitably good approximation also for the EMPAS quartz crystal oscillating in liquid, with viscoelastic protein layer adsorbed.
(1)
Table 2. Median frequency shifts after adsorption of β-casein on hydrophilic, bare quartz, and hydrophobic, silanized quartz, respectively after rinsing with the buffer, and the corresponding surface concentrations calculated from (1).
quartz surface / kHz Γ / (mg/m2) hydrophilic, ads. 27.2 6.1 hydrophilic, ads., PBS 19.7 4.4 hydrophobic, ads. 27.4 6.2 hydrophobic, ads., PBS 24.2 5.4
Figure 6. Surface concentration (Γ) of β-casein layers deposited onto different
substrates as a function of solution concentration (c). Literature QCM/TSM data and own results are presented (see the legend). Filled symbols: after β-casein deposition;
open symbols: after rinsing with buffer following the deposition. Blue: hydrophilic surfaces; red: hydrophobic surfaces; green: chemical bounds formed. Fitted curves are adsorption isotherms (thin curve: Langmuir; thick curve: Langmuir–Freundlich).
The two different, hydrophilic and hydrophobic surfaces can be compared favourably in terms of the fitting parameters of the β-casein adsorption, and for this, the
appropriate adsorption model has to be found. Krisdhasima et al. [33] suggested a two-step mechanism for the irreversible adsorption of proteins expressed in the form of a double exponential equation with two time constants. However, we found that, in the case of hydrophobic quartz, our adsorption data can be well-fitted with a single exponential decay curve with only one time constant (2), while in the case of
hydrophilic quartz, only fitting of three time constants lead to acceptable residuals (3).
The fitting parameters are listed in Table 3. Our experimental observations are well quantified by the fact that the obtained first time constant τ1 is almost five times larger for hydrophobic than for hydrophilic quartz. The difference between the adsorption mechanisms suggested by these single, respectively triple exponential decays are in agreement with the previous knowledge on the β-casein adsorption to and monolayer structure at the solid/liquid interface. On hydrophobic surfaces, the hydrophobic part of the molecule is readily adsorbed, leaving the hydrophilic part extending into the liquid. On hydrophilic surfaces however, conformational changes likely follow the adsorption step. It is interesting to compare our results with the results of
Krisdhasima et al. For a slightly silanized surface (0.67 mM silanizer used), their first time constant equals 100.6 s, whereas for a heavily silanized surface (6.7 mM silanizer used), equals 196.1 s. The 2.5 mM concentration of our silanizer solution
0 200 400 600 800 1000
0 1 2 3 4 5 6 7 8
[29]
[30]
[31]
[32]
this work
G / (mg/m2 )
c / (mg/L)
falls between the ones used by these authors, and, consequently, so does our
determined time constant: τ1 = 148.0 s. In spite of this apparent correlation, the trend suggested by Krisdhasima et al., that lower alkyl chain surface density leads to higher adsorption rate, unfortunately contradicts both our findings on hydrophilic quartz and the conclusions of other researchers.
(2)
(3)
Table 3. Fitting parameters of the adsorption of β-casein on hydrophilic, bare quartz, and hydrophobic, silanized quartz, respectively.
substrate fitting parameters
τ1 τ2 τ3 ∆f1 ∆f2 ∆f3 ∆ff
s kHz
hydrophilic surface 712.6 7044.2 68.0 8.30 12.53 9.53 −29.55 hydrophobic surface 148.0 – – 30.35 – – −26.44
Our β-casein adsorption results are in good agreement with previous findings that β- casein adsorbs 9 to 11 times faster on hydrophobized silica than on hydrophilic, bare silica [34]. Fragneto et al. elucidated the structure of the β-casein layer adsorbed on silanized silicon by neutron reflectivity. The experimental data could be fitted by a model in which the β-casein layer is composed of a dense, 2.3 nm thick inner layer close to the substrate, and a loose, 3.5 nm thick outer layer extending into the liquid [35]. It is also generally accepted that large biomolecules and especially proteins responsible for the fouling and the consequent biocorrosion of water-immersed objects such as pipes, piers, ships tend to adsorb on hydrophobic, rather than
hydrophilic surfaces. In this sense, the formation of an octadecylphosphonic acid self- assembled monolayer at the surface of both stainless steel and titanium proved to be indispensable for the successful immobilization of a PEO–PPO–PEO layer that, by its turn, could prevent the adhesion of bovine serum albumin (BSA), fibrinogen and cytochrome C [36].
The superior behaviour of the β-casein layer on the hydrophobised quartz resonator surfaces revealed itself also in the course of the plasmin detection experiments. Hydrophilic quartz crystals often showed sudden, unexpected frequency jumps and drifts later associated with evidence of the nucleation and growth of air bubbles at the interface, which likely altered to hydrophobic character upon the adsorption of the protein layer. In contrast, no air bubble nucleation was observed with hydrophobic crystal surfaces, probably because the interface changed to the hydrophilic case upon the adsorption of the protein layer. The overall
repeatability of the results and the stability of the system were incomparably better with silanized quartz crystals.
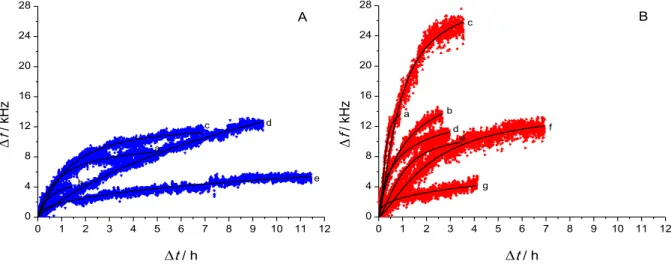
Upon the introduction of plasmin, the frequency rises in a sigmoidal manner, which we attribute to the cleavage of the surface-bound β-casein substrate and the consecutive desorption and wash away of the reaction products (Figure 7). With respect to such a curve, the region of interest is the steepest, apparently linear portion, indicating that in this region the reaction follows zero order kinetics with respect to the surface concentration of the protein. The determination of this
(reaction) rate in principle could be done by a simple first order differentiation;
however, due to the noise present in the measurement data, such a procedure does not lead to any useful outcome. Another possibility would be to perform a linear fit to this apparently linear region, but the drawback of doing so is the obvious uncertainty introduced when judging the appropriate range to be fitted. To circumvent these problems, a Hill equation (4) was used to fit each dataset corresponding to a certain plasmin concentration, and these fitted curves were then numerically differentiated.
The equation itself originates from the field of biochemistry [37], but here we used it in a context other than the original concept. ∆ff is the final frequency shift (the plateau value) after plasmin cleavage, and k and n are fitting parameters.
0 1 2 3 4 5 6 7 8 9 10 11 12
0 4 8 12 16 20 24 28
f / kHz
t / h
a b
c d
e
A
0 1 2 3 4 5 6 7 8 9 10 11 12
0 4 8 12 16 20 24
28 B
f / kHz
t / h
a b
c
de f
g
Figure 7. Time course curves of plasmin activity on β-casein at different plasmin concentrations, measurement points and fitted Hill curves. A) hydrophilic, native quartz crystal: a) 10 nM; b) 5 nM; c) 1 nM; d) 500 pM; e) 100 pM; B) hydrophobic, silanized quartz crystal: a) 10 nM; b) 3.16 nM; c) 1.78 nM; d) 1 nM; e) 316 pM;
f) 100 pM; g) 31.6 pM. For easier comparison of the results achieved on hydrophilic and hydrophobic crystals, graphs are plotted on identical scales.
(4)
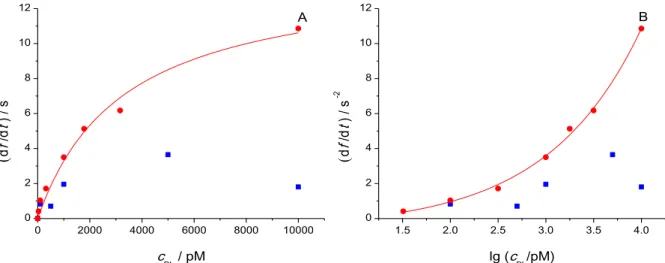
The final calibration curves were constructed by plotting the thus determined (df/dt)max values against the different plasmin concentrations, or their logarithm, respectively (Figure 8). It was not the goal of this work to resolve the whole, presumably complex, kinetics of the system, yet, fitting a meaningful theoretical model was tempting. Such a system deviates considerably from the scope of the Michaelis–Menten approximation in several senses: 1) The determined rate of
frequency shift might not necessarily be linearly proportional to the reaction rate, as it is known that bulk viscosity, interfacial viscoelasticity, molecular slip at the interface play also an important role besides mass change. 2) According to Fick’s laws, with lower and lower bulk plasmin concentrations, the diffusion plays more and more important role, the longer it takes to reach a steady interfacial enzyme concentration.
3) The desorption of the reaction products might not be a negligible process either.
4) There are clear signs that the frequency does not reach its original value before casein adsorption, but it is not known whether this is due to a) uncleaved casein or
b) reaction product residues that stay bound to the interface. 5) There is a continuous supply of fresh enzyme and a continuous wash away of the reaction products by the flow.
0 2000 4000 6000 8000 10000
0 2 4 6 8 10
12 A
df /dt ) / s-2
cPL / pM
1.5 2.0 2.5 3.0 3.5 4.0
0 2 4 6 8 10
12 B
df /dt ) / s-2
lg (c
PL/pM)
Figure 8. df/dt rates of initial frequency change determined at different cPL plasmin concentrations for hydrophilic (■) and hydrophobic (●) quartz crystal surfaces, respectively, representation in linear (A) and logarithmic (B) concentration scale.
Ohtsuka et al. developed an assay for plasmin determination by cyclic voltammetry based on a ferrocene-tagged peptide substrate layer [16]. The experimental data were treated along the kinetic model of Nayak et al. [38], a slightly modified Michaelis–Menten (MM) model. The model operates with the well-known set of chemical equations involving the enzyme (E), substrate (S) and product (P), and the associative (ka), dissociative (kd) and catalytic (kcat) rate constants (5). Then, the steady state approximation for the [ES] concentration of the intermediate complex is used together with the mass conservation criteria for the enzyme. One deviation from the classical derivation of the MM equation is that instead of volume concentrations, surface concentrations (Γ) are used for the surface-bound compounds. The second deviation is the assumption that within the given experimental conditions the [E]
equilibrium enzyme concentration can be substituted with its initial concentration cE,0. Thus, the final expression for heterogeneous catalytic reaction rate is given as (6).
This expression predicts linear dependence of the reaction rate on both initial
enzyme concentration and ΓS surface concentration of substrate. However, the linear relationship clearly does not hold for our asymptotically curving data points.
(5)
(6)
Instead, inspired by the recent work of Kari et al. [39], an inverse MM type equation (7) has been used to fit the calibration plot for hydrophobic quartz surface. As clearly explained and supported by numerical simulations by Bajzer and Strehler [40], an inverse MM equation, in which the concentration of the enzyme and the substrate are interchanged, often can be used with good approximation in systems where the reactant in high excess is the enzyme (rather than the substrate, as in the ordinary
MM model). The enzyme and the substrate concentration cannot be automatically interchanged in any enzyme-in-excess situation, because the involved chemical equations are not symmetrical with respect to the two reactants: E appears also as product, whereas S does not. The key difference in the derivation of the inverse MM equation is that, along with the same steady state approximation for [ES] as in ordinary MM, the mass conservation for S, rather than E should be formulated. (For further details, see the cited references.) Thus, we obtain an equation that is formally identical to the ordinary MM equation, but with cPL as independent variable and ΓS is merged into the constant vmax. The fitting of this equation to the calibration plot for hydrophobic quartz yielded vmax =14.11 s−2 and c1/2=3292 pM (Figure 8A). The data obtained with hydrophilic quartz crystals is loaded with uncertainties as discussed above, thus fitting was not attempted. In Figure 8B, the same data is presented against a logarithmic concentration scale. In this case, a simple exponential curve was fitted.
(7)
Knowing the volume of the cell, for each enzyme concentration the NPL/Nβ-casein ratio can be calculated, where N stands for number of the respective molecules. Similarly, the flow rate of the enzyme molecules can be determined. The results of these calculations are listed in Table 4. Knowing these numbers, the observed applicability of the inverse MM equation becomes less self-evident: There is a high protein
(substrate) excess, rather than an enzyme excess in the whole concentration range of the experiments. Moreover, the excess of the substrate manifested during the enzymatic cleavage in fact must be even much higher, considering that the substrate is trapped at the interface and is reached by only a fraction of the enzyme molecules moving freely in the liquid.
Table 4. Plasmin concentration in pM and its logarithm, number of plasmin molecules in the cell, number of β-casein molecules adsorbed to the quartz crystal/liquid
interface estimated from the Sauerbrey equation, ratio of plasmin to β-casein molecules and the flow rate of plasmin molecules at different concentration.
cPL/pM lg(cPL/pM) NPL Nβ-casein NPL/Nβ-casein qPL/s−1 10000 4.00 4.8×10¹¹ 2.0×10¹³ 2.4×10⁻² 3.5×10⁹
3162 3.50 1.5×10¹¹ 2.0×10¹³ 7.5×10⁻³ 1.1×10⁹ 1778 3.25 8.5×10¹⁰ 2.0×10¹³ 4.2×10⁻³ 6.2×10⁸ 1000 3.00 4.8×10¹⁰ 2.0×10¹³ 2.4×10⁻³ 3.5×10⁸ 316 2.50 1.5×10¹⁰ 2.0×10¹³ 7.5×10⁻⁴ 1.1×10⁸ 100 2.00 4.8×10⁹ 2.0×10¹³ 2.4×10⁻⁴ 3.5×10⁷ 32 1.50 1.5×10⁹ 2.0×10¹³ 7.5×10⁻⁵ 1.1×10⁷
The initial reaction rates measured on hydrophobic quartz crystals are much larger than the ones obtained on hydrophilic crystals. In the light of those discussed above, a plausible explanation for this is evident: On the hydrophobic quartz surface,
β-casein molecules are adsorbed by their hydrophobic domains, while the hydrophilic ones are extended into the liquid, exposing most of the enzyme specific cleavage
sites. In contrast, for the case of hydrophilic quartz, because both the quartz surface and the adjacent liquid is hydrophilic, the molecules have to adopt a conformation which might hinder the access of the enzyme to some of the cleavage sites. In turn, the number of the accessible cleavage sites will determine the rate of mass loss, and hence, frequency rise.
4. Conclusions
The plasmin concentration in bovine milk is in the nM range, however, the acoustic wave method demonstrated here can determine plasmin in almost three orders of magnitude lower concentrations (pM range), hence it is suitable for measurements even after purification treatment of the milk. The obtained calibration data points follow an inverse Michaelis–Menten curve. Compared to the state of the art ELISA, UV-VIS and chromatographic methods of plasmin measurement, the presented method is fast: Although relatively long time course curves are presented in this work, only the first minutes are needed for the determination of the initial reaction rate, and hence, the concentration. Further optimization of measurement parameters (e.g. flow rate, casein surface coverage, modification of substrate) to enhance the sensitivity of the method is in progress.
Acknowledgements
This work was supported by the European Commission within the project Innovative technology for the detection of enzyme activity in milk (FORMILK) under grant
agreement number 690898 /H2020-MSCA-RISE-2015, the National Competitiveness and Excellence Program Hungary (NVKP_16-1-2016-0007), and the
BIONANO_GINOP-2.3.2-15-2016-00017 project. This work is also the result of the project implementation ITMS 26240120007 supported by the OPRAD funded by the ERDF.
References
[1] P. Walstra, T.M. Wouters, T.J. Geurts, Dairy Science and Technology, second ed., CRC Press, Taylor & Francis Group Group, Boca Raton, FL, 2006.
[2] A.K. Dunker, J.D. Lawson, C.J. Brown, R.M. Williams, P. Romero, J.S. Oh, C.J. Oldfield, A.M. Campen, C.M. Ratliff, K.W. Hipps, J. Ausio, M.S. Nissen, R. Reeves, C. Kang, C.R. Kissinger, R.W. Bailey, M.D. Griswold, W. Chiu, E.C. Garner, Z. Obradovic, Intrinsically disordered protein, J. Mol. Graph.
Model. 19 (2001) 26–59.
[3] P. Tompa, Instrinsically unstructured proteins, Trends Biochem. Sci. 27 (2002) 527–533.
[4] H.E. Swaisgood, Chemistry of milk protein, in: P.F. Fox (Ed.), Developments in Dairy Chemistry. I. Proteins Applied Science, London, 1982, pp. 1–59.
[5] C. Cragnell, J. Choi, M. Segad, S. Lee, L. Nilsson, M. Skepö, Bovine β-casein has a polydisperse distribution of equilibrium micelles, Food Hydrocolloid. 70 (2017) 65–68.
[6] M.C. Drinane, J.A. Sherman, A.E. Hall, M. Simons, M.J. Mulligan-Kehoe, Plasminogen and plasmin activity in patients with coronary artery disease, J.
Thromb. Haemost. 4 (2006) 1288–1295.
[7] N. Datta, A.J. Elliott, M.L. Perkins, H.C. Deeth, Ultra-high-temperature (UHT) treatment of milk: Comparison of direct and indirect modes of heating, Aust. J.
Dairy Technol. 57 (2002) 221–227.
[8] B.M. Prado, S.E. Sombers, B. Ismail, K.D. Hayes, Effect of heat treatment on the activity of inhibitors of plasmin and plasminogen activators in milk, Int.
Dairy J. 16 (2006) 593–599.
[9] C.M. Ferrier, H.H. de Witte, H. Straatman, D.H. van Tienoven, W.L. van Geloof, F.J.R. Rietveld, C.G.J. Sweep, D.J. Ruiter,
G.N.P. van Muijen, Comparison of immunohistochemistry with immunoassay (ELISA) for the detection of components of the plasminogen activation system in human tumour tissue, Brit. J. Cancer 79 (1999) 1534–1541.
[10] P. Holvoet, A. de Boer, M. Verstreken, D. Collen, An enzyme-linked immunosorbent assay (ELISA) for the measurement of plasmin-α-2-
antiplasmin complex in human plasma – application to the detection of in vivo activation of the fibrinolytic system, Thromb. Haemostasis 56 (1986) 124–127.
[11] J.C. Collin, P. Compagnone, I. Ryba, A. Baer, Determination of plasmin (alkaline milk proteinase) and chymosin in milk products by the ELISA assay, Lait 68 (1998) 235–240.
[12] N.A. Andreani, L. Carraro, L. Fasolato, S. Balzan, R. Lucchini, E. Novelli, B. Cardazzo, Characterisation of the thermostable protease AprX in strains of Pseudomonas fluorescens and impact on the shelf-life of dairy products:
preliminary results, Ital. J. Food Safety 5 (2016) 239–244.
[13] T. Virtanen, Y.T. Konttinen, N. Honkanen, M. Härkönen, T. Tervo, Tear fluid plasmin activity of dry eye patients with Sjögren’s syndrome, Acta Ophthalmol.
Scan. 75 (1997) 137–141.
[14] H.K. Mousavi, Z.M. Nikougoftar, Preparation of plasminogen by affinity chromatography, Iran. J. Blood Cancer 6 (2014) 165–168.
[15] M. Dahlborn, G. Ahlborg, B. Söderborg, J. Virgin, B. Wilczek, Gamma camera detection of 99mTC-plasmin in the diagnosis of deep-vein thrombosis, Eur. J.
Nucl. Med. 9 (1984) 499–501.
[16] K. Ohtsuka, I. Maekawa, M. Waki, S. Takenaka, Electrochemical assay of plasmin activity and its kinetic analysis, Anal. Biochem. 385 (2009) 293–299.
[17] G. Castillo, K. Pribransky, G. Mező, L. Kocsis, A. Csámpai, K. Németh,
Z. Keresztes, T. Hianik, Electrochemical and photometric detection of plasmin by specific peptide substrate, Electroanal. 27 (2015) 789–798.
[18] A. Poturnayova, I. Karpisova, G. Castillo, G. Mező, I. Kocsis, A. Csámpai, Z. Keresztes, T. Hianik, Detection of plasmin based on specific peptide substrate using acoustic transducer, Sensor. Actuat. B–Chem. 223 (2016) 591–598.
[19] M. Thompson, S.M. Ballantyne, L.E. Cheran, A.C. Stevenson, C.R. Lowe, Electromagnetic excitation of high frequency acoustic waves and detection in the liquid phase, Analyst 128 (2003) 1048–1055.
[20] S.M. Ballantyne, M. Thompson, Superior analytical sensitivity of
electromagnetic excitation compared to contact electrode instigation of transverse acoustic waves, Analyst 129 (2004) 219–224.
[21] D.G. Schmidt, T.A.J. Payens, The evaluation of positive and negative
contributions to the second virial coefficient of some milk proteins, J. Colloid Interf. Sci. 39 (1972) 655–662.
[22] M.R. García-Risco, I. Recio, E. Molina, R. López-Fandiño, Plasmin activity in pressurized milk, J. Dairy Sci. 86 (2003) 728–734.
[23] D.L. Schroeder, S.S. Nielsen, K.D. Hayes, The effect of raw milk storage temperature on plasmin activity and plasminogen activation in pasteurized milk, Int. Dairy J. 18 (2008) 114–119.
[24] K. Kolev, I. Léránt, K. Tenekejiev, R. Machovich, Regulation of fibrinolytic activity of neutrophil leukocyte elastase, plasmin, and miniplasmin by plasma protease inhibitors, J. Biol. Chem. 269 (1994) 17030–17034.
[25] Jung MH, Choi HS, Characterization of octadecyltrichlorosilane self-
assembled monolayers on silicon (100) surface, Korean J. Chem. Eng. 26 (2009) 1778–1784.
[26] Mirji SA, Octadecyltrichlorosilane adsorption kinetics on Si(100)/SiO2 surface:
contact angle, AFM, FTIR and XPS analysis, Surf. Interface Anal. 38 (2006) 158–165.
[27] Kelkar SS, Chiavetta D, Wolden CA, Formation of octadecyltrichlorosilane (OTS) self-assembled monolayers on amorphous alumina, Appl. Surf. Sci. 282 (2013) 291–296.
[28] G. Sauerbrey, Verwendung von Schwingquarzen zur Wägung dünner Schichten und zur Mikrowägung, Z. Phys. 155 (1959) 206–222.
[29] T. Goda, Y. Miyahara, Interpretation of protein adsorption through its intrinsic electric charges: A comparative study using a field-effect transistor, surface plasmon resonance, and quartz crystal microbalance, Langmuir 28 (2012) 14730−14738.
[30] L. Pérez-Fuentes, C. Drummond, J. Faraudo, D. Bastos-González, Adsorption of milk proteins (β-casein and β-lactoglobulin) and BSA onto hydrophobic surfaces, Materials 10 (2017) 893.
[31] J. Sotres, A. Barrantes, L. Lindh, T. Arnebrant, Strategies for a direct
characterization of phosphoproteins on hydroxyapatite surfaces, Caries Res.
48 (2014) 98–110.
[32] J. Yao, C. Lin, T. Tao, F. Lin, The effect of various concentrations of papain on the properties and hydrolytic rates of β-casein layers, Colloid. Surface. B 101 (2013) 272–279.
[33] V. Krisdhasima, P. Vinaraphong, J. McGuire, Adsorption kinetics and elutability of α-lactalbumin, β-casein, β-lactoglobulin, and bovine serum albumin at hydrophobic and hydrophilic interfaces, J. Colloid Interf. Sci. 161 (1993) 325–334.
[34] T. Kull, T. Nylander, F. Tiberg, N.M. Wahlgren, Effect of surface properties and added electrolyte on the structure of β-casein layers adsorbed at the
solid/aqueous interface, Langmuir 13 (1997) 5141–5147.
[35] G. Fragneto, R.K. Thomas, A.R. Rennie, J. Penfold, Neutron reflection study of bovine beta-casein adsorbed on OTS self-assembled monolayers, Science 267 (1995) 657–660.
[36] Y. Yang, C. Poleunis, L. Románszki, J. Telegdi, C.C. Dupont-Gillain,
Adsorption of a PEO–PPO–PEO triblock copolymer on metal oxide surfaces with a view to reduce protein adsorption and further biofouling, Biofouling 29 (2013) 1123–1137.
[37] A.V. Hill, The possible effects of the aggregation of the molecules of hæmoglobin on its dissociation curves, J. Physiol. 40 Suppl. (1910) iv–vii.
[38] S. Nayak, W.S. Yeo, M. Mrksich, Determination of kinetic parameters for interfacial enzymatic reactions on self-assembled monolayers, Langmuir 23 (2007) 5578–5583.
[39] J. Kari, M. Andersen, K. Borch, P. Westh, An inverse Michaelis–Menten approach for interfacial enzyme kinetics, ACS Catal. 7 (2017) 4904–4914.
[40] Ž. Bajzer, E.E. Strehler, About and beyond the Henri–Michaelis–Menten rate equation for single-substrate enzyme kinetics, Biochem. Biophys. Res.
Commun. 417 (2012) 982–985.
Figure Legends
Figure 1. Scheme of the experimental setup.
Figure 2. Typical frequency–time plot during an experiment. AB: baseline stabilization; BC: stable baseline; CD: adsorption of β-casein; DE: adsorption completed; EF: washing with buffer; FG: partial cleavage of β-casein layer by
plasmin. In this particular experiment, hydrophobized quartz crystal and 1 nM plasmin was used.
Figure 3. Static water contact angles of cleaned, hydrophilic, and silanized,
hydrophobic quartz crystal sensors; boxplot representation of nine measurements on each surface type (3 separate measurements on each of the 3 parallel samples) in the whole, 0–180° domain. The boundary between the hydrophilic and hydrophobic region is marked at 90°. Inset illustrations are typical images of droplets.
Figure 4. Typical adsorption curves of β-casein on clean, hydrophilic (□), respectively OTS-coated, hydrophobic (○) quartz crystal in terms of Δf frequency change (left y axis) and the corresponding normalized change (right y axis). Although the final frequency change of the crystal is the same for both cases, the equilibrium can be reached six times faster on a hydrophobic surface. The fitted curves are triple (2), respectively single exponential functions (3).
Figure 5. Boxplot statistical representation of frequency changes after adsorption of β-casein onto hydrophilic and hydrophobic quartz crystals, followed by PBS wash.
The repeatability is considerably better on hydrophobized quartz crystal surfaces:
The corresponding mean and median ∆ff values are about the same for both surfaces, however, the interquartile range is 3, respectively 8 times, and the full range is 6, respectively 3 times narrower in the case of hydrophobic surfaces.
Figure 6. Surface concentration (Γ) of β-casein layers deposited onto different
substrates as a function of solution concentration (c). Literature data, QCM/TSM and own results are presented (see the legend). Filled symbols: after β-casein deposition;
open symbols: after rinsing with buffer following the deposition. Blue: hydrophilic surfaces; red: hydrophobic surfaces; green: chemical bounds formed. Fitted curves are adsorption isotherms (thin curve: Langmuir; thick curve: Langmuir–Freundlich).
Figure 7. Time course curves of plasmin activity on β-casein at different plasmin concentrations, measurement points and fitted Hill curves. A) hydrophilic, native quartz crystal: a) 10 nM; b) 5 nM; c) 1 nM; d) 500 pM; e) 100 pM; B) hydrophobic, silanized quartz crystal: a) 10 nM; b) 3.16 nM; c) 1.78 nM; d) 1 nM; e) 316 pM;
f) 100 pM; g) 31.6 pM. For easier comparison of the results achieved on hydrophilic and hydrophobic crystals, graphs are plotted on identical scales.
Figure 8. df/dt rates of initial frequency change determined at different cPL plasmin concentrations for hydrophilic (■) and hydrophobic (●) quartz crystal surfaces, respectively, representation in linear (A) and logarithmic (B) concentration scale.
Radio Frequency Signal Generator
Oscilloscope
Amplitude Modulation Diode Detector
Lock-in Amplifier
Piezoelectric Quartz Crystral
Parrellel RLC Circuit
Preamplifier Circuit
Computer Fig. 1
0 3 0 6 0 9 0 1 2 0 1 5 0 1 8 0 2 1 0 2 4 0 9 8 5 . 2 0 5
9 8 5 . 2 1 0 9 8 5 . 2 1 5 9 8 5 . 2 2 0 9 8 5 . 2 2 5 9 8 5 . 2 3 0 9 8 5 . 2 3 5 9 8 5 . 2 4 0
F
f / M H z t / m i n
A B C
D E
G
Fig. 2
h y d r o p h i l i c h y d r o p h o b i c
0
2 0 4 0 6 0 8 0 1 0 0 1 2 0 1 4 0 1 6 0 1 8 0
q s / °
Fig. 3
0 2 0 4 0 6 0 8 0 1 0 0 1 2 0 1 4 0 1 6 0 1 8 0 - 2 5
- 2 0 - 1 5 - 1 0 - 5
0
1 . 0 0 . 9 0 . 8 0 . 7 0 . 6 0 . 5 0 . 4 0 . 3 0 . 2 0 . 1 0 . 0
∆ f / k H z ∆ f
f∆ t / m i n
Fig. 4
h - p h i l i c , a d s . h - p h i l i c , a d s . , P B S h - p h o b i c , a d s . h - p h o b i c , a d s . , P B S
0
1 0 2 0 3 0 4 0 5 0
Δ f
f/ k H z
Fig. 5
0 200 400 600 800 1000 0
1 2 3 4 5 6 7 8
[29]
[30]
[31]
[32]
this work
/ (mg/m 2 )
c / (mg/L)
Fig. 6
0 1 2 3 4 5 6 7 8 9 1 0 1 1 1 2
0 4 8
1 2 1 6 2 0 2 4 2 8
∆ f / k H z
∆ t / h
a
b c d e A
Fig. 7A
0 1 2 3 4 5 6 7 8 9 1 0 1 1 1 2
0 4 8
1 2 1 6 2 0 2 4
2 8 B
∆ f / k H z
∆ t / h
a b c d e f
g
Fig. 7B
0 2 0 0 0 4 0 0 0 6 0 0 0 8 0 0 0 1 0 0 0 0
0 2 4 6 8
1 0
1 2 A
( d f /d t ) / s -2 c P L / p M
Fig. 8A
1 . 5 2 . 0 2 . 5 3 . 0 3 . 5 4 . 0
0 2 4 6 8
1 0
1 2 B
( d f /d t ) / s -2
l g ( c P L / p M )
Fig. 8B
Author Biographies
Dr. Loránd Románszki received his PhD in chemistry in 2015 from the Budapest University of Technology and Economics, Hungary. He is a research fellow at the Research Centre of Natural Sciences of the Hungarian Academy of Sciences. He is interested in surface modification, contact angle and wetting, AFM, monolayers, and interfacial enzyme reactions.
Marek Tatarko defended his Master´s Degree thesis in 2015 at Faculty of Mathematics, Physics and Informatics of Comenius University in Bratislava, Slovakia. Since 2015 he has been graduate student of Biophysics at Faculty of Mathematics, Physics and Informatics of Comenius University in Bratislava, Slovakia.
Mengchi Jiao entered department of Chemistry, Nanjing University in 2014 as an undergraduate student and he is now in senior year of his undergraduate study.
Dr. Zsófia Keresztes defended her PhD thesis in 2001 at the Faculty of Chemical Engineering at the Technical University of Budapest, Hungary. She is a senior research fellow at the Research Centre of Natural Sciences of the Hungarian Academy of Sciences. Her work is focusing on surface science of biological thin filmsand the application of electrochemical sensors in different biological environments.
Professor Tibor Hianik defended his PhD thesis in 1979 and D.Sc. thesis in 1987 at Faculty of Physics of M.V. Lomonosov Moscow State University. Since 1989 he has been full professor of Biophysics at Faculty of Mathematics, Physics and Informatics of Comenius University in Bratislava, Slovakia. Currently is Head of Biophysics Laboratory of the Department of Nuclear Physics and Biophysics. The field of his interests involves biophysics of biomembranes and model membranes, nanomaterials and biosensors. He is member of editorial board of Bioelectrochemistry (Elsevier).
Professor Michael Thompson obtained his undergraduate degree from the Univer-sity of Wales, UK and his PhD in analytical chemistry from McMaster University.In 1971, he was appointed Lecturer in Instrumental Analysis at Loughborough Uni-versity. He then moved to the University of Toronto where he is now Professorof Bioanalytical Chemistry. He has held a number of
distinguished research postsincluding the Leverhulme Fellowship at the University of Durham and the ScienceFoundation Ireland E.T.S Walton Research Fellowship at the Tyndall National Insti- tute, Cork City. He is recognized internationally for his pioneering work over manyyears in the area of research into new biosensor technologies and the surface chem-istry of biochemical and
biological entities. Thompson has served on the EditorialBoards of a number of major international journals including Analytical Chemistryand The Analyst and is currently Editor-in-Chief of the monograph series “DetectionScience” for the Royal Society of Chemistry, UK. He has been awarded many presti-gious international prizes for his research including The Robert Boyle Gold Medal ofthe Royal Society of Chemistry and the E.W.R. Steacie Award of the Chemical Society of Canada. He was made a Fellow of the Royal Society of Canada in 1999.
*Author Biographies
Supplementary Material
Click here to download Supplementary Material: Romanszki_supplementary material.doc