ORIGINAL ARTICLE
Overexpression of BLM promotes DNA damage and increased sensitivity to platinum salts in
triple-negative breast and serous ovarian cancers
N. J. Birkbak1,2†, Y. Li2†, S. Pathania2†, A. Greene-Colozzi2, M. Dreze2, C. Bowman-Colin2, Z. Sztupinszki1, M. Krzystanek1, M. Diossy1, N. Tung3, P. D. Ryan4, J. E. Garber2, D. P. Silver2,3, J. D. Iglehart2,5, Z. C. Wang2,5, D. Szuts6, Z. Szallasi1,7*‡& A. L. Richardson2,5*‡
1Department of Bio and Health Informatics, Technical University of Denmark, Lyngby, Denmark;2Dana-Farber Cancer Institute, Harvard Medical School, Boston;
3Beth Israel Deaconess Medical Center, Harvard Medical School, Boston;4Texas Oncology, The Woodlands;5Brigham and Women’s Hospital, Harvard Medical School, Boston, USA;6Institute of Enzymology, Research Center for Natural Sciences, Hungarian Academy of Sciences, Budapest, Hungary;7Computational Health Informatics Program (CHIP) Boston Children’s Hospital Harvard Medical School, Boston, USA
*Correspondence to: Prof. Zoltan Szallasi, Computational Health Informatics Program (CHIP) Boston Children’s Hospital, Harvard Medical School, 300 Longwood Ave., Boston, MA 02215, USA. Tel:þ1-617-355-2179; E-mail: Zoltan.szallasi@childrens.harvard.edu
Dr Andrea L. Richardson, Department of Pathology, Johns Hopkins Medicine, Sibley Memorial Hospital, 5255 Loughboro Rd. NW, Washington, DC 20016, USA.
Tel:þ1-202-660-6309; E-mail: aricha58@jhmi.edu
†These primary authors contributed equally to this work.
‡These senior authors contributed equally to this work.
Background:Platinum-based therapy is an effective treatment for a subset of triple-negative breast cancer and ovarian cancer patients. In order to increase response rate and decrease unnecessary use, robust biomarkers that predict response to therapy are needed.
Patients and methods:We performed an integrated genomic approach combining differential analysis of gene expression and DNA copy number in sensitive compared with resistant triple-negative breast cancers in two independent neoadjuvant cisplatin-treated cohorts. Functional relevance of significant hits was investigatedin vitroby overexpression, knockdown and targeted inhibitor treatment.
Results:We identified two genes, the Bloom helicase (BLM) and Fanconi anemia complementation group I (FANCI), that have both increased DNA copy number and gene expression in the platinum-sensitive cases. Increased level of expression of these two genes was also associated with platinum but not with taxane response in ovarian cancer. As a functional validation, we found that overexpression of BLM promotes DNA damage and induces sensitivity to cisplatin but has no effect on paclitaxel sensitivity.
Conclusions:A biomarker based on the expression levels of theBLMandFANCIgenes is a potential predictor of platinum sensitivity in triple-negative breast cancer and ovarian cancer.
Key words:platinum-based chemotherapy, gene expression-based predictor of treatment sensitivity, triple-negative breast cancer, ovarian cancer
Introduction
BRCA1 plays an important role in response to replication stress and repair of stalled or collapsed replication forks, and complete absence of functional BRCA1 leads to defective error-free
homologous recombination-type double strand break repair.
BRCA1/ tumors are particularly sensitive to platinum- containing chemotherapy and inhibitors of Poly [ADP-ribose]
polymerase 1 (PARP1), whereas BRCA wild-type cancers showed
Downloaded from https://academic.oup.com/annonc/article-abstract/29/4/903/4857262 by Hungary EISZ Consortium user on 05 March 2019
a more limited response to these agents [1]. Platinum salts gener- ate both interstrand and intrastrand cross-links that slow or stall replication forks [2]. Stalled replication forks may collapse into double-strand breaks (DSBs) and/or become sites for transle- sional synthesis-induced mutagenesis, potentially causing gen- ome instability.
Platinum-sensitive triple-negative breast cancers (TNBC) and serous ovarian cancers carry extensive genomic rearrangements and allelic imbalance suggesting these cancers may share similar defects in DNA repair acquired through alternative mechanisms than through BRCA1 loss [3]. The overall level of such genomic aberrations can be characterized and quantified by a recently de- veloped clinical measure, the ‘HRD score’ [3–5]. These results suggest that platinum sensitivity may be related to a functional defect that occurs when BRCA1 levels are insufficient and a bio- marker indicative of such defects may be predictive of sensitivity to DNA cross-linkers such as platinum agents.
To explore and define specific molecular alterations that might be associated with cisplatin sensitivity, we combined differential analysis of gene expression and DNA copy number in cisplatin sensitive compared with cisplatin-resistant TNBC.
Materials and methods Breast cancer cohorts
This study is based on previously published clinical and molecular data from two cisplatin-treated triple-negative breast cancer trials, cisplatin 1 and cisplatin 2 [3, 6]. SNP data are available from the National Center for Biotechnology Information Gene Expression Omnibus (GEO) at GSE28330, and RNA expression data for cisplatin 1 are available GEO at GSE18864.
Data acquisition and data generation
Gene expression data based on the Affymetrix HGU133plus2 platform were generated from a subset of the cisplatin 2 cohort from which suffi- cient material was available as described previously [6] with the exception that the samples were not subjected to double amplification. Data avail- able from GEO at GSE103668. Gene expression data from the ovarian cancer trial OV-01 [7] based on the Affymetrix HGU133A platform were acquired from GEO at GSE15622.
Cell lines
Breast cancer cell lines MDA-MB-231, MDA-MB-436, MDA-MB-453, HCC38, HCC1143, HCC1937 and BT549 were culturedin vitroand sub- jected to DNA damage. Transfections of siRNA and plasmid DNA were performed using Lipofectamine RNAiMAX or Lipofectamine 2000 (Life Technologies), respectively.
For full experimental details, seesupplementary Methods, available at Annals of Oncologyonline.
Results
Identification of genes associated with cisplatin response
We performed a leave-one-out (LOO) differential gene expres- sion analysis in two independent cisplatin-treated TNBC cohorts separately to identify genes significantly associated with response.
Permutation testing identified 12 genes where expression was sig- nificantly associated with platinum response in both cisplatin TNBC cohorts (supplementary Table S1and Figure S1, available atAnnals of Oncologyonline, Figure1A). A similar LOO analysis of the DNA copy numbers were performed. This identified 234 genes associated with cisplatin response in both cisplatin TNBC cohorts (supplementary Table S2 and Figure S1B, available at Annals of Oncologyonline, Figure1B). Only two genes were iden- tified in both analyses for association with platinum sensitivity, the Bloom helicase (BLM) and the Fanconi anemia complemen- tation group I (FANCI) genes, both located at chromosome 15q26. The copy number of both genes was significantly higher in the cisplatin-sensitive tumors in both TNBC cohorts (BLM:
cisplatin-1,P¼0.003, cisplatin-2,P¼0.008,FANCI: cisplatin-1, P¼0.003, cisplatin-2, P¼0.003, supplementary Figure S1C, available atAnnals of Oncologyonline). BothBLMandFANCI showed DNA copy number gain in 33% of sensitive versus 0% of resistant tumors in cisplatin-1, and gain in 44% of sensitive ver- sus 12% of resistant tumors in cisplatin-2. Similarly, in both co- horts cisplatin-sensitive tumors had significantly higherBLMand FANCI mRNA expression (BLM: cisplatin-1, P¼0.0028;
cisplatin-2,P¼0. 0075; Figure1C and D, FANCI: cisplatin-1, P¼0.0036; cisplatin-2,P¼0.0125; Figure1E and F).
As validation, gene expression levels of BLM andFANCIas measured by Affymetrix U133 microarray were significantly cor- related with results obtained by qRT-PCR for the same samples (BLM,r¼0.87; FANCI,r¼0.76;supplementary Figure S1Dand E, available atAnnals of Oncologyonline). Western blot analysis in protein extracts from a series of tumor samples (supplemen- tary Figure S1H, available atAnnals of Oncology online) with matched array-based mRNA measurements showed good correl- ation between mRNA and protein levels for BLM (Spearman r¼0.68, P¼0.0023; supplementary Figure S1F, available at Annals of Oncology online), but not for FANCI (Spearman r¼ 0.01, P¼0.97, supplementary Figure S1G, available at Annals of Oncologyonline).
We found the expression level ofBRCA1transcript as meas- ured by qRT-PCR significantly associated with cisplatin resist- ance [3,6]. When we tested association of the ratio of average of BLMandFANCIlevels divided byBRCA1levels from microarray expression versus cisplatin response, the ratio was significantly higher in the cisplatin-sensitive tumors in both cohorts (cis- platin-1,P¼0.0230; cisplatin-2,P¼0.0023; Figure1G and H).
To further validate these findings, we acquired a publicly avail- able gene expression data set from a serous ovarian cancer trial of either carboplatin monotherapy or paclitaxel monotherapy [7].
The average expression levels ofBLMandFANCIwere signifi- cantly higher in the carboplatin-sensitive ovarian cancers (P¼0.026 andP¼0.036, respectively, Figure1I and J). The ratio ofBLMþFANCI/BRCA1was also significantly higher in carbo- platin-sensitive ovarian cancers (P¼0.026, Figure 1K).
Altogether, these data indicate that the expression levels of BRCA1 are inversely correlated with those ofBLMandFANCI.
Moreover, the association ofBLMandFANCIwith paclitaxel re- sponse was not significant and the trend was in the opposite dir- ection (Figure1L and N), suggesting that the correlations might be cisplatin or drug class specific.
The performance of the ratio ofBLMþFANCI/BRCA1to pre- dict platinum response was also compared with previously
Downloaded from https://academic.oup.com/annonc/article-abstract/29/4/903/4857262 by Hungary EISZ Consortium user on 05 March 2019
published genomic scar or gene expression-based signatures in the cisplatin-1 and cisplatin-2 cohorts. This gene expression ratio per- formed better than the previously published predictors (supple- mentary Figures S2–S4, available atAnnals of Oncologyonline). The BLMþFANCI/BRCA1 expression ratio also performed better in
the platinum monotherapy-treated serous ovarian cancer cohort [7] and a platinum-treated gastric cancer cohort (supplementary Figures S5 and S7, available atAnnals of Oncologyonline), but had no predictive power in non-platinum-treated ovarian cancer sam- ples (supplementary Figure S6, available at Annals of Oncology Gene expression data
A
C D I L
E F J M
G H K N
B
Cisplatin 1 (% significant)
Cisplatin 2 (% significant)
Counts
1 30 60 90 120 >150 1 30 60 90 120 >150
0 20 40 60 80 100
0 20 40 60 80 100
Copy number data
Cisplatin 1 (% significant)
Cisplatin 2 (% significant)
Counts
0 20 40 60 80 100
100 80 60 40 20 0
BLM
FANCI
Cisplat−1
BLM
7.0 7.5 8.0 8.5 9.0 9.5
10.0 P = 0.00278
Cisplat−2
BLM
7 8 9 10 11
12 P = 0.00745
OV01, Carboplatin
BLM
4.0 4.5 5.0 5.5 6.0
6.5 P = 0.026
OV01, Paclitaxel
BLM
4.0 4.5 5.0 5.5 6.0
6.5 P = 0.27
FANCI
6 7 8 9
P = 0.00356
FANCI
7 8 9 10 11
P = 0.012
FANCI
3.5 4.0 4.5 5.0 5.5 6.0 6.5
7.0 P = 0.036
FANCI
3 4 5 6
P = 0.27
BLM+FANCI/BRCA1 1 2 3 4
P = 0.023
BLM+FANCI/BRCA1
1 2 3 4 5 6
P = 0.00227
BLM+FANCI/BRCA1
−0.5 0 0.5 1.0 1.5 2.0 2.5
P = 0.026
BLM+FANCI/BRCA1 0
0.5 1.0 1.5 2.0 2.5
P = 0.54
Resistant Sensitive Resistant Sensitive Resistant Sensitive Resistant Sensitive Figure 1.BLMandFANCIare significantly associated with response to cisplatin chemotherapy. Scatter-plots of LOO analysis in cisplatin-1 and cisplatin-2 cohorts identifiesBLMandFANCIas the only two genes that show significant association with response in both clinical trials, based on both gene expression data (A) and copy number aberration data (B). Red dashed lines indicate significance thresholds based on permutation testing. Color intensity indicates overlapping genes. Association between array expression of BLM, FANCI, and the ratio of BLMþFANCIexpression toBRCA1, and response to cisplatin chemotherapy in cisplatin-1 (C, E, G), cisplatin-2 (D, F, H) and OV01 carboplatin- treated (I, J, K) and OV01 paclitaxel-treated (L, M, N) cohorts. Red dots indicate theBRCA1mutant cases.
Downloaded from https://academic.oup.com/annonc/article-abstract/29/4/903/4857262 by Hungary EISZ Consortium user on 05 March 2019
online). It did not predict response to therapy in non-platinum- treated neoadjuvant triple-negative breast cancer cohorts and it did not have prognostic power in non-platinum-treated breast cancer cohorts (seesupplementary Figures S8–S14, available atAnnals of Oncologyonline).
Relationship of BLM and BRCA1 expression and sensitivity to DNA damaging agents in cell lines
BLM and BRCA1 protein levels were measured in a panel of breast cancer cell lines by Western blot analysis (Figure2A) and densitometry quantitation of expression ratios are displayed inBRCA1
BLM
Actin
A
B C
D E
F G
BT549
HCC1143HCC38MDA231MDA453HCC1937MDA436
IC50 of cisplatin
0 2 4 6 8
IC50 of UV
0 10 20 30 40 50
BT549
HCC1143HCC38MDA231MDA453HCC1937MDA436
IC50 of olaparib
0 5 10 15 20
IC50 of paclitaxel
0.000 0.001 0.002 0.003 0.004
BT549
HCC1143HCC38MDA231MDA453HCC1937MDA436 BT549
HCC1143HCC38MDA231MDA453HCC1937MDA436
BLM FANCI
Actin
Ratio of IC50 Specific/control siRNA 0 0.5 1.0 1.5
Cisplatin Paclitaxel
Scramble-siRNAFANCI-siRNABLM-siRNA
I
BLM+BLMi BLM+siBLM 50nM ControlBLM
K L
IC50 of cisplatin
0 2 4 6 8
BLM+BLMi BLM+siBLM 50nM Control BLM
H
J
BLM HA-tag
Actin
Knockdown of BLM or FANCI in BT549 cells
Overexpression of BLM in MDA231 cells Scramble
siRNA BLM siRNA FANCI siRNA BT549 HCC1143 HCC38 MDA231 MDA453 HCC1937 MDA436
shBRCA1 leads to increase in BLM but not FANCI
shBRCA1 shLuc
BLM BRCA1
GAPDH
shBRCA1 shLuc
FANCI
GAPDH
BT549
HCC1143HCC38MDA231MDA453HCC1937MDA436
BLM/Actin
0 10 20 30 40 50 60
BT549
HCC1143HCC38MDA231MDA453HCC1937MDA436
BRCA1/BLM
0 50 100 150 200 250 300 350
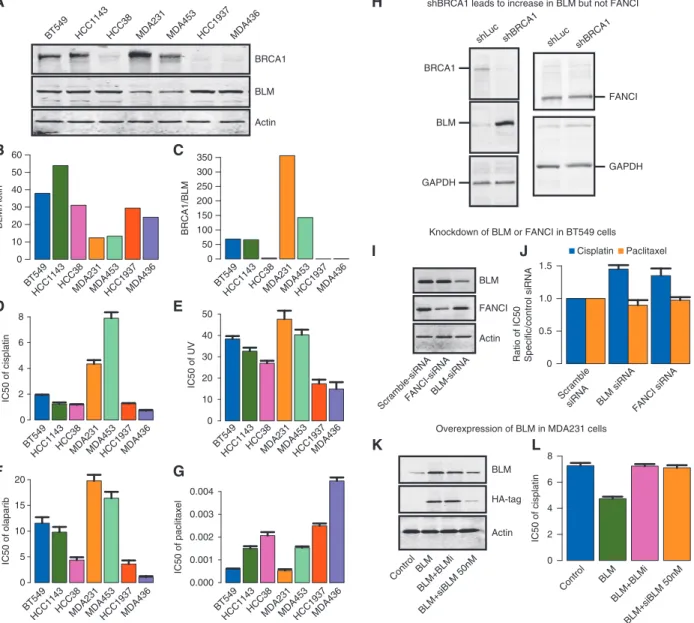
Figure 2.Relationships of BLM, FANCI, and BRCA1 expression levels in breast cancer cell lines and association with therapy sensitivities. (A) Western blot analysis of BLM, BRCA1, and Actin protein abundance in a panel of breast cancer cell lines. BT549, HCC1143, HCC38, MDA231, and MDA453 are BRCA1 wild-type genotype. HCC1937 and MDA436 are BRCA1 mutated (B) Densitometry of Western blot in A for quantifica- tion of BLM/Actin and (C) BRCA1/BLM ratio. (D–G) Bar plots of IC50 to treatments in panel of cell lines. Breast cancer cells lines were irradiated with increasing doses of UV-C or subjected to cisplatin, olaparib or paclitaxel treatment, and 4 weeks later assayed for colony formation. Error bars represent the standard deviation between three independent experiments. (D) IC50 to cisplatin (E) IC50 to UV-C (F) IC50 to PARP-inhibi- tory olaparib (G) IC50 to paclitaxel. (H) Western blot showing the effect of shRNA BRCA1 or shLuciferase control (shLuc) on expression of BLM (left side) and FANCI (right side) in U2OS cells. GAPDH is shown as a loading control. (I) Western blot demonstrating gene-specific siRNA knockdown of BLM or FANCI expression in BT549 breast tumor cells. (J) Bar plots indicate the ratio of IC50for the cisplatin (black bars) and paclitaxel (gray bars) in gene-specific siRNA-treated cells, relative to scramble control siRNA-treated cells. (K) Western blot for endogenous BLM and HA-tag in MDA231 cells transfected with control vector (lane 1), HA-tag BLM cDNA (BLM, lane2), HA-tag BLM co-treated with BLM helicase small molecule inhibitory (BLMþBLMi, lane 3), and HA-tag BLM co-treated with 50 nM siRNA BLM (BLMþsiBLM, lane 4). (L) Bar plots indicate the ratio of IC50for the cisplatin in MDA231 cells treated with control vector (black bar), HA-tag BLM cDNA (BLM, medium gray bar), HA-tag BLM co-treated with BLM helicase small molecule inhibitory (BLMþBLMi, dark gray bar), and HA-tag BLM co-treated with 50 nM siRNA BLM (BLMþsiBLM, light gray bar).
Downloaded from https://academic.oup.com/annonc/article-abstract/29/4/903/4857262 by Hungary EISZ Consortium user on 05 March 2019
bar plots (Figure2B and C). Two cell lines withoutBRCA1se- quence mutations (BT549, HCC1143) and the HCC38 cell line in which BRCA1 expression is suppressed by methylation displayed high BLM/actin and low BRCA1/BLM expression ratios. Two other BRCA1wt cell lines (MDA231 and MDA453) displayed relatively lower BLM/actin and higher BRCA1/BLM expression ratios. On the other hand, HCC1937 and MDA436, which are known to be BRCA1-null, displayed high levels of BLM expres- sion normalized to actin along with very low BRCA1/BLM ex- pression ratios. This cell line panel was evaluated for sensitivity to various treatments by colony formation assay. The three panels of Figure2D–F show that the pattern of sensitivity to cisplatin, UV radiation treatment, and PARP inhibitor olaparib across the panel of cell lines is associated with the pattern of relative expres- sion of BRCA1/BLM and BLM/actin. The two sequence-mutated BRCA1 cell lines and the three cell lines with low BRCA1/BLM and high BLM/actin have greater sensitivity to all three treat- ments. The two cell lines with low BLM and high BRCA1/BLM (MDA231, MDA453) are relatively resistant to the same treat- ments. In contrast, there is no apparent relationship between BLM and BRCA1 expression with the pattern of sensitivity to the microtubule stabilizer paclitaxel (Figure2G). These data suggest that BRCA1/BLM protein ratio may be predictive of the sensitiv- ity to canonical DNA damaging agents (e.g. cisplatin, UV, and olaparib) but not necessarily to agents like paclitaxel that work through distinct mechanisms.
Effect of modulating BRCA1 expression on BLM and FANCI expression
In order to elucidate the correlation between BRCA1, BLM and FANCI expression levels, we knocked down endogenous BRCA1 in U2OS cells in which the role of BRCA1 in the double-strand break repair (DSBR) response has been well studied. After 1 week of treatment following transfection of BRCA1-specific shRNA, the expression of BRCA1, BLM, and FANCI were measured by Western blot analysis (Figure2H). Cells in which BRCA1 was knocked-down showed increased expression of BLM protein compared with control cells treated with shRNA specific to luci- ferase (Figure2H, left panel). Given that BRCA1 is a known nega- tive transcriptional regulator of BLM [8], it is possible that the increase in BLM protein levels in BRCA1 depleted cells is a direct consequence of this negative regulation. On the other hand, the expression levels of FANCI did not change upon knockdown of BRCA1 by shRNA (Figure2H, right panel).
Effect of modulating BLM and FANCI expression on sensitivity to cisplatin and taxanes
Since BLM showed a good correlation between mRNA and pro- tein expression levels and was up-regulated by down-regulation of BRCA1, further functional validation was carried out. We car- ried out knockdown experiments in BT549 breast cancer cells, which inherently express high levels of BLM. Gene-specific siRNA treatment resulted in reduced protein expression of BLM as determined by Western blot (Figure 2I). In these cells, the IC50s for cisplatin and paclitaxel were determined by colony for- mation assay. The knockdown of either BLM or FANCI by siRNA resulted in greater resistance to cisplatin but no significant effect
on sensitivity to paclitaxel (Figure2J). Given that cell cycle state can influence chemosensitivity, we examined whether a change in cell cycle upon BLM and/or FANCI depletion could explain the decreased chemosensitivity to cisplatin. Loss of neither BLM (siBLM) nor FANCI (siFANCI) had a significant effect on the cell cycle state (supplementary Figure S15Aand B, available atAnnals of Oncology online). This further suggests a direct link between BLM and/or FANCI levels and sensitivity to DNA damaging agents.
We tested the reverse hypothesis by overexpressing BLM using an HA-tagged lentivirus expression vector in MDA231 cells, which display low levels of BLM and relative resistance to cisplatin.
Overexpression was assessed by Western blot analysis for endogen- ous BLM or for the HA-tag (Figure2K). In order to address the specificity of this effect, we used siRNA-mediated knockdown of BLM, which reduced the expression levels of both endogenous and HA-tagged BLM protein. We also tested the effect of adding a small molecule inhibitor of BLM (BLMi), which can suppress BLM ac- tivity without affecting BLM protein levels (Figure2K, lanes 3 and 4;supplementary Figure S16, available atAnnals of Oncologyon- line). As shown in Figure2L, overexpression of BLM resulted in decrease in the IC50 (greater sensitivity) to cisplatin. This effect was reversed by treatment with the BLM helicase inhibitor (BLMi) and by siRNA knockdown of BLM. These results suggest that increased BLM expression levels and specifically BLM helicase ac- tivity promotes increased sensitivity to cisplatin.
BLM overexpression increases spontaneous and cisplatin-induced DNA damage
To determine whether BLM expression levels affect the accumula- tion of DNA damage in breast cancer cells, we carried out im- munofluorescence for markers of DNA damage in MDA231 cells in which BLM expression levels or activity was modulated.
Overexpression of BLM resulted in no detectable difference in spontaneous or cisplatin-induced BRCA1 foci but did suppress RAD51 focus formation (supplementary Figure S17, available at Annals of Oncology online). This is consistent with reports that BLM can displace RAD51 localization at damaged replication forks [9]. Since RAD51 is required for homologous recombination- dependent and recombination-independent DSBR mechanisms at stalled replication forks [10], such loss of RAD51 recruitment to sites of DNA damage in BLM overexpressing cells could further ex- plain the increased sensitivity of BLM overexpressing cells to stalled fork-inducing agents like cisplatin (Figure2L).
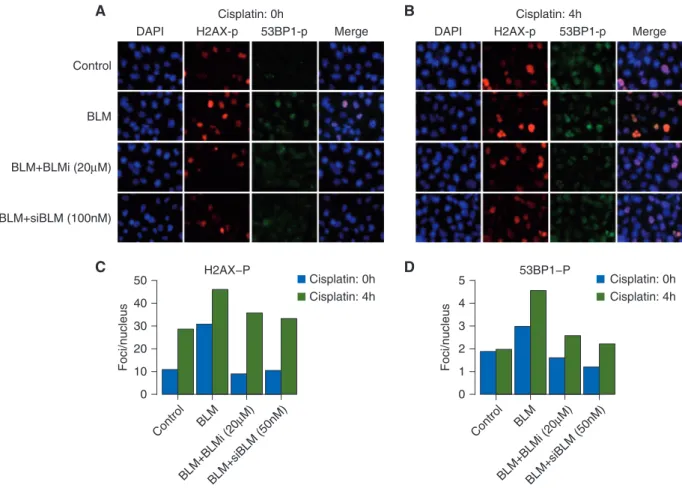
Overexpression of BLM also resulted in increased spontaneous DNA damage as evidenced by increasedc-H2AX and phospho- 53BP1 (53BP1-p) foci in the absence of any drug treatment (sup- plementary Figure S18, available atAnnals of Oncologyonline;
Figure3a, black bars in Figure3C and D). This increase in DNA damage is greater in cells after 4-h treatment with cisplatin (Figure3B, gray bars in Figure3C and D). The addition of a small molecule BLM helicase inhibitor (BLMi) or siRNA to BLM (siBLM) blocks the effect of BLM overexpression on DNA dam- age foci. The accumulation of endogenous DNA damage (as seen by c-H2AX and 53BP1-p foci in untreated cells) as well as cisplatin-induced DNA damage in BLM overexpressing cells, fur- ther explains the increased sensitivity of BLM overexpressing cells to cisplatin (Figure2L).
Downloaded from https://academic.oup.com/annonc/article-abstract/29/4/903/4857262 by Hungary EISZ Consortium user on 05 March 2019
Discussion
In this study, we identified two neighboring genes, BLM and FANCI, with consistent copy gain and overexpression in cisplatin sensitive primary breast tumors. The association between this three-gene signature of high BLMþFANCI/BRCA1 and plat- inum sensitivity was confirmed in an independent cohort of ser- ous ovarian cancer treated with single agent carboplatin.
Throughin vitrostudies, we found that chronic repression of BRCA1 expression in cell lines led to an increase in BLM expres- sion and no change in FANCI expression suggesting a possible compensatory or direct transcriptional effect on BLM in the set- ting of low or insufficient BRCA1. Our findings are consistent with previous reports that BRCA1 regulates transcription ofBLM in prostate cancer cell lines with overexpression of BRCA1 result- ing in down regulation of BLM [8].
BLM has recently been shown to play an important role at stalled replication forks [11, 12]. Unlike BRCA1, which is required for the stability of stalled replication forks, loss of BLM
does not result in its degradation. Instead, BLM has been shown to help restart the stalled forks while suppressing firing of new origins in response to replication stress. An increase in spontan- eous DNA damage, especially accumulation of 53BP1-p foci in BLM overexpressing cells (Figure 3), is suggestive of degrad- ation and/or collapse of spontaneously arising stalled replica- tion forks.
Homologous recombination (HR) is required for repair of cisplatin-induced damage, as the loss of HR factors such as BRCA1 and BRCA2 increases cisplatin sensitivity [13,14]. Both pro- and anti-HR roles have been described for BLM. Its function in DNA end resection and the ability to promote DNA repair syn- thesis in D-loops supports HR, while the disruption of RAD51 filament formation, the disruption of D-loops and the dissol- ution of double Holliday junctions opposes HR [15–18]. One hy- pothesis to explain these results is that at increased BLM levels the anti-HR functions of the protein dominate, leading to increased cisplatin sensitivity.
Control
BLM
BLM+BLMi (20mM)
BLM+siBLM (100nM)
Cisplatin: 0h Cisplatin: 4h
DAPI H2AX-p 53BP1-p Merge DAPI H2AX-p 53BP1-p Merge
H2AX−P
Foci/nucleus
0 10 20 30 40 50
Control BLM
BLM+BLMi (20 mM)
BLM+siBLM (50nM)
53BP1−P
Foci/nucleus
0 1 2 3 4 5
Control BLM
BLM+BLMi (20 mM)
BLM+siBLM (50nM)
Cisplatin: 0h Cisplatin: 4h Cisplatin: 0h
Cisplatin: 4h
A B
D C
Figure 3.Increased DNA damage uponBLMoverexpression in MDA231 cells. MDA231 cells were infected with control vector or HA-tagBLM cDNA (BLM) and co-treated with 20mM BLM small molecule inhibitory (Bi) or 100 nM siBLM (si). Cells were mock treated (cisplatin: 0 h, A) or treated with 10mM cisplatin for 4-h (cisplatin: 4 h, panel B) and released for 24 h. Immunofluorescence for phospho-H2Ax and phospho- 53BP1 was carried out and nuclei counterstained with DAPI. (A) Representative immunofluorescent images for indicated markers in mock treated cells (cisplatin: 0 h) indicating spontaneous DNA damage foci. (B) Representative immunofluorescent image in cells treated with 10mM cisplatin for 4 h (cisplatin: 4 h) indicating drug induced damage foci. All images were obtained at the same magnification and exposure time. All images were analyzed in parallel for each experiment. (C and D) Cells containing foci recognized by relevant antibodies in immuno- fluorescence assays, were identified and counted. At least 100 cells were counted for each category of foci at each time point. Bar plots indi- cate percentages of cells, noted above, that containcH2AX-p foci (C) and PB53-p foci (D) in mock treated cells (cisplatin: 0 h, black bars) and 10mM cisplatin treated cells (cisplatin: 4 h, gray bars).
Downloaded from https://academic.oup.com/annonc/article-abstract/29/4/903/4857262 by Hungary EISZ Consortium user on 05 March 2019
Reduced HR in BLM overexpressing cells should cause im- paired repair of DSBs generated at cisplatin interstrand cross- links. However, cisplatin-induced single-strand lesions are much more common [19]; therefore, the observed damage foci may mostly arise at replication forks that encounter single-strand le- sions. It has been shown previously that RAD51 is required for ef- ficient repair and restart of stalled replication forks in an HR- dependent and HR-independent manner [10]. Disruption of RAD51 filament formation by BLM could antagonize post- replication repair promoted by BRCA1, consistent with a BLM function that requires helicase activity, and explaining the simi- larity of the consequences of low BRCA1 or high BLM. Given that we do not see a disruption of BRCA1 foci in BLM-overexpressing cells despite an apparent reduction in Rad51 foci formation, we cannot rule out that cisplatin sensitivity observed in BLM- overexpressing cells is at least in part related to a BRCA1- independent pathway wherein loss of RAD51 at the sites of DNA damage sensitizes the BLM overexpressing cells to cisplatin.
Funding
ALR, NT, JEG, JDI, ZCW, and ZS are supported by the Breast Cancer Research Foundation (no grant number applies). ZS is supported by the Basser Foundation, EU FP7 project PREDICT and by the NovoNordisk Foundation (ID 16854) (no grant num- ber applies). DS is supported by Momentum Grant LP2011-015 of the Hungarian Academy of Sciences. NJB is supported by The Villum Kann Rasmussen Foundation (no grant number applies).
Analysis of the cisplatin-2 samples was supported by a grant to JEG from the V-Foundation (no grant number applies).
Disclosure
NJB, ZCW, ZS, and ALR are inventors on a patent application for the use of the ratio of BLMþFANCI/BRCA1 to predict response to chemotherapy. All remaining authors have declared no con- flicts of interest.
References
1. Basourakos SP, Li L, Aparicio AM et al. Combination platinum-based and DNA damage response-targeting cancer therapy: evolution and fu- ture directions. Curr Med Chem 2017; 24(15): 1586–1606.
modulates replication fork progression and DNA damage responses in platinum-treated human cells. Sci Rep 2013; 3(1): 3277.
3. Birkbak NJ, Wang ZC, Kim J-Y et al. Telomeric allelic imbalance indi- cates defective DNA repair and sensitivity to DNA-damaging agents.
Cancer Discov 2012; 2(4): 366–375.
4. Abkevich V, Timms KM, Hennessy BT et al. Patterns of genomic loss of heterozygosity predict homologous recombination repair defects in epi- thelial ovarian cancer. Br J Cancer 2012; 107(10): 1776–1782.
5. Popova T, Manie´ E, Rieunier G et al. Ploidy and large-scale genomic in- stability consistently identify basal-like breast carcinomas with BRCA1/2 inactivation. Cancer Res 2012; 72(21): 5454–5462.
6. Silver DP, Richardson AL, Eklund AC et al. Efficacy of neoadjuvant cisplatin in triple-negative breast cancer. J Clin Oncol 2010; 28(7): 1145–1153.
7. Ahmed AA, Mills AD, Ibrahim AEK et al. The extracellular matrix pro- tein TGFBI induces microtubule stabilization and sensitizes ovarian can- cers to paclitaxel. Cancer Cell 2007; 12(6): 514–527.
8. De Luca P, Vazquez ES, Moiola CP et al. BRCA1 loss induces GADD153- mediated doxorubicin resistance in prostate cancer. Mol Cancer Res 2011; 9(8): 1078–1090.
9. Ouyang KJ, Woo LL, Zhu J et al. SUMO modification regulates BLM and RAD51 interaction at damaged replication forks. PLoS Biol 2009; 7(12):
e1000252.
10. Petermann E, Orta ML, Issaeva N et al. Hydroxyurea-stalled replication forks become progressively inactivated and require two different RAD51- mediated pathways for restart and repair. Mol Cell 2010; 37(4): 492–502.
11. Davies SL, North PS, Hickson ID. Role for BLM in replication-fork re- start and suppression of origin firing after replicative stress. Nat Struct Mol Biol 2007; 14(7): 677–679.
12. Pichierri P, Franchitto A, Rosselli F. BLM and the FANC proteins collab- orate in a common pathway in response to stalled replication forks.
EMBO J 2004; 23(15): 3154–3163.
13. Raaphorst GP, Leblanc M, Li LF. A comparison of response to cisplatin, radiation and combined treatment for cells deficient in recombination repair pathways. Anticancer Res 2005; 25(1A): 53–58.
14. Qing Y, Yamazoe M, Hirota K et al. The epistatic relationship between BRCA2 and the other RAD51 mediators in homologous recombination.
PLoS Genet 2011; 7(7): e1002148.
15. Cejka P, Cannavo E, Polaczek P et al. DNA end resection by Dna2-Sgs1- RPA and its stimulation by Top3-Rmi1 and Mre11-Rad50-Xrs2. Nature 2010; 467(7311): 112–116.
16. Nimonkar AV, Genschel J, Kinoshita E et al. BLM-DNA2-RPA-MRN and EXO1-BLM-RPA-MRN constitute two DNA end resection machi- neries for human DNA break repair. Genes Dev 2011; 25(4): 350–362.
17. Bugreev DV, Yu X, Egelman EH, Mazin AV. Novel pro- and anti- recombination activities of the Bloom’s syndrome helicase. Genes Dev 2007; 21(23): 3085–3094.
18. Karow JK, Constantinou A, Li JL et al. The Bloom’s syndrome gene prod- uct promotes branch migration of holliday junctions. Proc Natl Acad Sci USA 2000; 97(12): 6504–6508.
19. Wang D, Lippard SJ. Cellular processing of platinum anticancer drugs.
Nat Rev Drug Discov 2005; 4(4): 307–320.
Downloaded from https://academic.oup.com/annonc/article-abstract/29/4/903/4857262 by Hungary EISZ Consortium user on 05 March 2019