DOI: 10.1556/606.2019.14.3.11 Vol. 14, No. 3, 109–120 (2019) www.akademiai.com
ESTIMATION OF CHANGES IN RUNOFF DUE TO CHANGES IN FOREST COMPOSITION
1 Marija Mihaela LABAT*, 2 Kamila HLAVČOVÁ, 3 Gabriel FÖLDES
1,2,3
Department of Land and Water Resources Management, Faculty of Civil Engineering Slovak University of Technology in Bratislava, Radlinského 11 810 06 Bratislava, Slovakia
e-mail: 1marija.labat@stuba.sk, 2kamila.hlavcova@stuba.sk, 3gabriel.foldes@stuba.sk
Received 20 December 2018; accepted 10 April 2019
Abstract: In recent decades many forests in Slovakia, especially those in mountain basins, have been devastated by wind or snow calamities. Hence, the main aim of this paper is to analyze land use and estimate the changes in runoff from the Boca and Ipoltica river basins in Slovakia for historical (1990 and 2006) and present land use (2012). The changes in runoff are presented as changes in design floods. For estimating the design floods, the curve number method was used.
The values of the design floods on both of these river basins have increased due to deforestation.
Keywords: Design flood, Curve number method, Land use changes, Runoff
1. Introduction
Forests are an important part of the hydrological cycle; they affect the quality and quantity of water, runoff rates, extend of flooding, the rate of erosion, etc. The amount of water that flows into a catchment area is affected by climatic factors like the rate and frequency of precipitation, water accumulation, or snow melt. According to [1], the formation of runoff in a catchment area depends on its geological structure and soil composition (permeability and retention capacity), the morphology of the catchment area, its vegetation, and land use. The interaction between these factors affects the final shape of the runoff hydrograph, i.e. the increasing or decreasing tendencies of the flow velocity, peak flow, and flood wave volume.
* Corresponding Author
The relationship between a forest and the runoff from a catchment area was confirmed by an experiment at the beginning of the 20th century. In the year 1900, Professor C. Bourgeois of the Swiss Federal Institute for Forest, Snow and Landscape Research started systematic measurements of runoff on two small river basins (Spelbergraben and Rappengraben) with different forest densities [1]. In 1927 Zdeněk Válek [2] started similar research in an area located at the Slovak and Czech border [3].
The first results of the experiment confirmed the benign influence of the forest on runoff, i.e. extremely large flood flows were reduced. In 1919 [4], Professor Arnold Engler discovered that runoff from a forested catchment area is significantly less than runoff from a catchment area with only 35% of the forests.
According to Fan et al. [5], the rainfall-runoff process is a complex, dynamic and nonlinear process. To simulate the hydrological processes in uncontrolled catchments, rainfall-runoff models have recently been used. By using these models, it is possible to calculate design flows; therefore, flood parameters like peak flows, wave volumes, durations, etc. can be calculated.
The paper focuses on the changes in land use and their effect on the runoff formation. The changes in runoff are presented as changes in design floods. The aim was to compare the changes in design floods, in period before and after the deforestation has occurred. The study is located on two small mountain river basins in Low Tatras in Slovakia.
2. Methodology
2.1. The soil conservation service - curve number
The methodology of the Soil Conservation Service - Curve Number (SCS-CN) is used in ungagged rural catchments where there are no measurements or observations of direct flows for estimating the volume of the direct surface runoff characteristics of small basins [6]-[8]. This method is not only used for predicting direct surface runoff volume for a given rainfall event, but it is also used to estimate the volume and peak rate of surface runoff [7], [9]. The main parameter in this methodology is the Curve Number (CN), which is based on an empirical study of runoff in small watersheds and hill slopes [5]. This parameter depends on land surface characteristics and hydro-soil conditions. The primary reason for its wide applicability and acceptability lies in the fact that it accounts for most runoff - producing watershed characteristics, e.g. soil types [10], land use/treatments, surface conditions, and antecedent moisture conditions [11].
Soil properties can have a significant influence on the amount of runoff [12].
The mean CN value for a given river basin is determined using the CN table values [13], [14]. This method allows for the calculation of a peak flow Qmax by calculating the time concentration tkc, the maximum potential river basin retention A, the design rainfall intensity Hz, the depth of runoff H0, and the flood wave volume V.
When applying the CN method to calculate design floods in the Boca and Ipoltica river basins, the design rainfall was used as an input rainfall, and the initial abstraction coefficient was equal to zero.
3. Study area, input data and land use analysis
The study areas are two neighboring basins of the Boca and Ipoltica rivers, which are located in the Low Tatras National Park in Slovakia. This area has been affected by several wind calamities in recent decades; the two most extreme calamities occurred in 2004 and 2007 [15].
The main inputs for this study were digital maps:
‒ raster maps of the Digital Elevation Model (DEM), with a grid size of
‒ 20 x 20 m (Fig. 1);
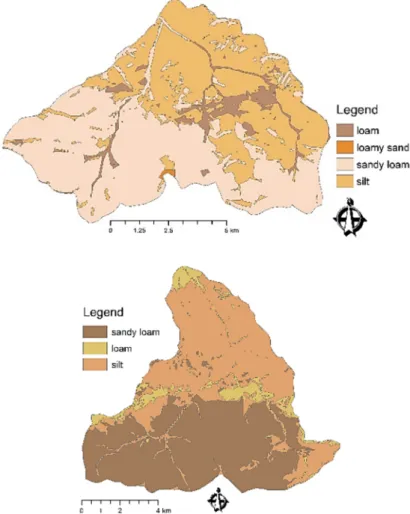
‒ vector maps of types of soil (Fig. 2);
‒ Corine Land Cover (CLC) vector land use maps for 1990, 2006 and 2012
‒ (Fig. 1 - Fig. 6) [16];
‒ raster maps with a scale of 1:25 000 created according to the basic database for the Geographic Information System (ZBGIS®) [17].
The input data were processed using the Geographical Information System (GIS) [18].
Fig. 1. The DEM of the Boca (top) and Ipoltica (bottom) river basins
Fig. 2. The maps of types of soil of the Boca (top) and Ipoltica (bottom) river basins
The Boca River basin with its outlet in Malužiná is a left tributary of the River Váh.
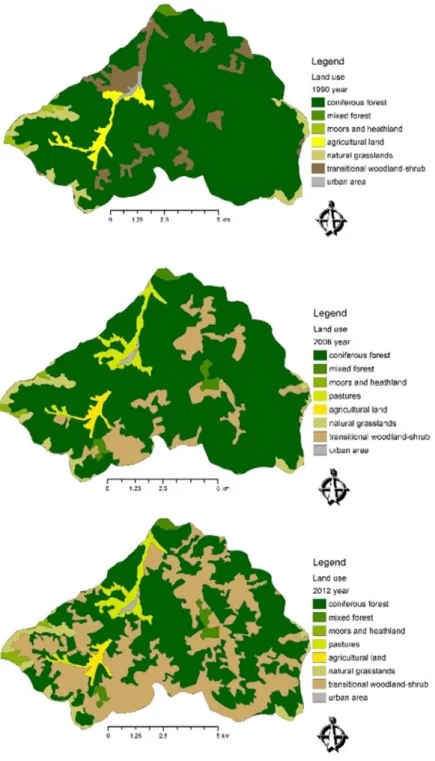
The area of this basin is 81.93 km2. In 1990, 82.9% of this area was covered by forests.
In 2012, only 52% of the area was covered by forests. Instead of forests, transitional woodland-shrubs and pastures started to spread. The spatial changes in the land use of the Boca River basin over the period (1990, 2006 and 2012) can be seen in Fig. 3.
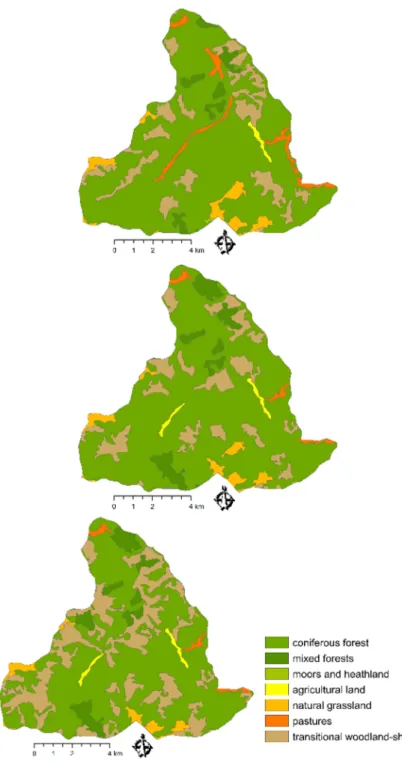
The Ipoltica River basin with its outlet at the Čierny Váh station is a left tributary of the Čierny Váh River. The area of the basin is 86.28 km2. In 1990, forests used to cover 79.2% of this area. In 2012, the area with forests was reduced to 69.8%; instead of forests, transitional woodland-shrubs started to spread. The spatial changes in the land use of the Ipoltica River basin over the period (1990, 2006 and 2012) can be seen in Fig. 4.
Fig. 3. Land use maps of the Boca River basin for (from top) 1990, 2006 and 2012
Fig. 4. Land use maps of the Ipoltica River basin for (from top) 1990, 2006 and 2012
After analyzing the land use changes in the Boca and Ipoltica river basins, it can be concluded that the Boca River has been affected more by wind calamities. More detailed results of the comparison are described in the conclusion.
4. Estimation of the design floods and results
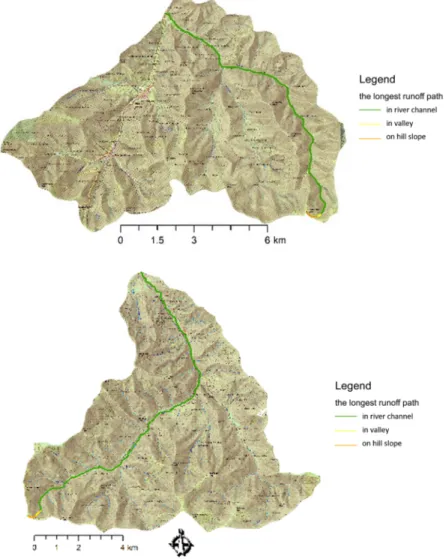
The aim of the calculations was to compare the design floods QN for 1990, 2006, and 2012 and the return periods of 10, 20, 50, and 100 years. Using DEM and the spatial analysis tools in GIS, the longest runoff path was determined (Fig. 5). The runoff path was divided into runoff on a hill slope, in a valley, and in a river channel.
Fig. 5. The longest runoff paths for the Boca (top) and Ipoltica (bottom) river basins
The mean runoff velocity along the runoff path was determined using tables from the literature [19]. The mean runoff velocity depends on the slope of the terrain and the land use along the hill slope and valley path. In the case of the Boca River basin, the land use along the path has changed over time; hence, the time of concentration for 1990 and 2006 (tc=79.61 min) is different than for 2012 (tc=69.35 min). In the case of the Ipoltica River, since the land use around the runoff path has not significantly changed, the time of concentration was the same for all three years (tc= 84.32 min).
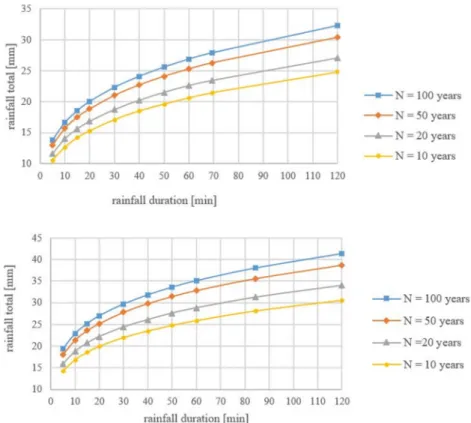
The design rainfall intensity values (Fig. 6) for the two stations were used for the calculations (the Liptovský Hrádok station was used for the Boca River basin, and the Kráľova lehota - Čierny Váh station was used for the Ipoltica River basin). These values were divided from the one-day design values by a simple scaling method [20]. A simple scaling method is used to process rainfall data for a period of time shorter than one day.
It is used to determine the design values for duration shorter than one day and for a selected time period by using daily rainfall records that are commonly available [21].
Fig. 6. The design rainfall intensity values for various return periods for the Liptovský Hradok (top) and Kráľová lehota – Čierny Váh (bottom) stations
For estimating the design floods, the SCS-CN method was used. When applying this methodology, the initial abstraction coefficient is equal to zero. An example of the
calculations and the results of the estimation of the design floods for the Boca and Ipoltica river basins (for 2012) are shown in Table I and Table II. The results of the estimation of the design floods (for 1990, 2006 and 2012) for the Boca River basin are shown in Table III, and the results for the Ipoltica River basin are shown in Table IV.
Table I
Estimation of the design flood for the Boca River basin (2012) N
[year]
Hz [mm] for tc
= 69.35 min
weighted average CN value [-]
A [mm]
Ho [mm]
V [m3]
QN [m3.s-1]
10 21.41
68.56 116.49 3.32 272241.4 43.62
20 23.43 3.92 321572.2 51.52
50 26.28 4.84 396470.7 63.52
100 27.92 5.40 442305.2 70.86
Table II
Estimation of the design flood for the Ipoltica River basin (2012) N
[year]
Hz [mm] for tc
= 84.32 min
weighted average CN value [-]
A [mm]
Ho [mm]
V [m3]
QN [m3.s-1]
10 21.41
65.45 134.08 4.87 420566.8 55.42
20 23.43 5.90 509427.4 67.13
50 26.28 7.46 643234.9 84.76
100 27.92 8.41 725363.3 95.59
Table III
Estimation of the design flood for the Boca River basin N
[year]
weighted average CN value QN [m3.s-1]
1990 2006 2012 1990 2006 2012
10
62.75 63.58 68.56 32.61 33.65 43.62
20 38.60 39.81 51.52
50 47.76 49.23 63.52
100 53.40 55.03 70.86
Table IV
Estimation of the design flood for the Ipoltica River basin N
[year]
weighted average CN value QN [m3.s-1]
1990 2006 2012 1990 2006 2012
10
61.53 63.20 65.45 48.09 51.07 55.42
20 58.40 61.95 67.13
50 73.98 78.38 84.76
100 83.58 88.48 95.59
As it can be seen in Tables III and IV, the design floods increased over the three periods. For example, in the Boca River basin in 1990, Q10 = 32.61 m3.s-1, Q20 = 38.60
m3.s-1, Q50 = 47.76 m3.s-1, and Q100 = 53.40 m3.s-1. These values increased by around 33% when compared to 2012. Similarly, in the Ipoltica River basin, in 1990, Q10 = 48.09 m3.s-1, Q20 = 58.40 m3.s-1, Q50 = 73.98 m3.s-1, and Q100 = 83.58 m3.s-1. These values have increased by around 13% when compared to 2012. From this it follows that design values have increased more in the Boca River basin than the values in the Ipoltica River basin.
5. Discussion and conclusions
The paper provides an overview of the basic information about the relationship between forests and runoff formation and the SCS-CN methodology used to estimate changes in the design floods. The paper focuses on the problems of the afforestation caused by wind calamities on the two neighbouring basins of the Boca and Ipoltica rivers, which are located in the Low Tatras National Park, Slovakia.
Using historical (1990 and 2006) and present (2012) land use maps, the changes in the land use composition were compared for these two river basins.
When the land use of the Boca River basin in 1990 is compared to the land use in 2012, the forests decreased by 30.29%; agricultural land decreased by 1.58%; natural grasslands decreased by 0.7%; and the urban area decreased only by 0.1%. To the contrary, transitional woodland-shrubs increased by 29.29%. The moors and heathlands stayed almost the same (they increased by only 0.09%). While in 1990, pastures had not been noticed in this river basin, in 2012, they occupied 3.34% of the area.
In the Ipoltica River basin, from 1990 to 2012, forests decreased by 9.38%; pastures decreased by 2.31%; and natural grasslands decreased by 1.2%. The moors and headlands again stayed almost the same (they decreased by only 0.08%). The transitional woodland-shrubs increased by 12.64%, and the agricultural land increased by 0.34%.
From the analyses it can be concluded that the Boca River basin was more affected by the wind calamities. It is then logical to also conclude that the runoff changes should be more significant in the Boca River basin than in the Ipoltica River basin.
The values in both river basins have increased over time. When the results from 1990 and 2012 in the Boca River basin are compared, the values of the design floods increased by 33.8% in the case of the return period 10 years, by 33.5% in the case of the return period 20 years, by 33% in the case of the return period 50 years, and by 32.7%
in the case of the return period 100 years. In the Ipoltica River basin, the values of the design floods increased by 15.24% in the case of the return period 10 years, by 14.95%
in the case of the return period 20 years, by 14.57% in the case of the return period 50 years, and by 14.37% in the case of the return period 100 years.
These changes between the two neighboring basins could be caused by different land use changes (since the deforestation was higher in the Boca River basin, it is logical that the changes in the design flood values would be higher as well). They could also be affected by the different design rainfall intensity values.
The design flood values were mostly affected by the different CN values, which mostly depend on land use. This problem can appear if the land use maps (used as inputs for the research) are not precise. The land use maps used for this study were
created by most European countries using a visual interpretation of satellite imagery.
However, in a few countries these maps were produced by applying the semi-automatic solutions, using satellite image processing, national in-situ data, GIS integration and generalization. The question is, how precise was the marking and classification, especially in Slovakia (since that is where this research has been conducted). Another problem with this methodology is how to correctly choose the CN values. Specifically, for this research, the problem was to select the CN values for the afforested area.
Changing this value just by a few numbers can cause a big difference in the results.
However, the design floods have increased in both river basins. If no measures, like forest management, sustainable wood management, afforestation, etc. are applied, increasing values of the design floods can also be expected in the future.
More studies in this area have already started. To achieve more precise results, studies are focusing on hydrological modeling. For flood prediction and watershed management on basin scale, a distributed hydrological model WetSpa (Water and Energy Transfer between Soil, Plant and Atmosphere) can be used.
Acknowledgements
This work was supported by the Slovak Research and Development Agency under Contracts No. APVV-15-0497 and APVV-15-0425, and the VEGA Grant Agency No.
1/0710/17. The authors thank the agency for its research support.
References
[1] Minďáš J., Škvarenina J. Forests of Slovakia and water (in Slovak), Technical University in Zvolen, Zvolen, 2010.
[2] Válek Z. Research on the influence of the forest on the runoff in the Kýchové and Zděchovky River basins (in Czech), Water Management, Vol. 10, 1953, pp. 293‒296.
[3] Mráček Z., Krečmer V. The importance of the forest for human society (in Czech), State Agricultural Publishing House, Prague, 1975.
[4] Engler A. Investigations on the influence of the forest on the state of water (in German), Report of the Swiss Institute of Forestry Research, Vol. 12, 1919.
[5] Fan F., Deng Y., Hu X., Weng Q. Estimating composite curve number using an improved SCS-CN method with remotely sensed variables in Guangzhou, China, Remote Sensing, Vol. 5, No. 3, 2013, pp. 1425‒1438.
[6] Studvová Z., Danáčová M. Erosion and transport processes and their quantification by erosion models in terms of erosion control, 16th International Multidisciplinary Scientific GeoConference, Albena, Bulgaria, 28 June-6 July 2016, Book 3, Vol. 1, pp. 289‒296.
[7] Boughton W. C. A review of the USDA SCS curve number method, Australian Journal of Soil Research, Vol. 27, No. 3, 1989, pp. 511‒523.
[8] Labat M. M., Rattayová V., Hlavčová K. The impact of changes in land use on reduction in peak floods, Acta Hydrologica Slovaca, Vol. 1, No. 19, 2018, pp. 69‒77.
[9] Labat M. M., Korbelová L., Kohnová S., Hlavčová K. Design of measures for soil erosion control and assessment of their effect on the reduction of peak flows, Pollack Periodica, Vol. 13, No. 3, 2018, pp. 209‒219.
[10] Kupec M., Stradiot P., Rehák Š. Comparison of selected pedotransfer functions for the determination of soil water retention curves, Slovak Journal of Civil Engineering, Vol. 23, No. 3, 2015, pp. 33‒36.
[11] Mishra S. K., Singh V. P. Soil Conservation Service Curve Number (SCS-CN) Methodology, Springer, 2003.
[12] Antal J. Soil protection and forest - technical melioration II, Instructions for exercises (in Slovak), Bratislava, Nature, 1989.
[13] Urban hydrology for small watersheds, Technical Release 55, United States Department of Agriculture, Natural Resources Conservation Service, Engineering Division, Washington DC, 1986.
[14] Heinige V., Hlavčová K., Bacúrik I. Protection and organization of the catchment area, Instructions for exercises, (in Slovak) Slovak University of Technology Publisher, Bratislava, 1995.
[15] Forest portal about forest of Slovakia, Calamities, 2015, National Forest Center in Zvolen, http://www.forestportal.sk/lesne-hospodarstvo/ochrana-lesa/Stranky/kalamity.aspx, (last visited 4 November 2018).
[16] Copernicus land monitoring service, CORINE land cover, https://land.copernicus.eu/pan- european/corine-land-cover, (last visited 11 November 2018).
[17] ZBGIS - The geodesy, cartography and cadaster, Authority of the Slovak Republic, Map client, Geodetic and Cartographic Institute Bratislava, https://zbgis.skgeodesy.sk, (last visited 10 December 2018).
[18] Tepavčević B., Šijakov M., Šiđanin P. GIS technologies in urban planning and education, Pollack Periodica, Vol. 7, Suppl. 1, 2012, pp. 185‒190.
[19] Alena F. Soil erosion protection on vineyards, Methodological aid, State Amelioration Report, Bratislava, 1990.
[20] Földes G., Kohnová S., Hlavčová K. Analysis of future changes in the trends and scaling coefficients for short-term rainfall in southwestern Slovakia, Pollack Periodica, Vol. 13, No. 3, 2018, pp. 163‒174.
[21] Koutsoyiannis D., Foufoula-Georgiu E. A scaling model of storm hyetograph, Water Resources Research, Vol. 29, No. 7, 1993, pp. 2345–2361.