SEMMELWEIS EGYETEM DOKTORI ISKOLA
Ph.D. értekezések 2396.
JERMENDY ÁDÁM LEVENTE
Szív- és érrendszeri betegségek élettana és klinikuma című program
Programvezető: Dr. Merkely Béla, egyetemi tanár Témavezető: Dr. Maurovich-Horvat Pál, egyetemi docens
Clinical implications of measuring epicardial adipose tissue quantity
PhD Thesis
Ádám L. Jermendy M.D.
Semmelweis University
Doctoral School of Basic and Translational Medicine
Supervisor:
Pál Maurovich-Horvat, M.D., Ph.D.
Official reviewers:
Zsuzsanna Földes-Lénárd M.D., Ph.D.
Katalin Keresztes M.D., Ph.D.
Head of the Final Examination Committee:
Viktor Bérczi M.D., Ph.D.
Members of the Final Examination Committee:
Attila Doros M.D., Ph.D.
Tibor Hidvégi M.D., Ph.D.
Budapest 2019
Table of Contents
List of abbreviations ... 3
1. Introduction ... 5
1.1. Epicardial adipose tissue ... 5
1.1.1. Terminology ... 6
1.1.2. Imaging of epicardial adipose tissue ... 8
1.1.3. Anatomical characteristics of EAT ... 11
1.1.4. Physiological function of EAT ... 13
1.1.5. EAT in the pathomechanism of atherosclerosis ... 14
1.1.6. Role of EAT in other cardiac and non-cardiac abnormalities ... 18
1.1.7. Treatment options for modifying EAT volume ... 20
1.2. Relationship of EAT to other fat compartments ... 21
1.3. Contribution of genetic and environmental factors on fat compartments ... 22
1.4. Summarizing data from the literature ... 23
2. Aims ... 25
3. Methods ... 26
3.1. Classical twin study ... 26
3.1.1. Patients ... 26
3.1.2. Anthropometric data and medical history ... 29
3.1.3. Laboratory parameters ... 30
3.1.4. Epicardial fat volumetric assessment ... 30
3.1.5. Assessment of abdominal SAT and VAT ... 31
3.1.6. Cardiac computed tomography ... 33
3.1.7. Coronary plaque assessment ... 33
3.1.8. Reproducibility of measuring EAT, SAT and VAT quantities ... 34
3.1.9. Statistical analysis ... 34
3.2. Assessing the relationship of EAT volume to CAD ... 35
3.2.1. Patients and methods ... 35
3.2.2. Statistical analysis ... 36
4. Results ... 37
4.1. Assessing genetic and environmental influences on EAT quantity in comparison to abdominal SAT and VAT volumes ... 37
4.2. Evaluating the association between EAT volume and the presence of CAD 45 5. Discussion ... 48
5.1. Heritability of EAT volume... 48
5.2. Relationship of EAT volume to the presence of CAD ... 51
6. Conclusions ... 53
7. Summary ... 54
8. Összefoglalás ... 55
9. Bibliography ... 56
10. Bibliography of the candidate’s publications ... 77
10.1. Publications closely related to the present thesis ... 77
10.2. Publications not related to the present thesis ... 78
11. Acknowledgements ... 82
List of abbreviations
ALT: alanine aminotransferase AST: aspartate aminotransferase BMI: body mass index
BUDAPEST-GLOBAL: Burden of atherosclerotic plaques study in twins - Genetic Loci and the Burden of Atherosclerotic Lesions
CAD: coronary artery disease CRP: C-reactive protein CT: computed tomography CTA: CT angiography
DCCT/EDIC: Diabetes Control and Complications Trial / Epidemiology of Diabetes Intervention and Complications
DZ: dizygotic
EAT: epicardial adipose tissue ECG: electrocardiogram FFA: free fatty acid
GLOBAL: Genetic Loci and the Burden of Atherosclerotic Lesions HDL-cholesterol: high-density lipoprotein cholesterol
HU: Hounsfield unit
ICC: intra-class correlation coefficient IL-1β: interleukin-1β
IL-6: interleukin-6
JNK: Jun N-terminal kinase
LDL-cholesterol: low-density lipoprotein cholesterol MCP-1: monocyte chemoattractant protein-1
MDCT: multidetector-row CT
MESA: Multiethnic Study of Atherosclerosis MRI: magnetic resonance imaging
mRNA: messenger ribonucleotide acid MZ: monozygotic
NAFDP: non-alcoholic fatty pancreas disease
NAFLD: non-alcoholic fatty liver disease NASH: non-alcoholic steatohepatitis NFkappaB: nuclear factor-kappa-B
NSTEMI: non-ST-elevation myocardial infarction OR: odds ratio
PAI-1: plasminogen activator inhibitor-1 ROI: region of interest
SAT: subcutaneous adipose tissue SD: standard deviation
SPECT: single photon emission computed tomography TIMI: thrombolysis in myocardial infarction
TNF-α: tumor necrosis factor-α UCP-1: uncoupled protein-1 VAT: visceral adipose tissue
1. Introduction
1.1. Epicardial adipose tissue
Type 2 diabetes mellitus and its cardiovascular complications carry a great burden for the health care system worldwide due to their high prevalence rate (1). Insulin resistance syndrome with the dysfunction of abdominal fat compartment plays an important role in the development of the disease (2, 3). In the last couple of years it was demonstrated that other fat compartments may also be involved in the insulin resistance syndrome and may contribute to the pathogenesis of atherosclerosis (4). Recently, the epicardial fat compartment has gained special attention in this regard (5-7).
In the 19th century it was believed that fatty degeneration of the heart is the main cause of every heart disease (8). Richard Quain was the most well-known scientist supporting this theory recognizing the relationship of increased fat volume on the epicardial surface with coronary artery obstruction. The diagnosis of fatty heart was very popular in the Victorian era but was later changed to the concept of fibrosus heart disease and chronic myocarditis. All these diagnoses were replaced by the ischemia-theory in the middle of the 20th century. Interestingly, it was recognized at that time that in 70% of the fatty heart diagnosis in Quain’s pathological records corresponded with the ischemic heart disease.
Although the relationship between increased epicardial fat quantity and different cardiac pathologies was described almost 150 years ago, medicine did not dedicate to much attention to this field. Cardiovascular research has begun to explore the role of different fat compartments with the pandemic spread of obesity and the dynamic development of radiological imaging technics (9). Lately, special attention was paid to the epicardial fat due to its anatomical proximity with the coronary arteries (10-12). While anatomical and biochemical characteristics of the epicardial fat compartment were described in early studies, its potential role in the pathomechanism of coronary artery disease (CAD) and other cardiac dysfunction has only been investigated recently.
1.1.1. Terminology
The exact terminology of fat compartments covering and surrounding the heart is not standardized; there are still many imprecise uses of these definitions in the literature.
Nevertheless, the most widely used and accepted terms are summarized in Table 1.
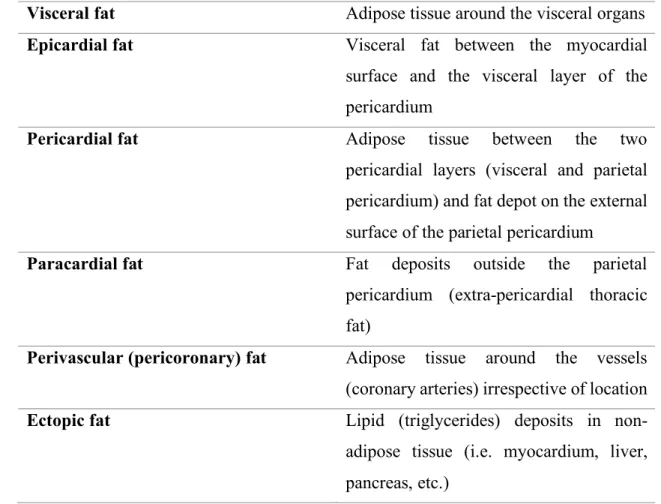
Table 1. Terminology of fat compartments around the heart
Visceral fat Adipose tissue around the visceral organs Epicardial fat Visceral fat between the myocardial
surface and the visceral layer of the pericardium
Pericardial fat Adipose tissue between the two pericardial layers (visceral and parietal pericardium) and fat depot on the external surface of the parietal pericardium
Paracardial fat Fat deposits outside the parietal pericardium (extra-pericardial thoracic fat)
Perivascular (pericoronary) fat Adipose tissue around the vessels (coronary arteries) irrespective of location Ectopic fat Lipid (triglycerides) deposits in non-
adipose tissue (i.e. myocardium, liver, pancreas, etc.)
The epicardial fat as a part of the visceral fat is localized between the myocardial surface and the visceral layer of the pericardium. Pericardial fat involves adipose tissues between the two (visceral and parietal) pericardial layers and the fat depot on the external surface of the parietal pericardium. Paracardial fat contains fat deposits outside the parietal pericardium and therefore, sometimes is called as extra-pericardial intrathoracic fat. The coronary arteries are surrounded by the perivascular/pericoronary fat, irrespective of
location. The term of ectopic fat implies triglycerides deposits in non-adipose tissue of different organs such as myocardium, muscle, liver, or pancreas (13).
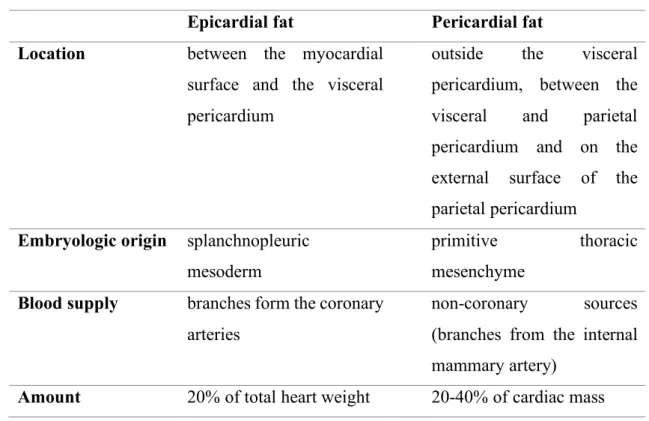
The clear distinction of epicardial fat from pericardial fat is of great clinical importance (14, 15). From embryological aspect they have different origins. While the epicardial fat - similarly to the visceral fat - originates from mesodermal cells, the pericardial fat has an ectodermal origin, similarly to subcutaneous fat. Moreover, there is also a difference in the blood supply between these two fat compartments. Epicardial fat is supplied by the small myocardial coronary arteries, on the other hand, the blood supply of pericardial fat is provided from the thoracic vessels. The amount of epicardial and pericardial fat compartments as percentage of total cardiac mass also differs (Table 2).
Table 2. Differences between epicardial and pericardial fat compartments Epicardial fat Pericardial fat Location between the myocardial
surface and the visceral pericardium
outside the visceral pericardium, between the visceral and parietal pericardium and on the external surface of the parietal pericardium
Embryologic origin splanchnopleuric mesoderm
primitive thoracic mesenchyme
Blood supply branches form the coronary arteries
non-coronary sources (branches from the internal mammary artery)
Amount 20% of total heart weight 20-40% of cardiac mass
1.1.2. Imaging of epicardial adipose tissue
The most commonly used non-invasive modalities for the visualization and quantification of epicardial fat tissue are echocardiography, magnetic resonance imaging (MRI) and cardiac computed tomography (CT).
Echocardiography provides a simple, cheap and readily available assessment which pictures directly the epicardial adipose tissue (EAT) thickness on the free wall of the right ventricle. Importantly, this technique does not subject the patient to ionizing radiation.
Echocardiographic assessment of EAT thickness requires parasternal short- and long-axis views in three following end-systolic phases (Figure 1). Several studies have established the general EAT thickness under 7 mm in asymptomatic population (16). Nevertheless, this method has several disadvantages including the poor reproducibility and the high dependence on the observer’s experience. In addition, it may not reflect accurately the whole quantity of the epicardial fat due to the two-dimensional nature of the measurement. Moreover, the method has poor intra- and interobserver variability, and its results may differ significantly from the measurements with CT (17, 18).
Figure 1.
Quantification of epicardial adipose tissue by echocardiography (parasternal view). The thickness of the area between the myocardium and the visceral layer of the pericardium is 0.85 cm indicating epicardial adipose tissue (E, green arrow).
In contrast to echocardiography, MRI provides accurate area measurements and, in this way, EAT volume can be calculated (Figure 2). Area measurements with MRI correspond well with fat thickness determination with echocardiography, although a systemic bias through overestimation of EAT with echocardiography might occur (19).
Although the lack of ionizing radiation is preferable, there are disadvantages of this modality; it is less available in routine clinical practice, it is more expensive and has worse spatial resolution compared to CT.
Figure 2.
Epicardial adipose tissue (green arrow) demonstrated using magnetic resonance imaging (MRI) technique.
RA: right atrium, LA: left atrium, RV: right ventricle, LV: left ventricle
True volume assessment of EAT is feasible using multidetector-row CT (MDCT), which has superior spatial resolution among the imaging modalities (Figure 3). It is of note that the specificity and sensitivity of epicardial fat measurements with MDCT are the best comparing to alternative imaging methods. Epicardial fat quantification is performed in a standardized fashion on prospectively ECG triggered non-contrast CT scans which extend from the pulmonary artery bifurcation to the diaphragm. The identification of EAT is based on thresholds of fat attenuation. Typically, lower thresholds of attenuation range from -250 to -190 Hounsfield units (HU) and upper thresholds are set between -50 and -30 HU. In contrast to area and thickness measurements, volume quantification provides the most accurate way for assessing the true epicardial fat quantity which can be performed on volume rendered image reconstructions (20). In addition, non-enhanced cardiac CT scans can be used for the quantification of coronary artery calcification
resulting in more reliable cardiovascular risk assessment (21). Importantly, native CT results in a very small (~0.5 mSv) radiation dose. Maurovich-Horvat et al found in a former collaborative work that the measurement of pericoronary adipose tissue proved to be highly reproducible by using MDCT (22).
Figure 3.
Measuring epicardial adipose tissue quantity by cardiac computed tomography (CT) a) Axial section at the aortic root. The green arrows indicate the visceral layer of the
pericardium. Epicardial fat (E) is located inside while pericardial fat (P) outside of the visceral layer.
b) Epicardial adipose tissue (yellow) at the corresponding section
c) Volume rendered reconstruction of the total epicardial fat compartment (yellow).
The volume of epicardial adipose tissue was 112 cm3.
1.1.3. Anatomical characteristics of EAT
In physiological circumstances the epicardial fat covers nearly 80% of the heart surface.
According to earlier observations this fat compartment contributes with 20% to the whole heart quantity (23). The EAT-covered heart region includes the heart basis and the apex, the atrioventricular sulci, the entire surface of the right ventricle, and the great coronary vessels with their origins. The distribution of EAT is mostly inhomogeneous, the biggest mass is localized on the lateral and anterior walls of the right atrium, but in normal circumstances it covers also the atrioventricular and the interventricular sulci and the
main coronary arteries as well. In case of extremely enlarged EAT, it can accumulate also on the surface of the left atrium and along the vessel’s adventitia with spreading into the myocardium. It is of note, that there is no separating fascia layer between the epicardial fat and the myocardium providing a close proximity of these two different tissues (24).
In histological investigations it has been earlier established that adipocytes in the EAT are smaller than those in the abdominal or the subcutaneous fat compartments (25).
Beyond adipocytes, EAT includes nerves, ganglions, vessels, inflammatory cells and fibrocytes as well (Figure 4).
Figure 4.
Microscopic view of the epicardial adipose tissue. It is of note that there is no separating fascia layer between the epicardial fat and the myocardium.
(Histological image is courtesy of Zoltán Sápi, MD, DSc, Semmelweis University, Institute of Pathology, Budapest. In: Nagy E, Jermendy ÁL et al: Arch Med Sci 2017.)
Age, gender, body weight and ethnicity should be taken into consideration among physiological determinants of EAT (26-29). EAT seems to increase with age (30). The quantity of EAT depends on gender and body mass index (BMI). For example, pericardial fat was reported to be 137±54 cm3 among men and 108±41 cm3 among women of the Framingham offspring cohort (31). In patients with high BMI (>27 kg/m2) EAT volume was more than two times higher compared to those with a BMI <27 kg/m2 (155±15 cm3 vs 67±12 cm3) (20). Some ethnic differences in epicardial and pericardial fat thickness may also occur; non-Hispanic White men have more epicardial and pericardial fat than do African Americans (32).
The biochemical features of small adipocytes in EAT may also differ from those of other fat compartments. In experimental studies EAT had higher rate of free fatty acid (FFA) release than adipose tissue elsewhere in the body suggesting that EAT might play a role in local energy supply for the myocardium. In addition, a lower oxidative capacity and a lower rate of glucose utilization were also documented (33). On the other hand, a 5-fold higher expression of uncoupled protein-1 (UCP-1) was found in EAT comparing to other fat depots (34). The UCP-1 is a specific protein in brown fat which is necessary to its energy production, and doesn’t appear in other type of fat tissues. This latter feature is in line with the fact that epicardial fat evolves from the brown adipose tissue during embryogenesis.
1.1.4. Physiological function of EAT
Several physiological functions of EAT are already known from different studies or supposed from its biochemical or anatomical features. Unfortunately, experimental evidences supporting these observations are limited due to the very small amount of EAT in experimental animals (rodents).
It is suggested that functions of EAT may include protection of the myocardium against hypothermia (34). In addition, EAT can provide a mechanical protective role for coronary circulation. It can attenuate the torsion developed by the myocardium contraction or the
arterial pulse wave but it has a permissive role as well in positive remodeling of coronary arteries (35).
Besides this, EAT has a substantial role in energy supply to the myocardium and should be considered as a provider of energy source during period of high energy demand (13).
On the other hand, EAT may protect the myocardium from cardiotoxic effect of large amount of FFA due to its capacity of fast FFA utilization (36). Taken together EAT may serve as a unique energy buffering pool in the homeostasis of the myocardium.
In addition, adiponectin secretion from epicardial adipocytes may promote the coronary circulation. Adiponectin improves the endothelial function through stimulation of the nitrogen monoxide synthase, reduces the oxidative stress, and indirectly decreases the level of interleukin-6 (IL-6) and C-reactive protein (CRP) by reducing tumor necrosis factor-α (TNFα) production (37, 38). Adiponectin also has some extracardiac effect such as increased glucose utilization in the hepatocytes and muscle cells which may result in improving insulin sensitivity (39).
1.1.5. EAT in the pathomechanism of atherosclerosis
Some years ago a hypothesis about the direct role of EAT in the development and progression of coronary atherosclerosis has been raised and paracrine and vasocrine effects of EAT due to close proximity of epicardial fat to coronary arteries were supposed (40). The hypothesis was indirectly supported by a pathological study in subjects with myocardial bridge. Namely, no atherosclerosis was observed in coronary segments at myocardial bridge where surrounding fat on the coronary arteries was lacking (41).
In a landmark study, Mazurek et al analyzed epicardial and subcutaneous fat from the lower extremity in obese patients referred for coronary artery bypass grafting. They found increased level of inflammatory mediators (IL-6, TNF-α, interleukin-1β [IL-1β], monocyte chemoattractant protein-1 [MCP-1]), macrophages, lymphocytes and basophils in epicardial fat as compared to subcutaneous fat compartments (42). Others found that
epicardial and omental fat exhibited a broadly comparable pathogenic messenger ribonucleotide acid (mRNA) profile indicating macrophage infiltration into the epicardial fat (43). In another study, mediators of the nuclear factor-kappaB (NFkappaB) and c-Jun N-terminal kinase (JNK) pathways were suggested to involve in the inflammatory profile of EAT highlighting the role of the macrophages in the inflammation within this tissue (44). These studies indicate that chronic inflammation occurs locally as well as systemically potentially contributing further to the pathogenesis of CAD.
It was documented that the epicardial adipocytes had impaired adiponectin secretion and increased leptin production in obese patients with hypertension, metabolic syndrome and CAD (45, 46). This shift in the adiponectin/leptin ratio enhances the development of atherosclerosis. Namely, the decreased adiponectin expression attenuates endothelial function and leads to increased TNF-α production triggering systematic inflammation and oxidative stress. The altered leptin level promotes atherogenic changes in endothelial cells such as increased adhesion of monocytes, higher level of macrophage-to-foam cell transformation, unfavorable changes in lipid levels, and elevation of CRP and inflammatory cytokine levels. All these alterations may lead to development and destabilization of atherosclerotic plaques in coronary arteries (5).
Based on several studies it became widely accepted that EAT should be considered as a source of inflammatory mediators that might directly influence the myocardium and coronary arteries (Figure 5) (47, 48). Two mechanisms of influence (paracrine and vasocrine) were suggested (40). Paracrine way of influence means that adipokines released from pericoronary fat may diffuse across the arterial wall (adventitia, media, and intima) and finally can interact with endothelial cells in the intima and with vascular smooth cells in the media. The alternative vasocrine way of effect can be realized by release of adipocytokines and FFAs from EAT directly into vasa vasorum of the coronary arterial wall (49). It was suggested that vasocrine way of influence may be predominant over paracrine effect in case of more advanced atherosclerotic lesions where inflammatory mediators may diffuse only with difficulties (43).
Figure 5.
Routes for paracrine and vasocrine effects of epicardial adipose tissue on coronary arteries and plaque formation.
IL: interleukin, TNF-α: tumor necrosis factor-α, MCP-1: monocyte chemoattractant protein-1, PAI-1: plasminogen activator inhibitor-1, VEGF: vascular endothelial growth factor
The relationship of EAT with CAD were analyzed by several clinical studies (50-55). In the Framingham and the MESA (Multiethnic Study of Atherosclerosis) epidemiological studies a significant association of epicardial fat with coronary artery calcification was found which remained significant after adjustment for traditional cardiovascular risk factors (56, 57). The increased epicardial fat proved to be associated with more advanced atherosclerosis in another study (58). Epicardial fat was associated with non-calcified coronary plaques as well (59, 60). A significant relationship of increased epicardial fat volume (>130.7 cm3) with vulnerable plaques was also documented (61). The relationship of morphological features of vulnerable plaques (positive remodeling, spotty
calcifications, and low CT attenuation in necrotic core) to the pericardial fat was also studied and the volume of pericardial fat proved to be nearly twice as high in patients with vulnerable plaques as compared to those without CAD (62, 63). Pericardial fat was associated with myocardial ischemia detected by single photon emission computed tomography (SPECT) in patients without known CAD (64). EAT correlated with the degree of coronary atheromatosis suggesting that its excessive accumulation might contribute to the development of acute coronary syndrome and coronary total occlusions (65, 66). In another study, EAT thickness was independently associated with the thrombolysis in myocardial infarction (TIMI) risk score in patients with non-ST-elevation myocardial infarction (NSTEMI) and unstable angina pectoris (67). In patients with the metabolic syndrome increased EAT was associated with impaired coronary flow reserve (68). In a different patient population (in women with chest pain and angiographically normal coronary arteries) EAT thickness was correlated with reduced coronary flow reserve (69). Different surrogate parameters of atherosclerosis were also investigated by others and an association between EAT thickness and carotid intima-media thickness in type 2 diabetic patients as well as in children and adolescents with obesity was found (70, 71). Moreover, EAT showed an independent association with arterial stiffness in an asymptomatic Korean cohort (72). In a recent study, Maurovich-Horvat et al investigated the relationship of different thoracic fat depots with coronary atherosclerosis and found an independent association between pericoronary fat and CAD. In addition, pericoronary fat correlated with inflammatory biomarkers as well suggesting that while systemic inflammation plays a role in the pathogenesis of CAD, there are additional local effects that may exist (73). In a systematic review and meta-analysis an association between the elevated location-specific thickness of EAT at the left atrioventricular groove and the obstructive CAD was found (55).
In the majority of studies increase of EAT volume was associated with stenosis of the coronary arteries (74, 75). Since these studies are cross-sectional it is uncertain whether adipose tissue plays a causal role in the development of atherosclerosis. Importantly, two longitudinal studies have reported results that support the hypothesis of ‘outside to inside signaling’ as a cause of atherosclerosis (56, 76). In these studies, intrathoracic fat and EAT volume were measured and an increase of their quantity was associated with
incident coronary heart disease and with major adverse cardiac events. Associations were independent from BMI and other risk factors, suggesting that EAT is one of the factors contributing to CAD.
1.1.6. Role of EAT in other cardiac and non-cardiac abnormalities
The relationship of EAT with atrial fibrillation was analyzed in several clinical studies (77-79). A strong association between EAT and atrial fibrillation (both paroxysmal and persistent) was documented by Al Chekakie et al; the relationship proved to be independent of traditional risk factors and atrial enlargement (80). In another study, EAT thickness was verified as an independent predictor for post-ablational recurrence of atrial fibrillation (81). In patients with peritoneal dialysis the increased EAT was associated with impaired left ventricle diastolic capacity independently of CRP level, a marker of systemic inflammation (82).
Epicardial fat necrosis is a rare clinical condition, 26 cases were reported till 2011 (83).
It should be considered among differential diagnoses of chest pain. The etiology is obscure, but the prognosis is good. In general, the presenting symptom is left-sided chest pain in a previously healthy individual with an associated juxtacardiac mass seen in chest radiography. CT or MRI may confirm the correct diagnosis resulting in the avoidance of surgical intervention.
Typically, type 2 diabetes is preceded by prediabetes but insulin resistance syndrome due to obesity may be the first pathological stage in the long-lasting asymptomatic period of diabetes. The insulin resistance syndrome (called also as the metabolic syndrome) includes insulin resistance and different metabolic abnormalities (elevated serum triglycerides, lower HDL-cholesterol, hyperglycemia) as well as elevated blood pressure.
Obesity, especially abdominal visceral fat accumulation plays a central role in this syndrome. Although the use of term and the suggested pathomechanism of the metabolic syndrome became debatable some years ago, the association between the enlarged
abdominal visceral fat compartment and the increased cardiovascular risk remained unquestionable (84).
Several clinical investigations were dedicated to assess the characteristics of EAT in the metabolic syndrome, prediabetes and type 2 diabetes. In a meta-analysis, EAT was 7.5 ± 0.1 mm in thickness in the metabolic syndrome (n=427) compared to 4.0 ± 0.1 mm in controls (n=301) and EAT correlated significantly with the components of the metabolic syndrome (85). EAT volume was significantly higher in patients with type 2 diabetes than in nondiabetic subjects and EAT volume was significantly associated with components of the metabolic syndrome (58). In asymptomatic type 2 diabetic patients the thickness of EAT proved to be an independent risk factor for significant coronary artery stenosis but not for silent myocardial ischemia (86). A strong correlation was found between fasting plasma glucose and EAT measured with CT or echocardiography (87, 88). EAT quantity was higher in patients with type 2 diabetes mellitus compared to lean subjects or obese patients without diabetes. In addition, the difference in EAT volume between men and women was more pronounced in subjects with impaired fasting glucose or diabetes mellitus (89). A clear relationship of epicardial fat and serum alanine aminotransferase (ALT) and aspartate aminotransferase (AST) activity, surrogate markers of fatty liver, were documented in a cross-sectional, observational study (90). Taken together, the insulin resistance syndrome (the metabolic syndrome), type 2 diabetes, non-alcoholic fatty liver disease (NAFLD) and CAD are associated with increased amount of epicardial fat (91).
The role of EAT was also investigated in type 1 diabetes. Interestingly, higher epicardial fat and serum leptin levels were found in subjects with type 1 diabetes than in non- diabetic controls. The epicardial fat thickness and serum leptin levels proved to be the best independent correlates of each other in patients with type 1 diabetes independently of BMI, glycemic control and daily insulin requirement (92). Recently, patients with type 1 diabetes (n=100) from the Diabetes Control and Complications Trial / Epidemiology of Diabetes Interventions and Complications (DCCT/EDIC) study were investigated. In this pilot study, the accumulation of adipose tissue in epicardial and intra-thoracic spaces were highly associated with greater body mass index (BMI), bigger waist to hip ratio,
greater weighted glycated hemoglobin values, elevated triglycerides and a history of elevated albumin excretion rate or end-stage renal disease (93).
1.1.7. Treatment options for modifying EAT volume
Lifestyle changes, bariatric surgery and different drugs may apply. Reduction in weight (BMI) by using very-low calorie diet resulted in a decrease of EAT volume in severely obese subjects (n=20; echocardiographic EAT thickness at baseline: 12.3±1.8 mm, at 6 months follow-up: 8.3±1.0 mm; p=0.001) (94). Similarly, beneficial effect was observed as a result of regular exercise training in a small group of patients (n=24;
echocardiographic EAT volume at baseline: 8.11±1.64 mm, at 12 weeks follow-up:
7.39±1.54; p<0.001) (95). In addition, EAT volume decreased after bariatric surgery as well, however one study found that myocardial triglyceride content did not change significantly (96, 97). In a meta-analysis, diet or bariatric surgery proved to be more beneficial than exercise training in reducing EAT volume (98). The effect of drugs on EAT is controversial (99-101). Atorvastatin resulted in a more pronounced decrease of EAT than simvastatin/ezetimibe (102). Pioglitazone compared with metformin increased pericardial fat volume in patients with type 2 diabetes (103). Short term (3 months) use of glucagon-like-receptor agonists (exenatide, liraglutide) decreased the volume of EAT in type 2 diabetic patients (104). In a longer (26 weeks) randomized controlled trial exenatide twice daily (versus standard antidiabetic treatment) proved to be effective in reducing both epicardial and liver fat content in obese patients with type 2 diabetes (n=44). In this study EAT volume was measured by MRI and expressed as ml; the initial EAT value changed by -8.8±2.1% in the exenatide group whereas minimal change was observed in patients with standard treatment (-1.2±1.6%; p=0.0003). The beneficial effect was mainly weight loss dependent (105). In another pilot study, sitagliptin, a dipeptidyl- peptidase-4-inhibitor, also decreased the volume of EAT in a 24-week long study with obese type 2 diabetic patients (n=26); echocardiographic EAT thickness decreased from 9.98±2.63 mm to 8.10±2.11 mm; p<0.001) (106). Lately, SGLT2-inhibitors are emerging as potential new therapeutic options as multiple studies reported a significant decrease in EAT volume after treatment (107-109). For example, a small study from Japan (108)
documented that EAT volume (measured by CT) significantly decreased by the end of 6 months follow-up in type 2 diabetic patients (n=40) with dapagliflozin treatment vs.
conventional antidiabetic therapy (-16.4±8.3 cm3 vs. 4.7±8.8 cm3; p=0.01). Clearly, EAT should be considered as a novel therapeutic target and statins, as well as antidiabetic drugs are the best candidates so far (110, 111).
1.2. Relationship of EAT to other fat compartments
Association between EAT and other fat compartments was investigated by several authors and was a topic of a recent position statement (57, 112, 113). Generally, EAT volume and obesity parameters (weight, BMI and waist circumference) are closely related (85, 114). Nevertheless, the clinical significance of abdominal subcutaneous adipose tissue (SAT) and visceral adipose tissue (VAT) differ. While abdominal SAT should be considered as a manifestation of enlarged fat depot, abdominal VAT is involved in the pathomechanism of the metabolic syndrome and may increase the cardiovascular risk through production of different cytokines (4). Particular abdominal fat depots carry specific clinical consequences. The enlarged visceral fat depot is characterized primarily with increased lipolysis leading to hepatic steatosis. Non-alcoholic fatty liver disease is often regarded as the hepatic manifestation of the insulin resistance (115) and is considered as a novel predictor of cardiovascular disease (116, 117). Importantly, NAFLD may progress from steatosis to non-alcoholic steatohepatitis (NASH) and even to cirrhosis and liver cancer (118). There are some publications indicating that EAT volume is associated with increasing hepatic lipid accumulation (119). Interestingly, fat deposition in the pancreas (fatty pancreas), termed non-alcoholic fatty pancreas disease (NAFPD) has gained much attention only in the last years (120). Lipid accumulation in pancreas may promote the development of chronic pancreatitis and exacerbate the clinical picture of acute pancreatitis (121). The potential relationship of pancreatic lipid accumulation with β-cell dysfunction is debated (122). NAFLD may often coexist with NAFPD (123).
1.3. Contribution of genetic and environmental factors on fat compartments
As fat compartments differ in embryogenetic origin, physiological and pathophysiological functions (124) it is plausible that their accumulation leads to local or systemic adiposity and increase of their quantity is influenced by genetic and environmental factors. Classical twin studies compare monozygotic (MZ) and dizygotic (DZ) same-gender twin pairs to help evaluate the degree of genetic and environmental influences on body composition (125).
As for obesity (BMI) in general, earlier studies demonstrated a predominant genetic effect on BMI. It seems that anthropometric parameters (weight, height and, consequently BMI) are highly dependent on genetics. In a clinical study with twins from Hungary, phenotype of weight proved to be dependent on genetic factors by 88% (126). An international twin study documented that heritability contributed by 82% for weight and by 79% for BMI phenotypes (127). In a twin study from the United States, 63.6% of the total variance of BMI was explained by genetic components (128). In a review paper, authors reported heritability estimates of BMI between 0.57 and 0.86 in twins from early adulthood to late middle age (129).
As for abdominal obesity (waist circumference), genetic and environmental influences were also investigated, and authors found in an earlier study performed by dual-energy x-ray absorptiometry that genetics highly predominated over environmental factors in contribution to phenotype (130). In the already mentioned Hungarian twin study heritability for waist circumference was calculated as high as 71% (126). This number was 74% in the international twin study (127).
Abdominal SAT and VAT quantities were evaluated in the Framingham Heart Study Offspring and Third-Generation Study cohorts. It has been shown by CT imaging that abdominal SAT and VAT quantities have a heritability of 57% and 36%, respectively (131). However, the methodology for evaluating heritability in this study differed from that of classical twin studies.
Intraabdominal adipose tissue compartments were investigated in early family studies as well, where estimates for VAT ranged between 42% and 56% whereas that of SAT proved to be 42% (132, 133). Taken together, data regarding the heritability of abdominal adipose tissue compartment sizes are scarce and the findings are based on family studies and on measurement methods with limited accuracy.
Regarding EAT, we did not find former data available whether EAT compartment quantity depends predominantly on genetic or environmental factors.
1.4. Summarizing data from the literature
The epicardial fat is a unique fat compartment localized between the myocardial surface and the visceral layer of the pericardium. The EAT can be quantified by non-invasive cardiac imaging techniques such as echocardiography, MRI or cardiac CT.
Among physiological determinants of EAT age, gender, body weight and ethnicity should be considered. Physiological functions of EAT may include protection of the myocardium against hypothermia and a mechanical protective role for coronary circulation. In addition, EAT may serve as a unique energy buffering pool in the homeostasis of the myocardium.
As for pathophysiological functions it is widely accepted that EAT should be considered as a source of inflammatory mediators that might directly influence the myocardium and coronary arteries. In line with these observations clinical studies suggested that EAT - through paracrine and vasocrine effects - may have an impact on the development and progression of coronary atherosclerosis. In addition, an association between increased EAT and atrial fibrillation was also documented. The insulin resistance syndrome (the metabolic syndrome), type 2 diabetes, NAFLD and CAD proved to be associated with increased amount of epicardial fat. Interestingly, an accumulation of EAT was observed also in patients with type 1 diabetes.
Treatment options for modifying EAT volume include lifestyle changes, bariatric surgery and using different drugs. Weight reduction in obese subjects may lead to a decrease in EAT volume while effects of different drugs on EAT are controversial. Nevertheless, EAT should be considered as a new cardiovascular therapeutic target.
No data are available whether EAT compartment quantity depends predominantly on genetic or environmental factors. Furthermore, data regarding the heritability of abdominal adipose tissue compartment sizes are scarce and the findings are based on family studies and on measurement methods with limited accuracy.
2. Aims
After adopting a proper and reliable method for evaluating the quantity of EAT by using cardiac CT scan in our department, we designed a study to evaluate the heritability of EAT quantity in comparison to that of abdominal SAT and VAT volumes. Then, we assessed the association between EAT volume and the presence of CAD in order to evaluate to potential role of EAT in the development of CAD.
The aims of the study were
2.1. to evaluate the heritability of EAT quantity - for this reason a classical twin study was performed and genetic and environmental influences on EAT volumes were estimated; in addition, a special attention was paid to evaluating heritability of EAT in comparison to that of abdominal SAT and VAT volumes;
2.2. to assess the relationship of EAT volume to the presence of CAD - for this reason the association between EAT quantity and radiomorphological signs of CAD was evaluated.
3. Methods
3.1. Classical twin study 3.1.1. Patients
The study was conducted as a part of the BUDAPEST-GLOBAL (Burden of atherosclerotic plaques study in twins - Genetic Loci and the Burden of Atherosclerotic Lesions) clinical study; the participants had been co-enrolled with the large, international, multicenter Genetic Loci and the Burden of Atherosclerotic Lesions (GLOBAL) clinical study (http//:www.ClinicalTrials.gov: NCT01738828) (134, 135).
The primary aim of the BUDAPEST-GLOBAL clinical study was to evaluate the influence of genetic and environmental factors on the burden of coronary artery disease.
We hypothesized that the correlation of coronary plaque volume would be stronger between the MZ twins as compared to DZ twins, which might suggest that this CAD phenotype could be mainly driven by genetic factors. The secondary aims of the study were to quantify the heritability of coronary artery geometry, furthermore to assess the association between CAD heritability and the heritability of hepatic lipid accumulation, epicardial and abdominal adipose tissue quantity, carotid intima-media thickness and hemodynamic parameters. Classical and new cardiovascular risk factors were measured and potential associations with coronary artery disease and adipose tissue compartments were analyzed. In this PhD work, results of measurements of EAT and abdominal fat quantities and those of a clinical study performing to assess the potential association between EAT quantity and CAD are summarized.
In the BUDAPEST-GLOBAL clinical study we searched the Hungarian Twin Registry's database (136) to identify adult MZ and same-sex DZ twins whose previously registered disease history meets the inclusion criteria of the study. The aim was to balance the overall participation for 50% females and at least 50% DZ twins. These twins were contacted by phone or email and the study protocols were described in detail. Thereafter, detailed study description was sent by email or mail to twins, which included inclusion
and exclusion criteria as well. The majority (90%) of the contacted twin pairs were willing to participate. Inclusion and exclusion criteria are listed in Table 3. Of note, subjects with pregnancy, regular alcohol consumption (more than 2 units daily), conditions possibly interfering with compliance during CT scanning and acute infection within three weeks were excluded from the study.
Table 3. Enrollment criteria Inclusion criteria
1. Monozygotic (MZ) twins and same-sex dizygotic (DZ) twins 2. Age: females 40-75 years, males 35-75 years
3. The participant has signed the institutional review board/ethics committee- approved informed consent form
Exclusion criteria
1. Subjects for whom coronary computed tomography angiography is contraindicated per institutional standard of care (history of severe and/or anaphylactic contrast reaction, inability to cooperate with scan acquisition and/or breath-hold instructions, pregnancy, clinical instability, and renal insufficiency).
2. Subjects with previous coronary arterial revascularization (percutaneous coronary intervention or coronary artery bypass grafting)
3. Subjects with atrial fibrillation/flutter or frequent irregular or rapid heart rhythms, which occurred within the past 3 months
4. Subjects with a pacemaker or implantable cardioverter-defibrillator implant 5. Active congestive heart failure or the presence of known non-ischemic
cardiomyopathy
6. Known genetic disorders of atherosclerosis, lipid, or lipoprotein metabolism
All subjects were asked not to smoke and not to eat three hours, not to drink alcohol and coffee ten hours prior to the examinations. During the enrolment, the zygosity was assessed using a standardized questionnaire based on seven self-reported responses (137).
The timeline of study procedures is described in Table 4.
Table 4. Timeline of study procedures
Procedure Assessed parameters
Day 1 Physical examination Anthropometric parameters
Questionnaire Past medical history and current lifestyle Blood draw Laboratory parameters and panomics data Non-contrast enhanced CT Agatston-score, epicardial fat, hepatic
lipid accumulation, abdominal fat Contrast-enhanced CT Coronary plaque and geometry
Day 2 Echocardiography Standard analysis and speckle tracking Vascular ultrasonography Both carotid and femoral arteries
Hemodynamic measurements Brachial and central blood pressures, pulse wave velocity values, augmentation indices
In the BUDAPEST-GLOBAL study we enrolled prospectively a total of 202 twin subjects (101 twin pairs) between April 2013 and July 2014. We summarize the main clinical characteristics of the patients here in Table 5. As in some patients we recognized inadequate image quality for the respective analysis, the number of patients in a particular clinical study differed from that of the total cohort. Therefore, the patients’ characteristics of the specific clinical study are incorporated into the relevant results.
The national ethics committee approved the BUDAPEST-GLOBAL study (ETT TUKEB: 58401/2012/EKU [828/PI/12]; Amendment: 12292/2013/EKU). All patients provided written, informed consent before the investigations. The study was carried out according to the principles stated in the Declaration of Helsinki.
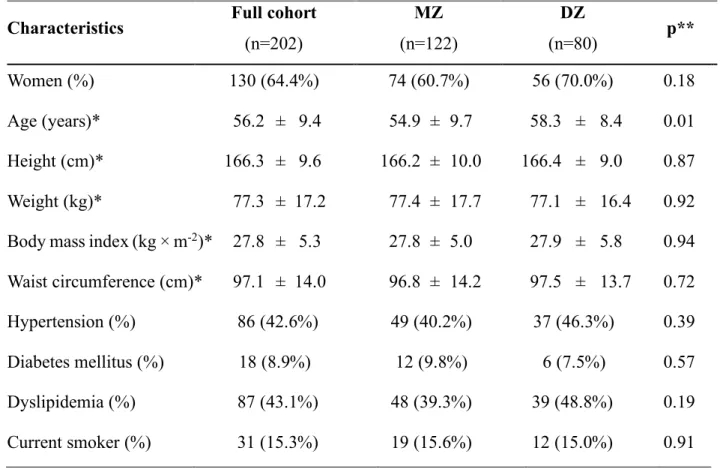
Table 5. Demographics, twin characteristics in the BUDAPEST-GLOBAL study
* Data are mean values plus or minus standard deviation.
** Difference between MZ and DZ twins: t-test or Chi-square test as appropriate.
Characteristics Full cohort (n=202)
MZ
(n=122)
DZ
(n=80) p**
Women (%) 130 (64.4%) 74 (60.7%) 56 (70.0%) 0.18
Age (years)* 56.2 ± 9.4 54.9 ± 9.7 58.3 ± 8.4 0.01 Height (cm)* 166.3 ± 9.6 166.2 ± 10.0 166.4 ± 9.0 0.87 Weight (kg)* 77.3 ± 17.2 77.4 ± 17.7 77.1 ± 16.4 0.92 Body mass index (kg × m-2)* 27.8 ± 5.3 27.8 ± 5.0 27.9 ± 5.8 0.94 Waist circumference (cm)* 97.1 ± 14.0 96.8 ± 14.2 97.5 ± 13.7 0.72
Hypertension (%) 86 (42.6%) 49 (40.2%) 37 (46.3%) 0.39
Diabetes mellitus (%) 18 (8.9%) 12 (9.8%) 6 (7.5%) 0.57
Dyslipidemia (%) 87 (43.1%) 48 (39.3%) 39 (48.8%) 0.19
Current smoker (%) 31 (15.3%) 19 (15.6%) 12 (15.0%) 0.91
3.1.2. Anthropometric data and medical history
Complete physical examination was performed and anthropometric parameters (weight, height and waist circumference) were recorded. Weight was measured with calibrated digital scale while height was recorded with a wall-mounted stadiometer. Body mass index (BMI - kg/m2) was calculated from weight and height values (weight [kg] was divided by height [m] on square meter). We measured waist circumference by a standard method at the midpoint between the lowest rib and the iliac crest at the end of expiration, placing the tape horizontally.
Brachial blood pressure was measured prior the CT. A 12-lead ECG and echocardiographic evaluation were performed in each twin subject.
Smoking habit was assessed and smoking years were recorded and alcohol consumption was evaluated as units per week. Physical activity, diet and socio-economic status were assessed by using questionnaires. Prevalence of hypertension, diabetes mellitus, dyslipidemia and cerebrovascular disease was documented based on the medical history of the participants.
3.1.3. Laboratory parameters
Enrolled twins underwent a peripheral blood draw, and blood was aliquoted and stored as whole blood, plasma, serum, and buffy coat. All subjects underwent whole genome sequencing according the protocol described in the GLOBAL study (134). This part of the study is still ongoing and does not belong to the current PhD work. Conventional biomarker testing was performed at Health Diagnostic Laboratory, Inc (Richmond, VA;
United States of America). Fasting lipid profile was measured on an auto-analyzer using standard clinical methods (Beckman-Coulter). Hemoglobin A1c was measured using Trinity Biotech reagents (Trinity Biotech USA Inc, Jamestown, NY).
3.1.4. Epicardial fat volumetric assessment
Every subject underwent a non-contrast enhanced CT scan of the heart using a 256-slice CT scanner (Philips Brilliance iCT, Philips Healthcare, Best, The Netherlands; 120 kVp with tube current of 20 to 50 mAs depending on BMI, gantry rotation time 270 ms). The pericardial space was manually traced in each CT-slice in the native cardiac CT datasets.
The adipose tissue was defined as tissue in the attenuation range of -45 to -195 HU. EAT was defined as any adipose tissue within the visceral pericardium from the level of the right pulmonary artery to the diaphragm (57, 113). The EAT segmentation was automatically interpolated within the manually traced region of interest (ROI), and the volume was calculated by using an offline workstation (Extended Brilliance Workspace, Philips Healthcare, Best, The Netherlands). Representative cases from the twin study can be seen in Figure 6.
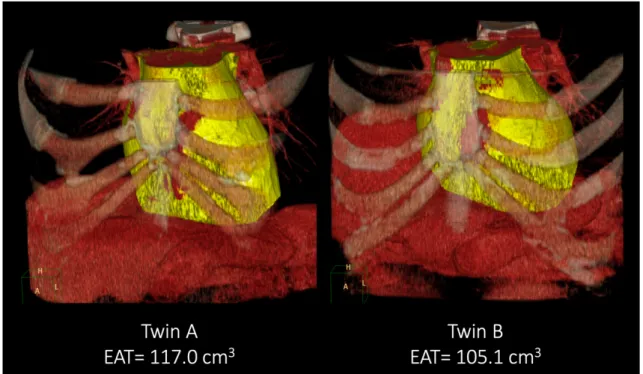
Figure 6. Epicardial adipose tissue (EAT) quantity
Representative cases from the study: epicardial fat volume in a monozygotic twin pair.
Volume rendered reconstructions are shown of the mediastinal region; epicardial fat volume is marked with yellow.
3.1.5. Assessment of abdominal SAT and VAT
Subsequently after the non-enhanced cardiac CT a single 5 mm thick slice (120 kVp; 200 mA; gantry rotation time, 270 ms) was acquired at the level of L3-L4 vertebrae. The single CT slice was loaded onto an offline workstation and the subcutaneous adipose tissue (SAT) and visceral adipose tissue (VAT) areas (cm2) were measured using a dedicated offline workstation (Extended Brilliance Workspace, Philips Health Care, Best, The Netherlands). A semi-automated software tool identified the abdominal muscular wall separating the SAT and VAT compartments with the possibility of manual adjustment when needed. To identify pixels containing adipose tissue an attenuation range of -45 to -195 HU was defined (138).
Importantly, the native CT of the heart and abdomen resulted in a small (0.70 ± 0.16 mSv) radiation dose.
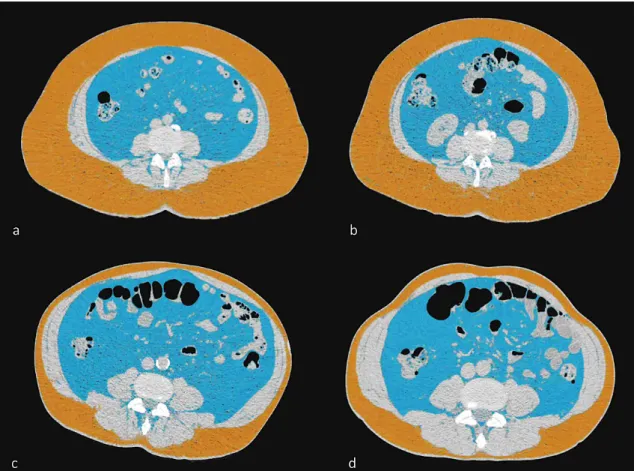
Representative cases from the twin study can be seen in Figure 7.
Figure 7. Abdominal subcutaneous and visceral adipose tissue compartments (SAT and VAT) in monozygotic twin pairs - representative cases from the study
a-b) Axial images of the abdomen at the level of the L3/L4 vertebrae. Subcutaneous fat (orange color) is predominant in this monozygotic twin pair.
c-d) Axial images of the abdomen at the level of the L3/L4 vertebrae. Visceral fat (blue color) is more prominent in this monozygotic twin pair.
3.1.6. Cardiac computed tomography
ECG triggered coronary CT angiography (CTA) was performed using a 256-slice multidetector CT (Brilliance iCT, Philips Health Care, Best, The Netherlands). We administered per os β-blockers (metoprolol, maximum dose 100 mg) 1 hour before the CT scan if the heart rate was >65 beat per minute. Intravenous β-blocker (metoprolol) was administered (maximum cumulative dose 20 mg) on the table if the heart rate was still higher than 65 beat per minute. Sublingual nitroglycerin (0.8 mg) was administered on the table, maximum 2 minutes before the image acquisition. Images were acquired during a single inspiratory breath hold in axial mode with 270 ms rotation time, 128×0.625 mm collimation, tube voltage of 100-120 kVp, maximum effective tube current-time product of 200-300 mAs at 78% of the R-R interval. Triphasic contrast injection protocol was used with 80 mL of iodinated contrast agent in average (Iomeprol 400 g/cm3, Iomeron, Bracco Imaging S.p.A., Milano, Italy); mixture of contrast agent and saline (10 mL contrast agent and 30 mL saline); and 40 mL saline solution, all injected at a rate of 4.5-5.5 ml/s. We have reconstructed the minimum slice thickness (0.8 mm) available in prospective ECG triggered image acquisition with an increment of 0.4 mm, which resulted in an approximately 0.6 mm isotropic resolution. The mean effective radiation dose of the coronary CTA scans was 3.64±1.04 mSv (dose length product:
260.1±74.5 mGy×cm). All image analyses were performed offline on dedicated cardiac workstations (Intellispace Portal, Philips Healthcare, Best, The Netherlands).
3.1.7. Coronary plaque assessment
The coronary CTA datasets were analyzed on a qualitative and quantitative basis.
Coronary segments with a minimum diameter of 2.0 mm are included in the analysis.
Each coronary segment is assessed for presence of plaque, plaque type, degree of stenosis, plaque features and plaque attenuation pattern. Coronary plaque is classified as non- calcified plaque, partially calcified plaque or calcified plaque (139, 140). Stenosis is graded as none, minimal (<25%), mild (25%-49%), moderate (50%-69%), severe (70%- 99%), or occlusion (100%), based on visual estimation of percent diameter stenosis (139).
Segment involvement score and segment involvement score index is used to provide a semi-quantitative measurement of plaque burden (141). In the clinical study for evaluating the relationship of EAT volume to the CAD, coronary CTA was evaluated on subject-to-subject basis and subjects were classified into groups with and without CAD (CAD-positive and CAD-negative subjects).
3.1.8. Reproducibility of measuring EAT, SAT and VAT quantities
For assessing the reproducibility of EAT, SAT and VAT quantity measurements, two readers (Adam L. Jermendy, Zsofia D. Drobni) performed repeated measurements on 10 randomly selected MZ twin pairs and 10 randomly selected DZ twin pairs images in order to determine the intra-class correlation coefficient (ICC).
3.1.9. Statistical analysis
Continuous variables are expressed as mean ± standard deviation (SD), whereas categorical variables are expressed as numbers and percentages. MZ and DZ twins were compared using Student's t-tests and Chi-square tests. Correlations were calculated using Pearson correlation coefficients. Coefficient values are interpreted as: 1.00 - 0.81:
excellent; 0.80 - 0.61: good; 0.60 - 0.41: moderate; 0.40 - 0.21: fair; 0.20 - 0.00: poor (142). Descriptive statistics, correlations and reproducibility measurements were calculated using IBM SPSS Statistics version 23 (IBM, Armonk, NY, USA).
Heritability was assessed in two steps; first, co-twin correlations between the siblings were analyzed in MZ and DZ pairs separately. Next, genetic structural equation models were used to model the magnitude of genetic and environmental factors influencing the different fat compartments.
All phenotypes are caused by genetic and environmental factors. MZ twins share nearly 100% of their genome, while DZ twins only share half. Genetic similarity is caused by additive genetic components (A). While MZ twins share almost 100% of A, DZ twins only share 50% of A. Environmental components are grouped as common factors (C)
i.e. same early childhood, education in the same school, living in the same town, etc.
which equally effect the siblings and unique factors (E) such as specific eating and drinking habits, different physical activity and life-style, etc. which cause differences within families. In our study, both MZ and DZ twins shared 100% of their C factors and none of their E factors. Covariance between the siblings can be decomposed into A, C and E latent variables using genetic structural equation models (143). The likelihood ratio test was used to assess the fit of submodels compared to the full model. If the fit did not decrease significantly by removing one of the parameters, then the more parsimonious submodel was selected. Furthermore, multivariate genetic models can be used to further decompose the results of the heritability estimates into common and unique genetic and environmental factors. Common genetic factors refer to genes that are driving the heritability of all three fat components simultaneously (Ac), while common (Cc) and unique (Ec) environmental factors refer to circumstantial factors that affect the heritability of all three phenotypes. The remaining variance then can be attributed to genetic (As), common (Cs) and unique (Es) environmental factors specific of a given phenotype, which are independent of the other phenotypes. Therefore, the heritability of the fat compartments was decomposed to common (Ac, Cc, Ec) and specific (As, Cs, Es) genetic and environmental factors. Independent and common pathway models were used to find the most parsimonious model best describing our data. All calculations were adjusted for age and sex. Log likelihood-based 95% confidence intervals (CI) were calculated for all estimated parameters. All calculations were performed using R version 3.2.5. (144). Twin modelling was performed using OpenMx version 2.5.2 (145). A p value lower than 0.05 was considered significant.
3.2. Assessing the relationship of EAT volume to CAD
3.2.1. Patients and methods
We included 195 subjects (age: 56.1±9.4 years, female 64.1%) from the BUDAPEST- GLOBAL study. All subjects underwent coronary CT angiography (CTA) and were classified into groups with and without CAD (CAD-pos: n=106 and CAD-neg: n=89,
respectively), based on the presence or absence of any plaque in coronary CTA. In addition, we measured the EAT volume on a native cardiac scan and the abdominal adipose tissue areas on a single CT-slice acquired at the L3/L4 level. Details of methods are given in the previous sections.
3.2.2. Statistical analysis
We used Student’s unpaired t-test for assessing the statistical difference between CAD- pos and CAD-neg groups and a robust maximum likelihood estimation for correcting the potential bias from set of twins. We estimated the association between CAD and risk factors (including EAT, SAT and VAT values) using a logistic regression analysis. We used female gender, age, hypertension, dyslipidemia, diabetes mellitus, BMI, EAT, SAT and VAT in the model.
4. Results
4.1. Assessing genetic and environmental influences on EAT quantity in comparison to abdominal SAT and VAT volumes
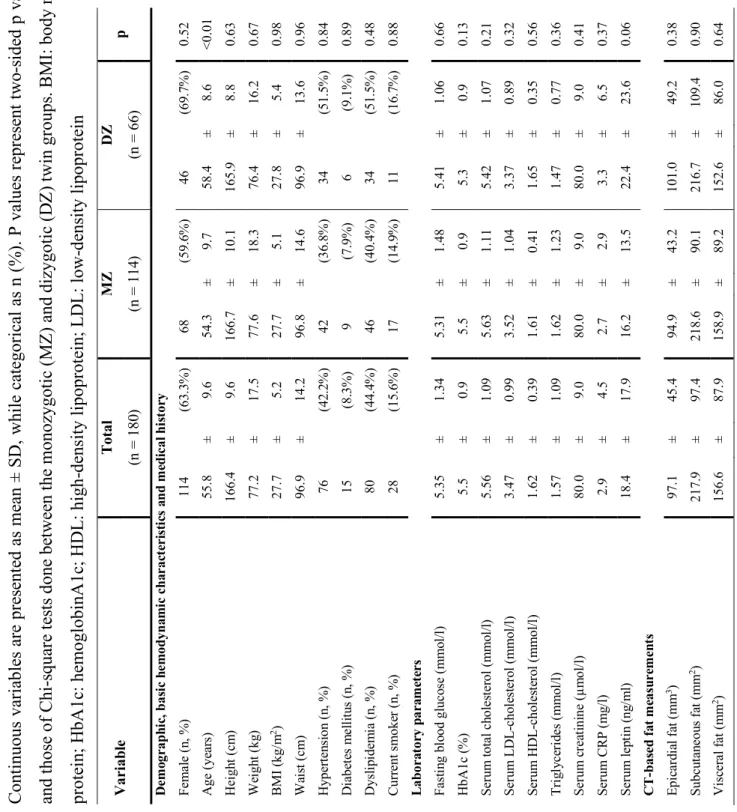
Overall, 180 twins (57 MZ twin pairs, 33 DZ twin pairs) were included from the BUDAPEST-GLOBAL study. Our study population represents a middle-aged, slightly overweight Caucasian population (Table 6).
Intra-reader agreement showed excellent reproducibility for all CT based fat measurements as intra-class correlations (ICC) proved to be higher than 0.98 (ICCEAT = 0.99; ICCSAT = 0.98; ICCVAT = 0.99). We also found excellent reproducibility regarding inter-reader variability (ICCEAT = 0.98; ICCSAT = 0.99; ICCVAT = 0.99).
Co-twin correlations between the siblings showed that for all three parameters, MZ twins have stronger correlations than DZ twins, suggesting prominent genetic effects (EAT: rMZ
= 0.81, rDZ = 0.32; SAT: rMZ = 0.80, rDZ = 0.68; VAT: rMZ = 0.79, rDZ = 0.48).
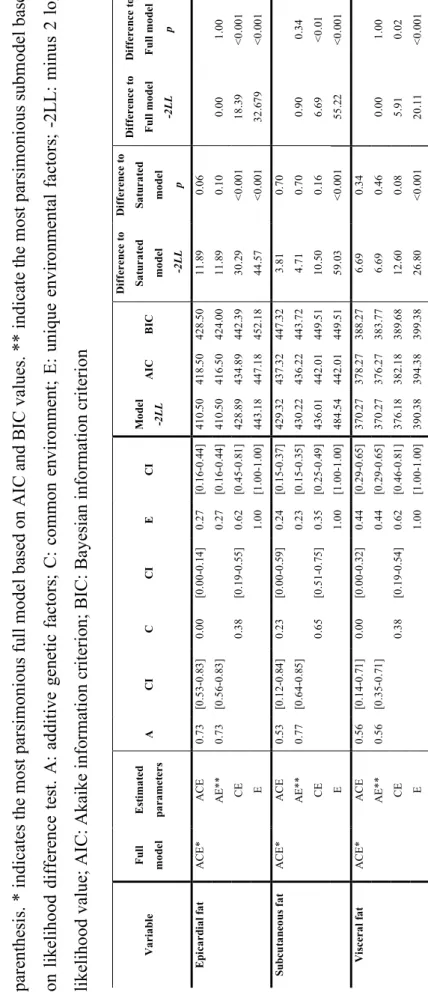
For all three fat compartments AE model excluding common environmental factors proved to be best fitting [EAT: A: 73% (95% CI = 56%-83%), E: 27% (95% CI = 16- 44%); SAT: A: 77% (95% CI = 64%-85%), E: 23% (95% CI = 15%-35%); VAT: A: 56%
(95% CI = 35%-71%), E: 44% (95% CI = 29%-65%)]. Detailed results can be found in Table 7.
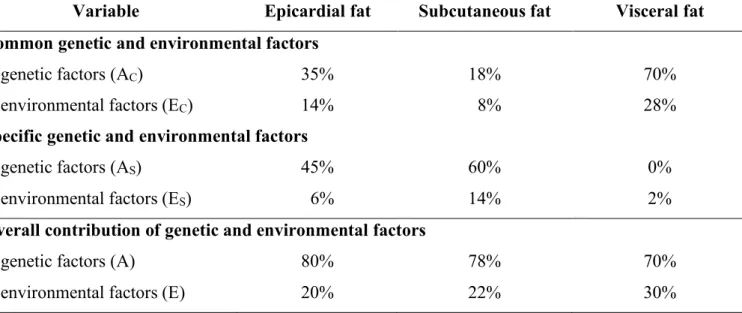
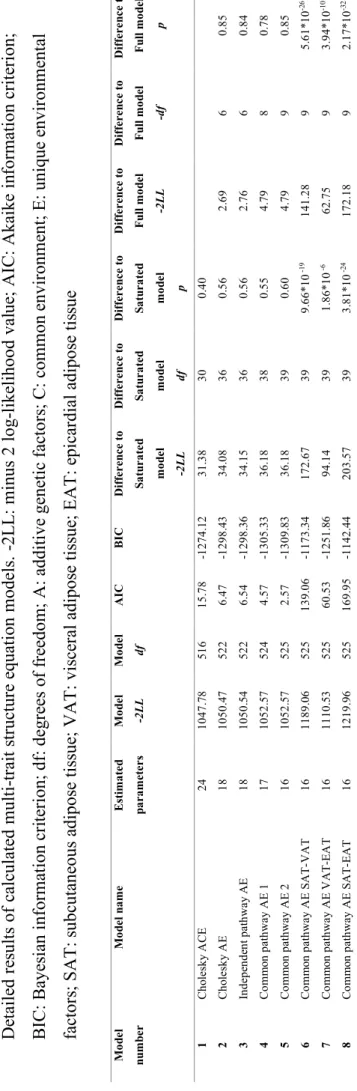
In multi-trait model fitting analysis overall contribution of genetic factors to EAT, SAT and VAT was 80%, 78% and 70%, whereas that of environmental factors was 20%, 22%
and 30%, respectively (Table 8). We began with multi-trait model fitting by running a Cholesky decomposition of our data (Model 1, Cholesky ACE). All further models were compared to this full model. We dropped all C-s in the 2. model (Model 2, Cholesky AE) which did not decrease fit significantly (p = 0.85, AIC = 6.47) indicating the insignificance of common environmental factors, thus later models only assuming A and E factors were considered. Independent pathway model calculating with common and specific A and E factors (Model 3, Independent pathway AE) showed slightly worse fit
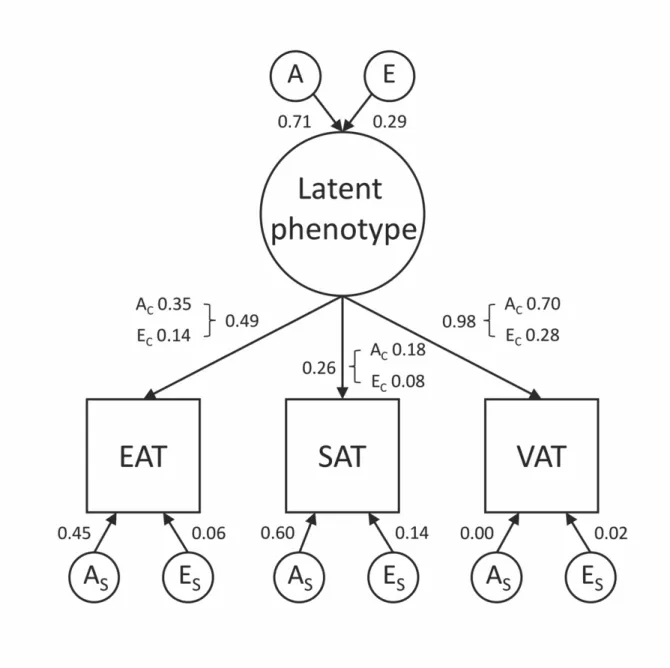
than model 2 (p = 0.85, AIC = 6.54). We calculated a common pathway model (Model 4, Common pathway AE 1) where common A and E factors were mediated through a latent phenotype, while the residual variance was decomposed to specific A and E factors which showed better fit based on information criteria measures (p = 0.78, AIC = 4.57). A model similar to the previous one (Model 5, Common pathway AE 2) but dropping the specific A of VAT proved to be the best fitting model (p = 0.85, AIC = 2.57). Detailed contribution of common and specific genetic and environmental factors for all three fat compartments can be found in Table 8, while the path diagram of the model can be found in Figure 8.
Results of the multi-variate analysis suggest that a common latent phenotype is associated with the tissue compartments investigated. Based on our results, 98% (95% CI = 77%- 100%) of VAT heritability can be accounted by this common latent phenotype which also effects SAT and EAT heritability. This common latent phenotype accounts for 26% (95%
CI = 13%-42%) of SAT and 49% (95% CI = 32%-72%) of EAT heritability. This common latent phenotype is influenced by genetics in 71% (95% CI = 54%-81%) and environmental effects in 29% (95% CI = 19%-46%). Accordingly, the proportion of common and specific genetic and environmental factors contributing to the adipose tissue quantities may differ from each other, for example in case of EAT heritability is caused by 35% common genetic, 45% specific genetic, 14% common environmental, and 6%
specific environmental factors (Figure 8).
We also assessed whether the heritability of one of the parameters was independent of the remaining two phenotypes. To answer these questions, we ran common pathway models where the EAT did not have any common factors to SAT and VAT (Model 6, Common pathway AE SAT-VAT), but this showed significantly decreased fit as compared to the full model (p = 5.61*10-26, AIC = 139.06). A model suggesting SAT was independent of VAT and EAT (Model 7, Common pathway AE VAT-EAT) also showed significantly decreased fit (p = 3.94*10-10, AIC = 60.53). The last model where we assumed VAT to be independent of SAT and EAT (Model 8, Common pathway AE SAT- EAT) showed the worse fit (p = 2.17*10-32, AIC = 169.95). These results all suggest that none of the phenotypes is independent of the other two, thus the heritability of EAT or
SAT or VAT phenotype is associated with the remaining two phenotypes. Detailed model fit results can be found in Table 9.