DOCTORAL (PhD) DISSERTATION THESES
PÉTER JANKOVICS
KAPOSVÁR UNIVERSITY
Department of Agricultural Economics and Management
2017
DOI 10.17166/KE2018.008
KAPOSVÁR UNIVERSITY
FACULTY OF ECONOMIC SCIENCE
DEPARTMENT OF COMPANY ECONOMICS AND ORGANIZATION
Head of Doctoral School:
Prof. Dr. Sándor Kerekes, Doctor of Hungarian Academy of Sciences
Supervisor:
Dr. Csaba Borbély, PhD
FACTS AFFECTING THE COMPANY LEVEL COMPETITIVENESS OF THE HUNGARIAN BROILERS
SECTOR
Prepared by:
PÉTER JANKOVICS
Kaposvár 2017
1. Background of Research, Objective
The continuous examination of the facts affecting the competitiveness and the plant level development and optimization of the ones being directly controllable by the companies are justified by the fierce market competition.
That inspires the producers to reduce the unit costs, and in this interest to improve continuously the efficiency parameters. An indispensable condition of that is the application of the best genotypes during the production, but that creates only the possibility of increasing efficiency as under the actual macroeconomic conditions the requirements of the genetic background must be maximally met also by the additional resources used during the production.
The objective of the thesis is to disclose the facts affecting the plant level fattening of broilers and the relationship between them, and their evaluation referring to Hungary. The dimension of the competitiveness examination is the plant level, while the measurement numbers are the cost and income conditions of the activity, and the production parameters, efficiency indicators affecting them.
In connection with the objective, in my thesis I want to get answer to the following questions:
1. What kind of relation can be demonstrated between the broiler feedstuffs and cereal prices?
2. What were the main input-output prices and production parameters trends in the broiler sector in Hungary during the last 30-35 years, and what type of relation can be demonstrated between these facts and the cost, income of the production?
3. What type of economic effect can be demonstrated as a result of the differences between the genetic basis and their performance realized in the practice?
In connection with these questions I formulated the following hypotheses:
H1: the broiler feedstuffs and cereal prices are in connection with each other, the change of the cereal prices can be followed up in the broiler feedstuffs, as well.
H2: During the past 35 years, the increase of the input prices did not appear fully in the broiler selling price, and that had an adverse effect to the income relations of the sector.
H3: The development of the production parameters advantageously affected the production cost of broiler fattening, but at the same time they were not able to compensate the adverse effects of the development of input-output prices.
H4: The difference, which can be demonstrated between the performance of the genetic basis and their implementation in the practice, can be realized in economic terms, as well.
2. Data Resources and Method
During the performance of the research work, I used secondary as well as primary data resources. The secondary data required for the examination were provided by the database of the Poultry Product Board (BTT, 2015), the Price Information System of the Agricultural Research Institute (AKI PÁIR, 2017), the Test Operation data of AKI and the database of the Central Bureau of Statistics (KSH, 2017).
The BTT data included the following: national annual average of the broiler fattening production parameters (1980-2014); the national annual average of the most important input-output prices (1986-2014); national annual average of unit cost data (1986-2004).
Data obtained from AKI were the following: national average price of wheat, maize, broiler feeds in monthly break-down (January 2004 –
December 2016); production cost of broiler fattening based on test operation data (2004-2014).
Data deriving from the database of KSH: national annual average price of electric power, diesel oil and piped gas (1996-2014); consumer price index (1986-2014).
The primary data collection meant the plant line data of a Hungarian company dealing with broiler fattening. The data collection was performed referring to 31 rotations covering the period between 2012 and 2014. From the chicken house logs and the cycle accounting slips, I collected the broiler fattening production parameters and the unit cost data per rotation.
From the physical data of BTT and of the given company I created further derived indicators: specific feedstuffs utilization (Feed Conversion Ratio, FCR) corrected to 2.3 kg/pc average weight (kg/kg); average daily weight gain (g/day); Broiler index (European Production Efficiency Factor; EPEF). I also determined further data from the collected economic data ( input-output prices, and unit cost data): price relation of broiler and feedstuffs (quantity of feedstuffs being enough for buying 100 kg broiler); national average production price of broiler fattening at real price based on consumer price index (at price level of 2014) (1986-2014); broiler fattening income and its cost proportional profitability (1986-2014) (between 1986 and 2004 the selling price and the production cost is taken from BTT database, between 2005 and 2014 the selling price is taken from the BTT database, while the production cost deriving from the AKI Test Operation database were used);
the broiler fattening income and cost proportional profitability referring to the rotation level data of the examined company between 2012 and 2014; input prices, additional unit costs and rotation level costs from the cost data of the examined company;
During processing the collected data and indicators derived from them I used descriptive statistical methodology (average, minimum, maximum).
After data processing, I examined the trend of the time series, to which I assigned a linear trend function (linear regression). Then, the analysis of the interrelation between the derived data and the ones collected in the database was performed, for which I used correlation and regression analysis. When examining the relation between the quantitative indicators as a first step, I prepared so-called scatter charts. In order to quantify the strength and direction of the relation between the variables I used the Pearson correlation coefficient (r). In order to judge the strength of the relations I used the following target numbers based on the Pearson correlation coefficient: the correlation value between 0.0 and 0.4 means a loose, between 0.4 and 0.7 a medium, between 0.7 and 0.9 a tight, and over 0.9 a very tight relation (Sváb, 1967 cit. Mészáros, 1981). I modelled the relation among the examined variables by a linear regression function and determined the parameters of the function. The significance examination of the relation of two variables was performed by analysis of variance (ANOVA; F-test).
After processing the primary data collected at the given company, I made model calculations in order to be able to examine the effect of the different production parameters on the economic indicators. Referring to the different production parameters, the starting point is based on the parameters (referring to mixed sex, males and females, as well) included in the performance expectations of the breeding companies of the hybrids being accessible in the market and most frequently used (Ross 308 and Cobb 500) (Aviagen, 2012;
Cobb, 2012), on the average data and extremums of the examined company during the period of 2012-2014, and national average data of the same period (BTT, 2015). According to that, I developed a model characterized by 10 different production parameters.
The model calculation is based on deterministic principle. The economic parameters of the activity (the output variables of the model) are deducted from the production parameters, the most important input-output prices, and
the unit cost data through the mathematical contexts of the economic system (Table 1).
Table 1 Mathematical Contexts of the Model Calculation
Description Context
Income (margin amount) (HUF/rotation) Revenue (KHUF/rotation) – Direct production cost (HUF/rotation)
Revenue (KHUF/rotation) Broiler selling price (HUF/kg) × Sold live weight (kg/rotation)
Sold live weight (kg/rotation) Sold chickens (pcs/rotation) × Average weight (kg/pc)
Sold chickens (pcs/rotation) Allocated day old chicks (pcs/rotation)–
Mortality (pcs/rotation)
Allocated day old chicks (pcs/rotation) Allocation density (pc/m2) × barn area (m2) Mortality (pcs/rotation) Allocated chickens (pcs/rotation) × Mortality (%)
Direct production cost (HUF/rotation)
Cost of day old chicks (HUF/rotation) + Feedstuff cost (HUF/rotation) + Medicines cost
(HUF/rotation) + Power cost (HUF/rotation) + Other costs (HUF/rotation)
Cost of day old chicks (HUF/rotation) Allocated day old chicks (pcs/rotation) × Price of day old chicks (HUF/pc)
Feedstuff cost (HUF/rotation) Utilized feedstuff (kg/rotation) × Feedstuff price (HUF/kg)
Utilized feedstuff (kg/rotation) FCR (kg/kg) × Sold live weight (kg/rotation) Medicines cost (HUF/rotation) Medicines cost (HUF/pc) × Allocated day old
chicks (pcs/rotation) Source: own drafting
During the examination I handled the main production parameters (FCR, average weight, mortality) as variables, while I considered the average of the input-output prices and unit costs of the examined company during the period of 2012-2014 and the average of the selling prices (BTT annual average data) as constant, unchanged. During the calculation, I did not take into account any subsidy. From the aspect of the utilized power I did not make difference among the seasons, as I carried out the calculations with average values. The plant size of the model is similar to the plant size of one rotation (that is a production unit) of the examined company being 1,000 m2. During the model calculation I determined the performance parameters of the breeding companies referring to the average fattening days of the examined company.
Additionally, as the breeding companies do not publish mortality data, I supposed the average data of the examined company during their examination, as well.
After demonstrating the economic effects of the different production indicators (10 models) under a supposed economic environment (at the company’s annual average prices of 2012-2014 and at the BTT’s annual average broiler price of 2012-2014), I made a sensitivity analysis at different feedstuff and selling prices. Furthermore, I examined the economic effect of the change of individual production indicators (ceteris paribus, supposing all other factors as being constant) in relation to the average cost and income conditions of the company.
I carried out the arrangement, processing and evaluation, and the model calculations with the help of the Microsoft Excel (2010) and IBM SPSS Statistics 20 soft-wares.
3. Results
3.1. Price Trends of Cereals and Broiler Feedstuff and their Demonstrable Relations
According to the monthly data of AKI PÁIR (Figure 1), the wheat price fluctuated between 17.7 and 75.7 HUF/kg during the period of 2004-2016, and was 42.6 HUF/kg in average. As far as the trend is concerned, an annual average 2.1 HUF/kg price increase can be seen based on the linear function describing the data (y=0.177x+28.669; R2=0.316). In case of maize, during the same period the lowest value was 19.8, the highest 64.0 HUF/kg, with an average of 39.5 HUF/kg. As a trend, the annual average price increase is 1.7 HUF/kg (y=0.144x+28.190; R2=0.289). At the same time, in addition to the trend a significant fluctuation can be seen in case of both cereals and that is also indicated by the low R2 value.
Among the feedstuffs mixtures the price of the starter food varied between 52.6 and 120.9 HUF/kg, the average value was 84.0 HUF/kg. In case of the breeding food it was between 49.6 and 113.3 HUF/kg (78.3 HUF/kg in average), while at the final food was between 45.2 and 108.2 HUF/kg (74.2 HUF/kg in average). In case of the linear models describing the price developments much higher R2 values can be seen compared to the cereal types, and that can be explained by the lower amplitudes of the prices. The function describing the feedstuffs mixtures price in case of the starter food is:
y=0.349x+56.607 (R2=0.742); at breeding food: y=0.319x+53.258 (R2=0.711); while at final food: y=0.334x+47.970 (R2=0.723). Based on the above, the price of the feedstuffs mixtures shows an annual average increase of HUF 3.8 – 4.2 per kilogram during the period of 2004 – 2016.
Figure 1 Development of Wheat and Broiler Feedstuffs Price (2004-2016)
Source: AKI PÁIR, 2017
It can be proved statistically that the price of wheat and maize follows each other (R=0.914; p<0.05), and their variation can be followed up in the changes of the feedstuffs mixtures, as well, as a positive, tight (R>0.8),
0 20 40 60 80 100 120 140
2004 2005 2006 2007 2008 2009 2010 2011 2012 2013 2014 2015 2016
Ft/kg
Indító Nevelő Befejező Búza Kukorica
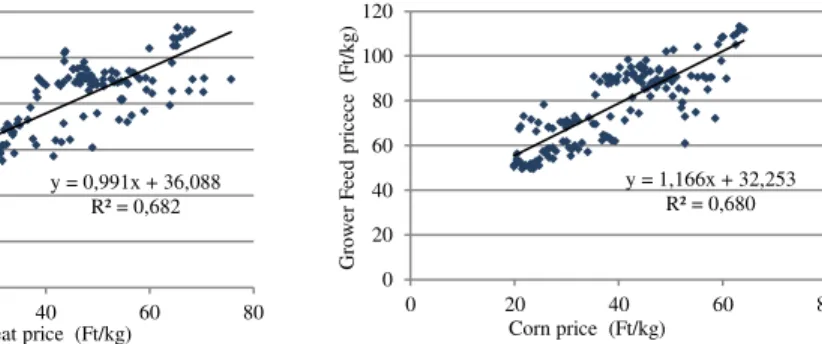
significant (p<0.05) statistic relation can be demonstrated between the price of the cereals and the broiler feedstuffs (Figures 2 – 3). During the examined period, a unit increase of the maize price caused an increase of 1.17-1.22 HUF/kg increase to the feedstuffs mixture price (R2=0.65-0.68; p<0.05).
While a unit increase of the wheat price induced a price increase of 0.99-1.04 HUF/kg (R2=0.65-0.68; p<0.05).
Figure 2 Correlation between the wheat and
breeding food price (2004-2016; n=156) Figure 3. Correlation between the maize and breeding food price (2004-2016; n=156) Source: own calculation based on data of AKI PÁIR (2017)
3.2. Development of the Competitiveness Indicators and the Correlation between them in the Hungarian Broiler Sector during 1980-2014
3.2.1. Development of the input-output prices, and the demonstrable correlations between them
In addition to the development of the feedstuffs prices it cannot be neglected how the broiler buying-in prices developed and what was the price relation between them. Based on the monthly data of AKI PÁIR referring to 2004-2016, the buying-in price of the broilers varied between 162.8 and 303.3 HUF/kg, the average price was 228.9 HUF/kg. As a trend, an annual average price increase of 9.4 HUF/kg can be seen (y=0.784x+167.391;
R2=0.747). During the examined period, the quantity of the breeding food purchasable for the price of 100 kg broiler and expressing the input-output price rates, at a significant fluctuation (min=250.7; max=338.8;
y = 0,991x + 36,088 R² = 0,682
0 20 40 60 80 100 120
0 20 40 60 80
Grower Feed pricece (Ft/kg)
Wheat price (Ft/kg)
y = 1,166x + 32,253 R² = 0,680
0 20 40 60 80 100 120
0 20 40 60 80
Grower Feed pricece (Ft/kg)
Corn price (Ft/kg)
average=295.5 kg/100kg) as a whole can be characterized by a decreasing tendency (y=-0.223x+312.976; R2=0.322). The decrease rate is 2.7 kg/100 kg annually, which shows a clear exchange rate reduction adversely affecting the cost-income relations of the sector.
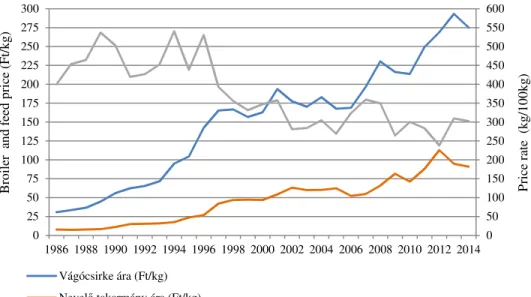
Examining the development of the feedstuffs based on the longer timeline (1986-2014) of BTT (2015) (Figure 4), in the price trend of the feedstuff mixtures an annual average increase of 3.3-3.6 HUF/kg can be seen (starter food: y=3.616x-5.018; R2=0.933; breeding food: y=3.421x-4.705; R2=0.927;
final food: y=3.292x-6.251; R2=0.927). At the same time the broiler price trend (y=8.864x+18.731; R2=0.941) shows an annual increase of 8.9 HUF/kg. Also at the same time, while during 1986-2014 the broiler price increased from 30.6 HUF/kg to 275.16 HUF/kg, almost by nine times, the price of the breeding food increased from 7.7 HUF/kg to 90.9 HUF/kg, that is nearly by twelve times. That can be also seen in the significant deterioration of the price ratio (y=-8.344x+498.298; R2=0.647), especially if looking at the comparison between the periods prior and after 1997.
Figure 4 Development of broiler and feedstuffs price (1986-2014)
Source: own calculation following Szőllősi (2014)and based on BTT (2015) data 0 50 100 150 200 250 300 350 400 450 500 550 600
0 25 50 75 100 125 150 175 200 225 250 275 300
1986 1988 1990 1992 1994 1996 1998 2000 2002 2004 2006 2008 2010 2012 2014
Price rate (kg/100kg)
Broiler and feed price(Ft/kg)
Vágócsirke ára (Ft/kg) Nevelő takarmány ára (Ft/kg)
Vágócsirke és takarmány áraránya (100 kg csirke árán vásárolható takarmány mennyisége, kg)
After the feedstuffs, the second most significant cost factor is the day old chick. Till the beginning of 1990s a relatively stable, about 10 HUF/pc day old chick price was the characteristic. By 2014 this value increased by ten times and approached 100 HUF/pc, as a tendency (y=3.483x-1.266;
R2=0.963) an annual average increase of 3.5 HUF/pc can be seen. From the aspect of the production the energy price is even not a negligible factor.
During the period of 1996-2014 the price of the fuels showed a significant increase. Comparing with 1996, by 2014 the electric power price increased by 4.4 times, the diesel oil prices increased by 3.8 times, while the natural gas price increased by 6.6 times (KSH, 2017).
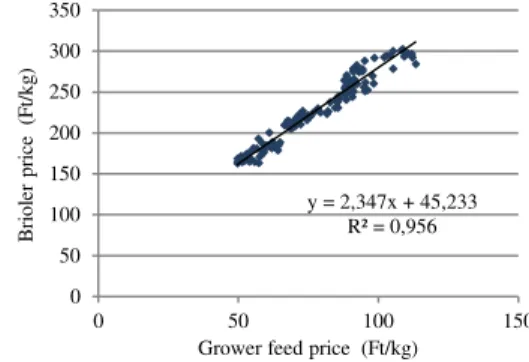
Between the prices of the cereals and of the broilers a statistically tight (R=0.77-0.78; p<0.05) relation, while between the prices of the feedstuffs mixtures and of the broilers a very strong relation (R=0.97-0.98; p<0.05) can be demonstrated. Based on the linear regression models describing the context between the cereal and broiler prices, a 1 HUF/kg increase in the price of wheat and maize, resulted an increase of 2.2 HUF/kg and 2.6 HUF/kg increase to the broiler price during the period of 2004-2016. In case of the feedstuffs mixtures that represented a price change of 2.2-2.3 HUF/kg (Figures 5-6).
Figure 5 Relation between the maize and
broiler prices (2004-2016; n=156) Figure 6 Relation between the breeding food and broiler prices (2004-2016; n=156) Source: own calculation based on AKI PÁIR (2017) data
y = 2,603x + 126,189 R² = 0,588
0 50 100 150 200 250 300 350
0 20 40 60 80
Brioler price(Ft/kg)
Corn price (Ft/kg)
y = 2,347x + 45,233 R² = 0,956
0 50 100 150 200 250 300 350
0 50 100 150
Brioler price(Ft/kg)
Grower feed price (Ft/kg)
Referring to the long BTT timeline covering period of 1986-2014 it can be proved statistically that there is a tight correlation between the prices of the feedstuffs mixtures and of the broiler (R>0,96; p<0,05). During this period a unit increase of the feedstuffs mixture price led to a broiler price increase of 2.4-2.6 HUF/kg.
It was also established that the variation of the day old chick average price is significantly affected by the current feedstuffs and power prices as there is a very tight correlation (R>0.9; p<0.05) between the factors. During the period of 1986-2014 a unit increase of the breeding food caused an increase of 0.96 HUF of the day old chick price (y=0.96x+5.99; R2=0.934; p<0.05).
Parallel with the 1 HUF/kWh electric power price increase between 1996 and 2014, the day old chick price increased by 1.3 HUF (y=1.28x+28.15;
R2=0.921; p<0.05), while in case of natural gas that (1 HUF/m3) meant 0.4 HUF (y=0.37x+44.82; R2=0.834; p<0.05).
Similarly to the feedstuffs mixtures, the increase of day old chick is also reflected in the increase of the broiler price. The correlation between the two factors is statistically very tight (R=0.97; p<0.05), and during the examined period a unit of day old chick price increase was accompanied by 2.5 HUF/kg broiler price increase (y=2.497x+24.409; R2=0.94; p<0.05).
Statistically a tight correlation (R=0.871; p<0.05) can be demonstrated between the price of electric power and breeding food. Parallel with a unit increase of the electric power price and increase of 1.5 HUF/kg can be seen at the price of feedstuffs mixture between 1996 and 2014. The feedstuffs mixture price is also in correlation with the natural gas price (R=0.903;
p<0.05). In case of a unit increase of the price of the latter one an increase of 0.5 HUF/kg can be seen at the feedstuffs price.
3.2.2. The Trend of the Broiler Fattening Parameters and the Demonstrable Correlations between them
From the aspect of the income producing ability, in addition to the economic factors (input-output prices) another important factor is the trend of the natural efficiency indicators having also significant affect to the development of the production value, production cost, and to the development of the income as their resultant.
In Hungary, the live weight of the broilers increased significantly, from 1.5 kg to 2.3-2.4 kg during the period of 1980-2014 (Figure 7). As a trend, the average weight at slaughter increased by 25 g in annual average, and that is attributable mainly to genetic progress, but at the same time the more advanced housing and feeding technology contributed to it, as well.
It should be noted, however, that the country wide data are significantly affected by the number of fattening days, as well, which shows a continuous decrease during this same period. While in 1980 the average fattening time in the country was 51-52 days, by 2014 it reduced to 39 days (Figure 8). The tendency is that the average fattening period decreases by 0.5 days annually.
Though that is not an independent value measuring feature, its role is significant due to the increase of the production place utilization, and through that the reduction of the specific fixed costs.
Figure 7 Development of average weight (1980-2014; n=35)
Figure 8 Development of fattening period (1980-2014; n=35)
y = 0,025x + 1,448 R² = 0,983
1,4 1,5 1,6 1,7 1,8 1,9 2,0 2,1 2,2 2,3 2,4
1980 1985 1990 1995 2000 2005 2010
Avarage body weight (kg/db)
y = -0,455x + 53,638 R² = 0,903
35 37 39 41 43 45 47 49 51 53 55
1980 1985 1990 1995 2000 2005 2010
Growing period (nap)
Figure 9 Trend of average daily weight gain (1980-2014; n=35)
Figure 10 Mortality trend (1980-2014; n=35)
Figure 11 FCR trend (1980-2014; n=35)
Figure 12 EPEF trend (1980-2014; n=35) Source: own calculation based on BTT (2015) data
So, the average weight increased and at the same time that can be achieved within a shorter period of time. As a result of it, the average daily weight gain expressing the two indicators together went through a significant development (Figure 9). While in 1980 it did not achieve the value of 30 g/day, by 2014 the growing strength of the chickens was doubled. In this regard, the genetic development meant annually a surplus average weight gain of 1 g/day in the domestic practice.
On one hand, the mortality reduces the yields, and through that the revenue, on the other hand increases the production costs of the surviving, sold chickens as until the date of death different costs (day old chick, feedstuff, etc.) are incurred in connection with the dead animals. Referring to the rate of mortality a significant fluctuation can be seen in certain periods, but the tendency shows improvement in this field (Figure 10). At the turn of
y = 0,993x + 25,076 R² = 0,971
20 25 30 35 40 45 50 55 60 65
1980 1985 1990 1995 2000 2005 2010 Átlagos napi súlygyarapodás (g/nap)
y = -0,159x + 9,527 R² = 0,550
0 2 4 6 8 10 12
1980 1985 1990 1995 2000 2005 2010
Elhullás (%)
y = -0,024x + 2,619 R² = 0,890
y = -0,034x + 2,960 R² = 0,942
1,6 1,8 2,0 2,2 2,4 2,6 2,8 3,0
1980 1985 1990 1995 2000 2005 2010
kg/kg
FCR
2,3 kg átlagsúlyra korrigált FCR (kg/kg)
y = 6,901x + 68,463 R² = 0,941
0 50 100 150 200 250 300 350
1980 1985 1990 1995 2000 2005 2010
EPEF
the millennium and after that the mortality rate significantly decreased, and during the last 10 years the national average was in the range of 4 to 4.5 %.
It is outstandingly significant that during the production how much feedstuff is required for the production of one kg body weight, as 60-65 % of the total production cost is the feedstuffs cost. In our country, the specific feedstuff utilization continuously improved during the examined period, from the value of 2.45 kg/kg it decreased by almost 27 % to the value of 1.80 kg/kg (Figure 11). The trend shows an improvement of 24 g annually.
However, a higher FCR belongs to the achievement of the higher average weight, for this reason it is purposeful to recalculate it to same average weight. While in 1980 the FCR value corrected to the average weight 2.3 kg/pc was 2.77 kg/kg, in 2014 it was 1.78 kg/kg meaning an annual average improvement of 34 grams.
The production indicators of the broiler fattening can be expressed in a complex indicator, in the broiler index (European Production Efficiency Factor, EPEF). In connection with the domestic production, the EPEF value of the domestic production also shows a significant increase during the examined period (Figure 12). In 1980 the EPEF value was 110, in 2014 nearly three times higher, 320, and the trend shows a development by nearly 7 units annually.
That means that during the last decades the genetic development modified our performance expectations, the practical realization of which was affected by the improvement of the technical factors, by focusing on the professional experience and professional knowledge, but probably the most important element in addition to the before mentioned ones is the competition.
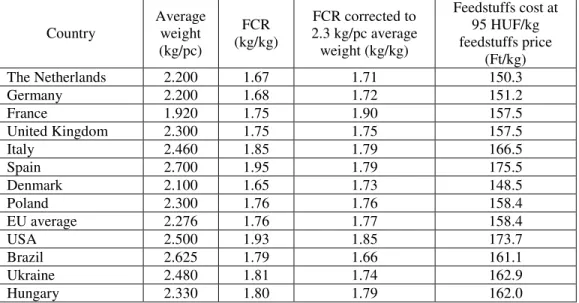
At the same time, comparing the domestic production indicators with the international data (Table 2), it can be established that in respect of FCR we are still behind the relevant competitors by at least 0.05-0.1 kg/kg. Just for this reason, calculating at the feedstuffs prices of 2013, our production cost
was by 4-5 HUF higher than that of Poland, France and the United Kingdom, while our feedstuff costs exceeded by 11-12 HUF those of the Netherlands and Germany, and that significantly increased the broiler cost in dependence to other cost items.
Table 2 Production indicators of broiler fattening in international comparison (2013)
Country Average weight (kg/pc)
FCR (kg/kg)
FCR corrected to 2.3 kg/pc average weight (kg/kg)
Feedstuffs cost at 95 HUF/kg feedstuffs price
(Ft/kg)
The Netherlands 2.200 1.67 1.71 150.3
Germany 2.200 1.68 1.72 151.2
France 1.920 1.75 1.90 157.5
United Kingdom 2.300 1.75 1.75 157.5
Italy 2.460 1.85 1.79 166.5
Spain 2.700 1.95 1.79 175.5
Denmark 2.100 1.65 1.73 148.5
Poland 2.300 1.76 1.76 158.4
EU average 2.276 1.76 1.77 158.4
USA 2.500 1.93 1.85 173.7
Brazil 2.625 1.79 1.66 161.1
Ukraine 2.480 1.81 1.74 162.9
Hungary 2.330 1.80 1.79 162.0
Source: own calculation based on Horne – Bont (2014) and BTT (2015) data
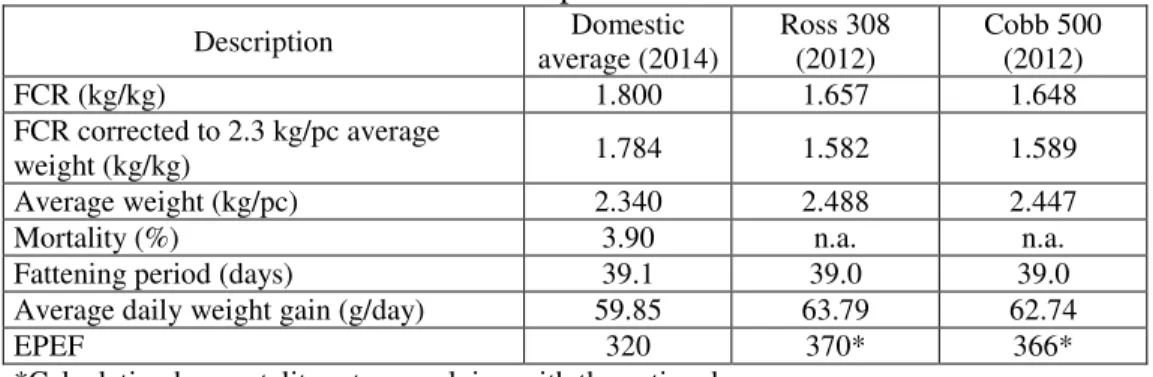
When we compare the domestic data with the performance parameters of the breeding companies (Table 3), it can be established that in the practice of the domestic production the average weight is in average by at least 0.1 kg lower referring to 39 days corresponding to a weight gain disparity of 3-4 grams per day. And in addition to that, we even utilize by 0.15 kg/kg more feedstuffs.
Table 3 Comparison of production indicators with data of breeding companies
Description Domestic
average (2014)
Ross 308 (2012)
Cobb 500 (2012)
FCR (kg/kg) 1.800 1.657 1.648
FCR corrected to 2.3 kg/pc average
weight (kg/kg) 1.784 1.582 1.589
Average weight (kg/pc) 2.340 2.488 2.447
Mortality (%) 3.90 n.a. n.a.
Fattening period (days) 39.1 39.0 39.0
Average daily weight gain (g/day) 59.85 63.79 62.74
EPEF 320 370* 366*
*Calculating by mortality rate complying with the national average.
Source: own calculation based on BTT (2015), Aviagen (2012) and Cobb (2012) data
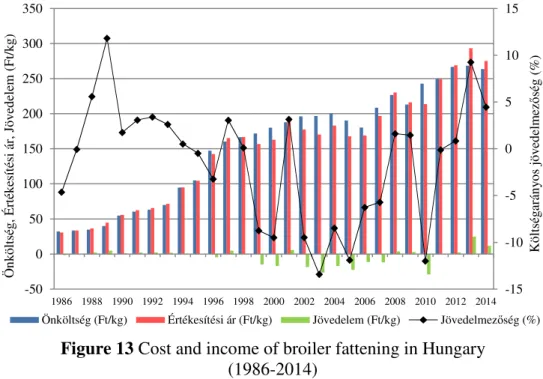
3.2.3. Development of cost and revenue conditions of the broiler fattening National cost data referring to the period of 1986-2004 were available for me in the BTT (2015) database. I added to this data line the production cost data derived from the AKI Test Operation database referring to the period of 2004-2014. In 1986 the production cost was 32 HUF/kg at current prices, and it increased to 263 HUF/kg in 2014, representing an 8.2 times increase (Figure 13). According to the linear function describing the trend referring to the full period (y=8.991x+20.471; R2=0.948), the production cost of the broiler increase by an annual average of 8.99 HUF during the examined period. During the period of 1986-2014 the development of the selling price shows an annual average 8.86 HUF/kg increase (y=8.864x+18.731;
R2=0.941), which is by 0.13 HUF/kg lower than the change seen in the costs.
The income realizable as the result of the above is highly variable and its tendency can be approached by a quadratic function (y=0.094x2- 2.936x+12.776; R2=0.257). While during the period of 1986-2004 an averagely decreasing trend (y=-1.140x+7.403; R2=0.444) was characteristic, during the period of 2005-2014 in average we can speak about an improving income producing capability (y=1.661x-8.637; R2=0.331).
Figure 13 Cost and income of broiler fattening in Hungary (1986-2014)
Source: own calculation based on data of BTT (2015) and AKI Test operational data (Béládi – Kertész, 2009; 2012; 2013; 2014)
Based on the detailed operating cost data of BTT referring to 1986-2004 it can be also seen that while the rate of the feedstuff cost increases (between 1986 and 2004 from 56% to 61%), the proportion of the other operating cost items decrease (e.g. of day old chick from 21% to 17%, of power from 11%
to 6-6.5%). Basically, in the background we can find the increasing live weight and decreasing fattening time, which reduce the rate of the specific fixed costs.
3.2.4. Demonstrable correlations between the input-output prices and the economic indicators
The increase of the input prices can be well followed up in the production of the broiler, what allows us to conclude that the variables closely follow each other’s tendencies. It can be proved statistically that the development of the broiler production cost is in a tight correlation (R>0.9; p<0.05) with the price tendencies of the day old chick, feedstuff mixtures and power. At the
-15 -10 -5 0 5 10 15
-50 0 50 100 150 200 250 300 350
1986 1988 1990 1992 1994 1996 1998 2000 2002 2004 2006 2008 2010 2012 2014
Költségarányos jövedelmezőség (%)
Önköltség, Értékesítési ár, Jövedelem (Ft/kg)
Önköltség (Ft/kg) Értékesítési ár (Ft/kg) Jövedelem (Ft/kg) Jövedelmezőség (%)
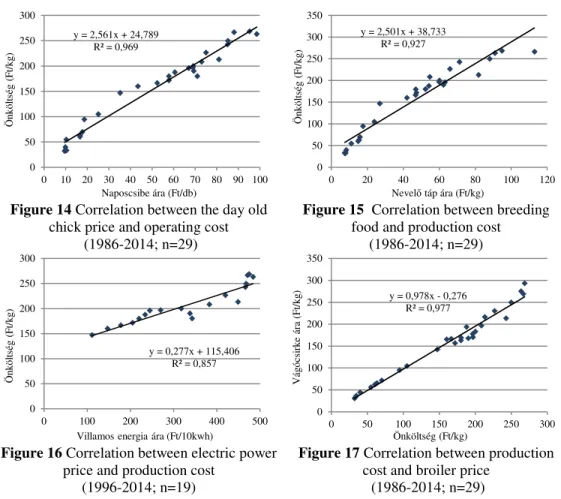
increase of day old chick price by a unit the production cost increase by 2.6 HUF in the period of 1986-2014 (R2=0.97; p<0.05) (Figure 14). Parallel with a unit increase of the feedstuff mixtures the broiler fattening production cost increased by 2.4-2.6 HUF (R2>0.9; p<0.05) (Figure 15). A unit increase of electric power (1 HUF/kWh) was followed by a price increase of 2.8 HUF/kg (Figure 16), while a unit increase of natural gas price (1 HUF/m3) was followed by a 0.8 HUF/kg production cost increase in the period between 1996 and 2014 (R2=0.86; 0.91; p<0.05).
Figure 14 Correlation between the day old chick price and operating cost
(1986-2014; n=29)
Figure 15 Correlation between breeding food and production cost
(1986-2014; n=29)
Figure 16 Correlation between electric power price and production cost
(1996-2014; n=19)
Figure 17 Correlation between production cost and broiler price
(1986-2014; n=29)
Source: own calculation based on data of BTT (2015, KSH (2017) and AKI Test operation (Béládi – Kertész, 2009; 2012; 2013; 2014)
In the examined period also a very tight statistical relation (R=0.988;
p<0.05) can be demonstrated between the production cost and the selling price. The linear regression model describing the correlation (y=0.978x-
y = 2,561x + 24,789 R² = 0,969
0 50 100 150 200 250 300
0 10 20 30 40 50 60 70 80 90 100
Önköltség (Ft/kg)
Naposcsibe ára (Ft/db)
y = 2,501x + 38,733 R² = 0,927
0 50 100 150 200 250 300 350
0 20 40 60 80 100 120
Önköltség (Ft/kg)
Nevelő táp ára (Ft/kg)
y = 0,277x + 115,406 R² = 0,857
0 50 100 150 200 250 300
0 100 200 300 400 500
Önköltség (Ft/kg)
Villamos energia ára (Ft/10kwh)
y = 0,978x - 0,276 R² = 0,977
0 50 100 150 200 250 300 350
0 50 100 150 200 250 300
Vágócsirke ára (Ft/kg)
Önköltség (Ft/kg)
0.276; R2=0.977; p<0.05) also proves that the production cost increase was not fully reflected in the increase of the selling prices. Parallel with a 1 HUF/kg cost increase the price of the broiler increased by 0.98 HUF only, that means the market recognized the increase of the production costs only at a rate of 98% (Figure 17). This correlation had a clearly adverse effect to the income conditions of the sector.
Examining the income data of the full period (1986-2014), no statistic correlation can be demonstrated either with the breeding food price, or with the production cost, or with the selling price trends. At the same time in the period of 1986-2004 the tendency of decreasing income shows a moderate correlation between the broiler price (R=0.544; p<0.05), the production cost (R=0.644; p<0.05) and the breeding food price (R=0.681; p<0.05).
3.2.5. Demonstrable correlations between the production parameters and the economic indicators
Examining the correlation between the trends of the broiler fattening production cost and of the production indicators it can be established that along with the improving trend of the production parameters the costs increased significantly. From that it can be concluded that the increase rate of the inputs prices was higher than the specific cost reduction realizable as a result of the improvement of the production indicators. For example, while the value of EPEF developed by 10 units, at the same time the production cost increased by 10.86 HUF.
In order to be able to evaluate realistically the economic effects of the production parameters development, I expressed the nominal value production cost data at real value of 2014 using the consumer price indices referring to the given period (Figure 18). While the production cost expressed at 2014 price level was 734 HUF/kg in 1986, by 2014 it decreased to 263 HUF/kg. According to the linear function describing the trend (y=-
16.105x+641.242; R2=0.847) the production cost – expressed at 2014 price level – decreased by 16.1 HUF annually. This reduction can be attributable to the development of the broiler fattening production indicators. It can be established that the mortality and EPEF are in tight correlation (R=0.75; 0.88;
p<0.05), while the additional efficiency indicators are in very tight correlation (R>0.9; p<0.05) with the production cost expressed at real value.
For example, a10 units development of the EPEF index caused an almost 19 HUF/kg decrease in the production cost (y=-1.891x+794.957; R2=0.781;
p<0.05).
Figure 18 Cost structure of broiler fattening (1986-2004)
Source: own calculation based on BTT (2015), KSH (2017) and AKI Test operational data (Béládi – Kertész, 2009; 2012; 2013; 2014)
3.3 Economic effect of the differences demonstrable in the performance of the genetic bases and their practical realization
3.3.1 Cost and income of the broiler fattening at the operating parameters of the breeding companies, and based on the plant practice
The supposed economic environment of the model calculation meant the 2012-2014 annual average input prices, specific costs of the company and the BTT 2012-2014 annual average broiler price (Table 4). In the case of the
60 70 80 90 100 110 120 130 140
0 100 200 300 400 500 600 700 800
1986 1988 1990 1992 1994 1996 1998 2000 2002 2004 2006 2008 2010 2012 2014
Fogyasztóiár-index (előző év=100%
Önköltség (Ft/kg)
Önköltség (Ft/kg) Önköltség 2014. évi árszinten (Ft/kg) Fogyasztóiár-index (előző év=100%)
company, the average feedstuff price was by nearly 12 HUF (12%) lower than the national average (breeding food: 99.6 HUF/kg), and the day old chick price was also by 4.8 HUF (5.1%) more favorable than the national average (93.9 HUF/pc). The table includes the specific values of additional cost items (medicines, power and others), as well, and even the plant size and the allocation density of the calculation.
Table 4 Data used in the model calculation (2012-2014; n=31)
Description Unit of measurement Average Min. Max.
Average broiler price (BTT data) HUF/kg 279.02 268.93 293.35 Average day old chick price HUF/pc 89.11 76.21 102.49
Average feedstuff price HUF/kg 87.55 79.40 94.79
Medicine cost HUF/pc 9.41 7.97 11.13
Power cost KHUF/rotation 343 295 410
Other costs KHUF/rotation 1 408 1 194 1 674
Plant size m2 1 000 - -
Allocation density pc/m2 15.14 14.20 15.80
Source: own calculation based on data of examined company and BTT (2015)
According to the objective of the examination, I handled the different production indicators as variables in the model calculation. According to that I set up a model characterized by 10 different performance parameter described in the methodology section (Table 5).
According to the result of the model calculation (Figure 19) the highest rotation level production cost can be calculated in case of Ross 308 male. In comparison to that the value of Cobb 500 male is lower by 1%, of Ross 308 mixed sex by 4.2%, while of Cobb 500 mixed sex by 5.5%. The company’s production cost under average conditions is by 2.8 % lower than that of the Ross 308 mixed sex, but is higher by 5.3% than the national average. The lowest rotation level production cost is characteristic to the company’s weakest rotation according to EPEF and is by 7.2 % lower than the company’s average.
The amount of revenue is determined by the average weight and the mortality. The highest revenue can be achieved in case of Ross 308 male, which exceeds by 0.9% the amount relating to the Cobb 500 male. The difference between the two hybrids in mixed sex is 1.3% also in favor of Ross 308. By comparison, the company achieved a revenue being by 6%
lower under average conditions. The lowest revenue can be calculated with the parameters of the company’s worst rotation, which is by 2% lower even in comparison with the modelled revenue using the national average data.
Table 5 Production parameters used in the model calculation
Description
Examined company’s * Ross 308 Cobb 500
National average average
Worst rotation data acc.to
EPEF
Best rotation data acc.to
EPEF
Mixed
sex Male Female Mixed
sex Male Female
FCR (kg/kg) 1.748 1.770 1.650 1.718 1.704 1.734 1.705 1.691 1.719 1.800
FCR corrected to 2.3 kg
average weight, kg/kg 1.627 1.722 1.562 1.531 1.432 1.631 1.533 1.430 1.635 1.788 Average weight (kg/pc) 2.603 2.425 2.524 2.768 2.979 2.557 2.732 2.953 2.511 2.330
Mortality (%) 3.84 9.52 2.67 n.a.** n.a.** n.a.** n.a.** n.a.** n.a.** 3.93
Fattening time (days) 42.37 40.74 38.78 42.00 42.00 42.00 42.00 42.00 42.00 39.07 Average daily weight
gain (g/day) 61.44 59.40 64.98 65.90 69.93 59.88 65.05 69.31 58.79 59.64
EPEF 338 304 383 369** 400** 338** 367** 400** 334** 318
*2012-2014; n=31
**Calculated by the average data (3.84%) of the examined company.
Source: own calculation based on the data of the examined company, of the breeding companies (Aviagen, 2012; Cobb, 2012) and of BTT (2015)
Figure 19 Broiler fattening cost and income according to the examined parameters (KHUF/rotation)
Source: own calculation based on the data of the examined company, of the breeding companies (Aviagen, 2012; Cobb, 2012) and of BTT (2015)
As a result of all that, the highest income can be realized in case of the male performance data of the two hybrids. From the two hybrids a slightly more (by 0.1%) can be realized in case of Ross 308. In case of mixed sex the demonstrable difference between the two hybrids increases, in comparison to Ross 308 the Cobb 500 falls behind by 1.1%. In comparison with the income calculable at the Ross 308 mixed sex performance, in average the company realizes an income being by 21 % lower. It falls behind by 9 % even in the best rotation, but in the worst case – similarly to the national result - the income amount is by 55% lower.
In case of examining the cost and income data referring to one kilogram live weight (Figure 20), it can be established that the lowest production cost can be calculated in the case a Cobb 500 male. In comparison to that the production cost of the Ross 308 male is by 0.2% (0.4 HUF/kg) higher. In case of mixed sex the difference between the two hybrids is lower, the Cobb
9 040
8 388 8 615
9 303 9 710
8 892 9 180 9 607
8 744 8 582 10 573
9 266
10 377 11 243
12 100
10 386 11 096
11 994
10 199 9 455
1 532 878
1 763 1 939 2 390
1 494 1 917 2 387 1 455
873 0
2 000 4 000 6 000 8 000 10 000 12 000 14 000
Vállalkozás átlag Vállalkozás
legrosszabbVállalkozás legjobb Ross 308
vegyes Ross 308 hímivar Ross 308
nőivar Cobb 500 vegyes Cobb 500
hímivar Cobb 500 nőivar Országos
átlag
Termelési költség (ezer Ft) Árbevétel (ezer Ft) Jövedelem (ezer Ft)
500 is more advantageous by 0.07 HUF/kg only. The production cost of the company in average is similar to the calculable one in case of the female performance of the breeding companies, is slightly more advantageous in comparison with that. The average is by 3.3% higher (7.69 HUF/kg) compared to the Ross 308 mixed sex production cost, but in relation to the calculable value under the national average data it is by 5.8% (14.68 HUF/kg) lower. The production cost calculated under the production parameters of the company’s best rotation is near to the production cost calculated referring to the breeding companies’ mixed sex, it is higher than that by 0.74-0.81 HUF/kg only. On the other hand, the production cost of the weakest rotation is near to the national average.
Figure 20 Specific cost and income of the broiler fattening according to the examined parameters (HUF/kg)
Source: own calculation based on the data of the examined company, of the breeding companies (Aviagen, 2012; Cobb, 2012) and of BTT (2015)
A reverse order can be set up among the hybrids on the basis of rotation level and specific indicators. In the plant practice, it is reasonable to take the decision based on the rotation level amount of the income, as the objective of
238,58
252,59
231,63 230,89
223,91
238,88
230,82
223,48
239,21
253,26
279 279 279 279 279 279 279 279 279 279
40,44
26,43
47,39 48,13 55,11
40,13 48,19 55,54
39,80
25,75
0 50 100 150 200 250 300
Vállalkozás
átlag Vállalkozás
legrosszabbVállalkozás legjobb Ross 308
vegyes Ross 308
hímivar Ross 308
nőivar Cobb 500
vegyes Cobb 500
hímivar Cobb 500 nőivar Országos
átlag
Önköltség (Ft/kg) Értékesítési ár (Ft/kg) Fajlagos jövedelem (Ft/kg)
the company having the given resource (e.g. shed area) is to maximize the income expressed in absolute value.
As a whole we can establish that there is a minimal difference only between the hybrids performance parameters, but their effect appears in the economic indicators, as well. Furthermore, the performances realizable in the domestic plant practice generally do not achieve these values, and in this way their adverse effect appears in the economic indicators, as well.
3.3.2. Effect of input-output prices and production parameters changes to the cost and income of the broiler fattening
Henceforward, I examined how the change of the broiler and feedstuff prices affect the amount of the realizable income and the demonstrable difference between them under the above described models. In Table 6 you can see the achievable company income under average conditions depending on the price of broiler and feedstuff. The increase of the feedstuff price by 1 HUF/kg reduces the income per kilogram by 1.75 HUF and the income per m2 by 66.2 HUF. On the other hand, the change of the output price by a unit (1 HUF/kg) modifies the income per kilogram by 1 HUF, at the same time it has different effects to the income per capacity unit (m2) due to the different live weight and mortality data. Under the average data of the company that means 37.9 HUF per m2, which value is equal to the available for sale live mass per 1 m2.
Table 6 Effect of feedstuff and broiler price to the calculable income under the average performance parameters of the company
Income (HUF/m2) Broiler price (HUF/kg)
250 260 270 280 290 300
Feedstuff price (HUF/kg)
80 933 1 312 1 691 2 070 2 448 2 827
85 602 981 1 360 1 738 2 117 2 496
90 271 649 1 028 1 407 1 786 2 165
95 -61 318 697 1 076 1 455 1 834
100 -392 -13 366 745 1 124 1 503
Source: own calculation
The Tables 7 and 8 show the calculable income of the breeding companies under mixed sex performances depending on the input-output prices. At lower feedstuff prices practically there is no difference between the income amounts per kilogram, at the same time referring to the income per m2 a difference between 18 and 44 HUF can be demonstrated in favor of Ross 308 depending on the selling prices. Parallel with the increase of the feedstuff price, the income per kilogram is more favorable in case of Cobb 500, at 100 HUF/kg feedstuff price the difference is 0.2 HUF/kg. At the same time, the difference in the income per m2 also decreases, moreover, at low selling price and high feedstuff prices (250:95; 250:100; 260:100 HUF/kg price ratios, that is after recalculation under 270kg/100kg price ratio) Cobb 500 achieves a higher income, or lower loss.
Table 7 Effect of the feedstuff and broiler price to the calculable income under the performance indicators of Ross 308 mixed sex
Income (HUF/m2) Broiler price (HUF/kg)
250 260 270 280 290 300
Feedstuff price (HUF/kg)
80 1 293 1 696 2 099 2 502 2 904 3 307
85 947 1 349 1 752 2 155 2 558 2 961
90 600 1 003 1 406 1 809 2 212 2 615
95 254 657 1 060 1 463 1 866 2 269
100 -92 311 714 1 117 1 520 1 923
Source: own calculation
Table 8 Effect of the feedstuff and broiler price to the calculable income under the performance indicators of Cobb 500 mixed sex
Income (HUF/m2) Broiler price (HUF/kg)
250 260 270 280 290 300
Feedstuff price (HUF/kg)
80 1 275 1 672 2 070 2 468 2 865 3 263
85 936 1 333 1 731 2 129 2 526 2 924
90 596 994 1 392 1 790 2 187 2 585
95 257 655 1 053 1 450 1 848 2 246
100 -82 316 714 1 111 1 509 1 907
Source: own calculation
In case of Ross 308 the unit feedstuff price increase is 1.72 HUF/kg or 69.2 HUF/m2, while in case of Cobb 500 the same increase causes a lower, 1.71 HUF/kg or 67.8 HUF/m2 reduction of income. It means that in case of hybrid characterized by a lower FCR value, the adverse effect of the feedstuff price increase is smaller. On the other hand, the increase of the output price in case of the hybrids with higher average weight (Ross 308) has a better effect to the development of income (at Ross 308 +40.3 HUF/m2, at Cobb 500 +39.8 HUF/m2). Naturally, these correlations are valid not only in case of the two hybrids, but in the comparison of the other models, as well.
The Table 9 shows the income being calculable at average national data.
Similarly to the weakest rotation of the company, we have here also several such price combinations, under which the production is loss making. In case of feedstuff price increase by a unit, 1.8 HUF/kg or 61 HUF/m2 reduction of income happens. Parallel with a unit increase of the selling price we can see a 33.9 per m2 increase of income. In comparison with the income under Ross 308 mixed sex performance data depending on the feedstuff a deficiency of 21.8-23.4 HUF can be experienced, which is 778-1263 HUF/m2. The lowest difference can be seen at high feedstuff price and low selling price.
Table 9 Effect of the feedstuff and broiler prices to the calculable income under the national average performance parameters
Income (HUF/m2) Broiler price (HUF/kg)
250 260 270 280 290 300
Feedstuff price (HUF/kg)
80 350 689 1 028 1 367 1 705 2 044
85 45 384 723 1 062 1 400 1 739
90 -260 79 418 757 1 095 1 434
95 -565 -226 113 452 790 1 129
100 -870 -531 -192 147 485 824
Source: own calculation