Authorship Attribution in Portuguese Using Character N-grams
Ilia Markov
1, Jorge Baptista
2, Obdulia Pichardo-Lagunas
31CIC, Instituto Polit´ecnico Nacional (IPN), Av. Juan de Dios B´atiz S/N, Del. Gus- tavo A. Madero, 07738, Mexico City, Mexico
imarkov@nlp.cic.ipn.mx
2Univ. Algarve/FCHS and INESC-ID Lisboa/L2F, Campus de Gambelas, P-8005- 139, Faro, Portugal
jbaptis@ualg.pt
3UPIITA, Instituto Polit´ecnico Nacional (IPN), Av. Instituto Polit´ecnico Nacional 2580, Del. Gustavo A. Madero, 07340, Mexico City, Mexico
opichardola@ipn.mx
Abstract: For the Authorship Attribution (AA) task, character n-grams are considered among the best predictive features. In the English language, it has also been shown that some types of character n-grams perform better than others. This paper tackles the AA task in Por- tuguese by examining the performance of different types of character n-grams, and various combinations of them. The paper also experiments with different feature representations and machine-learning algorithms. Moreover, the paper demonstrates that the performance of the character n-gram approach can be improved by fine-tuning the feature set and by ap- propriately selecting the length and type of character n-grams. This relatively simple and language-independent approach to the AA task outperforms both a bag-of-words baseline and other approaches, using the same corpus.
Keywords: authorship attribution; character n-grams; Portuguese; stylometry; computa- tional linguistics; machine learning
1 Introduction
The Authorship Attribution (AA) task aims at identifying the author of an anony- mous target text given a predefined set of candidate authors and corresponding sam- ples of their texts, deemed to be representative of their writing practices (style). In recent years, the AA task triggered an increasing interest due to its impact on mar- keting, security, and forensic linguistics, where it can help to limit the search space for the author of a text under investigation. From a machine-learning perspective,
approaches to the AA task can be viewed as a multi-class, single-label classification problem, in which the set of class labels is knowna priori. The challenge consists in modelling this classification task so that automatic methods can assign class labels (authors’ names) to objects (text samples).
Charactern-gram features have proved to be highly predictive not only for the AA task [13, 18, 35] but also for similar tasks, such as Author Profiling [20]. Charac- tern-grams are language-independent features but they are able to capture lexical and syntactic information, as well as punctuation and capitalization information re- lated with the authors’ personal style [6, 14]. Sapkotaet al.[29] showed that, for the AA task in English, some categories of charactern-grams perform better than others [29, p. 94]: “These categories are related to the three linguistic aspects hy- pothesized to be represented by charactern-grams: morphosyntax (as represented by affix-liken-grams), thematic content (as represented by word-liken-grams) and style (as represented by punctuation-based n-grams).” Hence, the authors report that charactern-grams that capture affixes and punctuation information, which can be related to morpho-syntactic and stylistic information, perform better than using all charactern-grams.
This paper focuses on the AA task in the Portuguese language. Work on AA for the Portuguese language is still scarce [13, 33, 36, 37], and several strategies have been put in practice with varying results. From the morphological point of view, Portuguese is a moderately rich language: besides a small set of productive pre- fixes and suffixes, most of these affixes can only be analysed by resourcing to the language’s history; there is a relatively complex verbal inflection system, yielding around 70 inflected forms, several of them homographs; nominal and adjectival is limited to gender and number, within limited set of morphemes. Thus, the settings for then-gram approach to the AA task as used for a language such as English is likely to yield different results in Portuguese. This makes it important to examine which types and/or combinations of charactern-grams are the most predictive for the Portuguese language.
This paper shows that selecting optimal feature representation, a popular machine- learning algorithm, and combining different types of charactern-grams, allows for improving previous results in AA task using the same Portuguese corpus. Moreover, appropriate tuning of the size of the feature data set can render significantly lighter the machine-learning processing with only slight variation of accuracy.
(i) Which types and length of charactern-grams are optimal for the AA task in Portuguese?
(ii) Is it possible to enhance AA performance by selecting an appropriate parame- ters, that is, feature combinations, feature set size, etc. using only the training corpora?
(iii) Which feature representation and machine-learning algorithm provide the best results for this task?
(iv) Is the conclusion reported in [29], that the best performing model is based solely on affix and punctuationn-grams, valid for the Portuguese language?
2 Related Work
Over the last decade, Authorship Attribution has become an important field of study in computational linguistics, among other factors because of its high stake applica- tions in Social Media Forensics [4,5]. The PAN competition1is a series of scientific events and shared tasks on digital text forensics, and it is one of the mainforare- garding the AA and other related tasks. These tasks include Authorship Attribution proper, Authorship Verification (determine if two texts were written by the same author), Clustering (grouping documents by author) and Diarization (identify and group parts of a document written by the same author). Other tasks relate to Author Profiling (by gender, age or personality) and, more recently, Author Obfuscation.
A recent trend on AA and related tasks focused on cross-topic and cross-gender scenarios [35], which is a more realistic context to the development of practical applications of this task. In this section, a selection of the works on the Authorship Attribution task in both the English and Portuguese languages is briefly presented.
Many previous studies focused on finding stylometric features that represent the au- thors style [18, 26, 30]. [10] present an extensive list of the main features used in the AA task: word-based and punctuation-based features, either discarding or com- bining function words statistics, using stemming or lemmatization techniques, and term frequency-inverse document frequency (tf-idf). A popular approach involved using syntactic information extracted from texts: [37] based their approach on syn- tactic features such as subject, predicate, and accessories. In [10], G´omez-Adorno et al.showed that textual patterns obtained from shortest path walks over integrated syntactic graphs is a useful methodology for the AA task. Textual genre and length are key issues in AA. Most work on social media [2, 3, 33] have to tackle with the limited size of the texts.
Some linguistic-poor approaches are based on character n-grams. Many indepen- dent works have demonstrated that charactern-grams are effective features for the AA task [8, 18, 34]. Character n-grams are predictive when used in isolation [8]
or when combined with other stylometric features [25]. Several studies [22, 35]
investigated the impact of varying threshold values in single- and cross-topic AA conditions. The studies conclude that high threshold values are optimal for cross- topic AA. Finally, Sapkotaet al.[29] introduced the notion, that this paper explores, that different types of n-grams may have differential predictive value for the AA task, showing that, for English, using affix+punctuationn-gram categories are more predictive than using alln-grams.
Different machine-learning techniques also perform in a varying way depending on a large number of factors [12]. Several works explore different machine-learning approaches to the AA task. Support Vector Machines (SVM) is a very popular machine-learning method in the field. [37] based their approach on syntactic fea- tures using various fusion methods with SVM. [28] showed that character-level convolutional neural networks outperform state-of-the-art approaches on four out of five examined datasets. Homem and Carvalho [13] explored fuzzy methods to
1 http://pan.webis.de
determine authorship fingerprints in texts. Posadas-Dur´anet al.[24] showed that doc2vec-based feature representation outperforms the state-of-the-art approaches on the examined corpora.
Related work on the Portuguese Language is still scarce (see [1,19] for an overview).
Pavelec et al. [23] used discourse connectors (mainly conjunctions) in Brazilian journalistic text as features to model the AA task. Sousa-Silva [32] experimented with different types of stylistic markers (POS-based, punctuation, word length, suf- fixes, pronouns, and conjunctions) drawing on a corpus of European Portuguese journalistic texts and using SVM, showing that simple quantitative data (word and sentence length, and punctuation), rather than more linguistic rich features, perform remarkably well. Work by Homem and Carvalho [13] also used charactern-grams (n = 4) with a corpus of European Portuguese journalistic texts. Results bellow the threshold of 60% were reported. This corpus has been made available for this paper, so this is the most closely related data available for comparison. In one of the more recent work, [36] examined whether qualitative and quantitative analysis using SVM is an efficient approach to forensic cases of AA. [9] worked on gender classification (Author Profiling task) based on Twitter data in Portuguese. Silvaet al.[33] focused on idiosyncratic usage on a corpus of social media data using SVM.
3 Character N-gram Features
In this work, the same, language-independent, character n-gram categories intro- duced by Sapkota et al. [29] are used. The original definitions for some of the categories are refined in order to make them more complete. This paper also exper- iments with character 4-grams, considering the usually larger word and affix length in Portuguese. The categories of charactern-grams can be organized into three main super categories (affix–, word–, and punctuation–relatedn-grams). They are defined in Table 1. As an example, let us consider the following sample sentence (1):
(1) “Vejo-te na quarta-feira, est´a bem?”, respondeu o Pedro.
(“[I]’ll see you on Wednesday, is [that] okay?”, replied Pedro.)
The charactern-grams (n= 3 and 4) for the sample sentence (1) for each of the cat- egories are shown in Tables 2 and 3, respectively. For clarity, spaces are represented by the underscore ‘ ’.
Following the work by Sapkotaet al.[29], three models ofn-grams are examined:
1. All-untyped: when the categories of n-grams are ignored; any distinctn- gram is a different feature. This corresponds to the more common approach of extractingn-grams without classifying them into different categories.
2. All-typed: whenn-grams of all available categories (affix+word+punct) are considered. Notice that instances of the samen-gram may refer to different features.
3. Affix+Punct: when then-grams of thewordcategory are excluded.
Table 1
Categories of charactern-grams introduced by Sapkotaet al.[29].
Affix character n-grams
prefix Ann-gram that covers the firstncharacters of a word that is at leastn+ 1 characters long.
suffix Ann-gram that covers the lastncharacters of a word that is at leastn+ 1 characters long.
space-prefix Ann-gram that begins with a space and that does not contain any punctuation mark.
space-suffix Ann-gram that ends with a space, that does not contain any punctuation mark, and whose first character is not a space.
Word character n-grams
whole-word Ann-gram that encompasses all the characters of a word, and that is exactlyncharacters long.
mid-word
Ann-gram that containsncharacters of a word that is at least n+ 2 characters long, and that does not include neither the first nor the last character of the word.
multi-word Ann-gram that spans multiple words, identified by the presence of a space in the middle of then-gram.
Punctuation character n-grams(abbreviated aspunct)
beg-punct Ann-gram whose first character is a punctuation mark, but the middle characters are not.
mid-punct Ann-gram whose middle character is a punctuation mark (forn=3).
end-punct Ann-gram whose last character is punctuation mark, but the first and the middle characters are not.
One of the main conclusions of Sapkota et al.[29] was that models based onaf- fix+punctfeatures were more efficient than models trained using all the features. In the current paper, these three models were applied in order to examine whether this conclusion is also valid for the Portuguese language.
Moreover, the performance of each category of charactern-grams is examined sep- arately, and the different models mentioned above are combined, aiming at identi- fying the most predictive stylometric feature combination for Portuguese.
4 Experimental Settings
In this section, the experimental settings are laid out. First the corpus here used is briefly described, in order to present the criteria adopted in building the two sub- sets used in the experiments, abalancedand anunbalancedsubcorpus. Next, the method for defining a baseline is presented, using standard evaluation procedures and machine-learning algorithm (SVM), commonly used in this task.
Table 2
Charactern-grams (n= 3) per category for the sample sentence (1), where SC stands for Super Category.
SC Category 3-grams
affix
prefix Vej qua fei est res Ped
suffix ejo rta ira st´a deu dro
space-prefix na qu es be re o Pe
space-suffix te na t´a eu
word
whole-word bem
mid-word uar art eir esp spo pon ond nde edr
multi-word e n a q ´a b u o o P
punct
beg-punct “Ve -te -fe , e , r
mid-punct∗ “ - , ? ” .
end-punct jo- ta- ra, em? ro.
∗In this work, punctuation marks are separated from adjacent words and from each other by space for this category. This enables to capture their frequency [22].
Table 3
Charactern-grams (n= 4) per category for the sample sentence (1), where SC stands for Super Category.
SC Category 4-grams
affix
prefix quar feir resp Pedr
suffix arta eira ndeu edro
space-prefix na qua est bem res Ped
space-suffix st´a deu
word
whole-word Vejo est´a
mid-word uart espo spon pond onde multi-word∗ te n na q t´a b eu o o P
punct
beg-punct “Vej -te -fei , es , re
mid-punct∗∗ “ - , ? ” .
end-punct ejo- rta- ira, bem? dro.
∗In the case when the previous word is more than one character long, two characters are considered;
otherwise, only one character is considered.
∗ ∗This is the same as for character 3-grams (see Table 2).
4.1 Corpus
Experiments were conducted using a data set extracted from a large corpus com- posed of 5,167 newspaper articles (1,489,947 words) in Portuguese, which were retrieved from the on-line edition of the P´ubliconewspaper. This is the same set of texts that was used by Homem and Carvalho in their paper [13]. For this paper, though, the titles were included in the texts.
The texts in this corpus were written by 87 different authors on 16 distinct topics.
The corpus here used is, therefore, a mixed-topic corpus. This corresponds to a real- istic scenario, where the texts by candidate authors can be written either on the same topic or on different topics. The topics’ classification is derived from the newspaper sections from hence they were retrieved. They include texts fromnational(26%) to world news(16%), including alocal newssection (8%); topic-specific sections re-
late tosport(20%),economy(11%) andculture(1%); thematically mixed sections include: newshighlights(6%) and thelast page(3%) section, an opinionsection, with texts from non-regular contributors’ (3%), as well as achroniclessection, with texts from regular contributors’ (1%); four of the 16 topics have less than 10 texts each. In spite of this topic distribution across the corpus, it should be noticed that, for the purpose of the AA task, some of the thematically mixed sections may also be considered of interest, as long as the number of texts per author is deem sufficient.
The corpus is highly unbalanced in terms of articles/author ratio, with an average of 59.5 texts per author, but only 34 authors having 60 or more texts, one author (chronicle) reaching 169 texts, while the least represented author has only 30 arti- cles. The topic/author ratio is also quite unbalanced: for an average of 3.8 topics per author, only two authors address the maximum of 7 topics, while 9 only write about a single topic (and not always the same). Another issue is that there is a very short number of authors with a relevant number of texts in at least two different topics and, when this is the case, those topics do not always overlap. This situation raises considerable difficulties to cross-topic AA experiments with this corpus. For this paper, cross-topic AA is not addressed.
In the first phase of experiments, a balanced subset of the corpus was used, selecting only those authors who have at least 50 articles each. There were 50 authors with more than 50 articles per author. The corpus was then divided into two subsets and, in order to insure the reproducibility of the results, this splitting was based on the articles’ ID, selecting the first 25 for training and the remaining 25 for evaluation.
This corpus will be referred to asbalanced.
In the second phase, the whole corpus was used. It was divided in a similar way as before, that is, the first half of articles per author were used for training and the second half for testing, using the texts’ ID sequence. In case of an odd number of articles, the remaining text was added to the evaluation set. These settings were adopted in order to be able to compare this paper’s results with those reported in [13], who proceed in the same way. This corpus will be referred to asunbalanced.
4.2 Defining a Baseline
The first set of experiments was carried out using the balance corpus. In order to better frame the results obtained from the different methods here applied to the AA task, the bag-of-words (BoW) approach was defined as the baseline, which is a common procedure for this task, due to its language-independence and the fact that, in spite of its being a relatively simple and computationally inexpensive method, it already yields a strong (and challenging) baseline. In the BoW approach here used, features fed into the machine-learning algorithm are based on word frequency (punctuation marks are ignored).
In view of the size of the dataset, which comprises BoW 45,707 features, different frequency thresholds (frq) values were also experimented, in order to assess the impact of varying the size of the feature set in the performance of the machine- learning algorithms. In this way, frequency thresholds were tested using features
with minimumfrq>25, 50, 75, and 100, that is, first using the whole set of features and then all the features with at least 25, 50, 75, and 100 occurrences in the training corpus, thus progressively reducing the size of the feature set. According to [22]
and [35], selecting an appropriate size of the feature set is important in cross-topic AA. Different threshold values were experimented in order to examine their impact under mixed-topic conditions in Portuguese.
Following Homem and Carvalho [13], who used the same corpus as this paper does, a 50% training/testing corpus partition was adopted for the evaluation; only the training subcorpus is used in order to find the best parameters for the task at hand.
This methodology also follows the practice of PAN international competitions on AA task, where the testing corpus is not made available to the competitors. Besides, experiments were also carried out using an adaptation of the 10-fold cross evaluation method, where the training subcorpus is divided into 10 folds, only 9 are used to train the model and 1 is left out; the model is then evaluated on the testing subcorpus, and the process is repeated leaving another fold out; finally, the results of each training-testing stage are averaged.
Finally, two data representation methods have been compared, namely, the term frequency (tf) described above; and abinaryrepresentation, which indicates just the presence or absence (1 or 0) of a feature in a given document. Thetf-idf and normalized feature representation methods have also been experimented but they were dismissed as they did not show any positive effect on results. Table 4 shows the results from these experiments with a bag-of-word approach, varying the minimum frequency threshold, the feature representation, and the evaluation method.
Table 4
Baseline results in terms of accuracy (%) using thebag-of-words(BoW) approach, with different fre- quency threshold values, different evaluation procedures,i.e.10-fold cross-validation (10-fold) and 50%
training/testing evaluation (50%-test), and different data representation methods, namelyterm frequency (tf) vs.binary, using SVM algorithm. The top accuracy values in each experimental setting are shown in bold typeface.
min. feature frequency
tf binary N of
features 10-fold 50%-test 10-fold 50%-test
0 (all features) 59.52 51.36 70.40 61.84 45,707
25 65.52 57.04 68.96 62.80 2,933
50 64.08 55.84 67.36 60.16 1,554
75 62.24 55.04 64.00 58.16 1,032
100 59.04 50.80 60.24 52.48 749
As one can see from Table 4,binaryfeature representation systematically outper- formsterm frequency(tf) data representation scheme, regardless of the examined threshold and of the evaluation procedures (10-fold cross-validation and 50% train- ing/test partition of the corpus). As expected, the 10-fold cross-validation setting also yields better results than the 50% training/test partition of the corpus.
Also as expected, the different frequency thresholds (frq) have a significant impact on the size of the feature set: forfrq= 25, the 2,933 features corresponds to 6.42%
of the entire data set; the number of features (1,554) is almost halved forfrq= 50;
the reduction in the feature data set (1,032) is less pronounced (66%) in the next threshold (frq= 75); and even less important (73%) forfrq= 100.
Considering the size of the feature set for each frequency threshold, and comparing it with the accuracy obtained for each data representation method (tf/binary) and for the two evaluation scenarios (10-fold/50%-test); it should be noticed that: (i) In the term frequency (tf) settings, the best data size/accuracy combination is achieved withfrq= 25; an important drop is observed when the entire data set is used in- stead (6.00% and 5.68%, in the 10-fold and the 50%-test scenarios, respectively);
moving fromfrq= 25 tofrq= 50 or from here tofrq= 75 has only a minor effect in the performance of the classifiers, resulting in a reduction of accuracy slightly larger in the 10-fold evaluation setting (1.44% and 1.84%) than in the 50%-test set- ting (1.20% and 0.80%); another important drop (3.20% and 4.24%) occurs when selecting afrq= 100. This results can be interpreted in the sense that, when using the term frequency data representation method, low frequency words deteriorate the performance of the classifier, while important information is discarded if only highly frequent words are kept. (ii) In the binary feature representation setting, in 10-fold evaluation scenario the performance progressively decays (a drop of 1.44% from the best-performing all-features scenario to thefrq= 25, and then, progressively, 1.60% tofrq= 50, 3.36% tofrq= 75 till 3.76% forfrq= 75); on the other hand, in the 50%-test evaluation setting, the all-features scenario actually yields slightly worst results thanfrq= 25; still, in both scenarios, the difference between the two best-performing thresholds is small (1.44% in the 10-fold setting, against 0.96% in the 50%-test).
The best result (70.40% accuracy) was achieved using binary feature representa- tion in a 10-fold cross-validation setting and taking all features into consideration.
This could be interpreted as evidence that even low frequency words, usually asso- ciated with topic-specific information, provide useful information to the classifier.
However, low frequency lexical features may be considered as too topic-specific, which may lead to unintended extraction of topic or domain information, instead of capturing the characteristics of the authors’ style.
5 Different Character N-gram Approaches
Next, then-gram methods were applied to the AA task using the same settings as described above, first in a 3-grams scenario and then in a 4-grams scenario. For each scenario, tree different models were built: (i) using only untypedn-grams; (ii) using only typedn-grams; and (iii) combining affix and punctuationn-grams, following the proposal of Sapkota et al.[29]. The 3-gram approach replicates previous ex- periments in the literature [20, 22, 29], while 4-grams were introduced to investigate wether it would be better suited for Portuguese, as it presents a moderately rich mor- phology. For each model, the minimum frequency threshold variation (fromfrq= 0 to 100 with step 25) was tested.
5.1 Character 3-gram and 4-gram Models
Tables 5 and 6 present the results from the 3-gram and 4-gram scenarios, using the three different models presented above, and, for each model, the same frequency threshold values were tested. Again, the same feature representation and evaluation methods were examined. These tables also show, for each setting, the size of the feature set (number of features).
Table 5
Accuracy of character 3-gram models (untyped, typed, and affix+punctuation), across different frequency thresholds, using two feature representation methods and two evaluation procedures (this Table’s head- ings are the same as those of Table 4). The size of the feature set in each specific setting is also provided.
The best performing model for each type of feature set is highlighted in bold typeface. In case two models yield the same result, the one with the smaller number of features is selected.
Model min. feature frequency
tf binary N of
features 10-fold 50%-test 10-fold 50%-test
untyped
0 (all features) 61.20 55.60 69.68 63.20 24,400
25 64.27 58.00 69.52 63.36 6,330
50 64.64 59.20 69.76 62.32 4,659
75 65.28 59.28 69.60 62.56 3,938
100 64.64 58.96 69.12 62.64 3,443
typed
0 61.92 55.44 70.64 64.16 27,686
25 64.80 59.28 70.32 64.32 7,283
50 64.88 59.60 70.72 63.36 5,413
75 65.36 60.00 70.32 63.60 4,559
100 65.36 59.84 69.92 63.20 3,965
affix+ punct
0 60.80 54.40 69.28 60.96 16,275
25 64.56 56.72 69.04 60.48 3,798
50 64.16 57.52 68.56 60.16 2,730
75 65.36 56.32 67.76 59.84 2,255
100 64.40 57.04 68.40 59.36 1,942
As in the case of the BoW approach, binary feature representation always outper- forms term frequency. The remaining of this paper will then focus on the results from binary feature representation, though the corresponding results for term fre- quency are also presented. Typed character 3-grams are slightly more predictive than either untyped or affix+punctuation, the later being showing the worst perfor- mance (though the difference is only marginal). The best 10-fold cross-validation result was obtained with the thresholdfrq= 50. However, accuracy variation across thresholds in each model and even between different models is minimal.
Similarly to a 3-gram scenario, in a 4-gram scenario (Table 6) binary feature rep- resentation systematically provide higher results than term frequency. Also, the typed 4-gram model is slightly more predictive that both the untyped and the af- fix+punctation models. Again, the affix+punctation model is the worst performing.
The conclusion by Sapkota et al.[29] that using only affix+punctuationn-grams is more predictive than using all n-grams does not seem to be valid for the Por- tuguese language. This may indicate thatwordcharactern-gram category, which is
Table 6
Accuracy of character 4-gram models (untyped, typed, and affix+punctuation), across different frequency thresholds, using two feature representation methods and two evaluation procedures (this Table’s head- ings are the same as those of Table 4). The size of the feature set in each specific setting is also provided.
The best performing model for each type of feature set is highlighted in bold typeface. In case two models yield the same result, the one with the smaller number of features is selected.
Model min. feature frequency
tf binary N of
features 10-fold 50%-test 10-fold 50%-test
untyped
0 (all features) 60.96 54.64 69.28 66.16 92,646
25 67.04 60.88 70.48 65.92 15,547
50 67.12 61.76 70.24 65.60 10,535
75 66.96 61.44 70.48 65.44 8,125
100 66.88 60.56 70.48 64.72 6,717
typed
0 61.92 54.48 70.08 66.56 75,969
25 66.72 60.08 70.64 66.40 13,741
50 67.12 61.52 70.40 65.92 9,251
75 66.40 61.36 70.24 65.44 7,100
100 66.64 60.48 69.60 64.72 5,803
affix+ punct
0 61.92 53.92 69.36 64.56 42,463
25 67.20 59.12 69.36 64.72 6,823
50 66.32 59.28 69.76 64.88 4,559
75 64.96 59.84 69.04 64.96 3,528
100 65.68 59.28 68.08 62.96 2,89
considered to be more closely related to thematic content, should not be discarded when dealing with Portuguese. However, as the differences between models are only marginal, more experiments are required to verify this conclusion.
This is somehow strengthen by the fact that, in the BoW approach, low frequency words, which are related to topic-specific information, still contribute to AA ac- curacy in mixed-topic settings. However, as mentioned above, the results may be biased, since the approach may be capturing the topic information and not the style of the author. In the case of 4-grams, any threshold above 0 improves the results.
According to [22, 35], higher frequency threshold values provide better results in cross-topic AA. In the mixed-topic corpus used in this work, varying the frequency threshold does not seem to significantly improve the results; however, it allows for an important reduction of the size of the feature set without loss of accuracy.
Comparing the performance of 3- and 4-gram models, the difference is minimal using the 10-fold cross-validation evaluation method, while when using the 50%- test settings the results of the 4-gram models are approximately 3%–4% higher.
In view of these differences, the untyped 5-gram model was also examined in order to be able to establish the optimal length of charactern-grams. Results are shown in Table 7. They are only slightly lower than those obtained when using 4-grams.
In fact, the typedn-gram approach proposed by Sapkotaet al. [29] is maximally efficient forn-gram models with the maximum length of 4, since when using typed 5-grams, many charactern-grams are not captured by the proposed categories. Mov- ing from a 4-gram to a 5-gram model does not seem to have much impact on the
Table 7
Accuracy of untyped character 5-gram models, across different frequency thresholds, using two feature representation methods and two evaluation procedures (this Table’s headings are the same as those of Table 4). The size of the feature set in each specific setting is also provided. The best performing model is highlighted in bold typeface. In case two models yield the same result, the one with the smaller number of features is selected.
min. feature frequency
tf binary N of
features 10-fold 50%-test 10-fold 50%-test
0 (all features) 57.76 50.64 68.80 64.00 242,932
25 67.12 58.16 70.16 64.40 24,553
50 67.12 59.36 69.68 64.40 14,448
75 65.76 58.24 69.04 64.16 10,173
100 65.28 58.40 68.48 63.60 7,776
Portuguese corpus, probably because average word length is larger than in English.
Still, the size of the feature set significantly increases, which makes this a subop- timal approach. As the differences in the overall performance of 4- and 5-gram models are only marginal, more experiments may be necessary.
Comparing the results above (Tables 5–7) with the bag-of-words baseline approach (Table 4), one can see that most n-gram models outperform the BoW approach, even if the differences are small. Focusing only on the binary feature representa- tion, the only cases when the best n-gram models were unable to yield better re- sults than the best baseline models were: (i) the untyped 3-grams, 10-fold; (ii) the affix+punctuation 3-grams, 10-fold, 50%-test; (iii) the affix+punctuation 4-grams, 10-fold; (iv) the untyped 5-grams, 10-fold. This confirms that the BoW approach is already quite a challenging benchmark for the AA task. In the next sections, different strategies will be put in place to improve the results reported so far.
5.2 Exploring Typed and Untyped Character N-grams
Based on the previous experiments, and focusing only on the binary feature rep- resentation and on the 10-fold cross-validation evaluation method, the threshold frq>50 was selected for the next experiments, since 3 out of the 6 best models were obtained using this threshold. By choosing this threshold an average reduction of 88% of the entire feature set is achieved.
Other experiments were carried out by cutting out the most frequently occurring words in the training corpus, namely by discarding the 50 most frequent words, and then by successively cutting 2%, 5%, and 10% of the most frequent words. This strategy has proved to be helpful in related tasks, such as Author Profiling [20].
However, in the AA task, the most frequent words, which are stop-words for the most part, are considered of a great importance [14]. This conclusion is also valid for Portuguese, since discarding the most frequent n-gram features did not led to improvements in accuracy (for lack of space, results are not provided here).
Next, the contribution of each category of charactern-grams is examined separately (Table 8). To do so, each category was discarded one by one and the performance
of typed 3- and 4-grams was evaluated. If the result is improved (italics in Table 8), the examined category is not predictive; otherwise (bold typeface Table 8), it is a predictive category.
Table 8
Results in terms of accuracy (%) per category using typed character 3- and 4-grams, threshold>50, binary representation, and SVM algorithm. Three best predictive 3- and 4-gram categories are in bold typeface; three worst predictive 4-gram categories are in italics.
Feature set 3-grams N of
features
4-grams N of
features
10-fold 50%-test 10-fold 50%-test
All categories 70.72 63.36 5,413 70.40 65.92 9,251
All – prefix 68.80 62.64 4,419 70.24 65.52 8,082
All – suffix 69.76 63.52 4,768 70.80 66.24 8,205
All – space-prefix 70.72 63.52 4,941 69.92 64.96 8,113 All – space-suffix 70.08 63.52 5,186 70.32 66.32 8,629
All – whole-word 70.24 63.28 5,303 70.48 66.00 9,088
All – mid-word 69.76 62.80 3,447 70.40 65.04 6,265
All – multi-word 70.48 63.12 4,806 70.80 65.92 7,708
All – beg-punct 69.84 63.36 5,280 70.00 65.60 9,021
All – mid-punct 70.32 63.12 5,400 70.32 65.84 9.238
All – end-punct 70.56 63.76 5,167 70,96 65.76 8,910
After establishing the best and worst performing 3- and 4-gram categories, a process of feature selection was undertaken. First, the most predictive 3-gram categories and their combinations were added to the model of All-typed character 4-grams. Results are presented in Table 9. The best model corresponds to combining All-typed char- acter 4-grams with prefix 3-grams and middle-punctuation 3-grams categories. This best-performing model was then selected for the next step of feature selection. Next, the worst predictive 4-gram categories and their combinations were discarded from the best combination established in the previous experiment. The results are shown in Table 10. This strategy does not seem to improve the 10-fold cross-validation accuracy, which indicates that, in these settings, all 4-gram categories contribute to the overall accuracy. However, there is a slight improvement in the 50%-test set- tings when some 4-gram categories are discarded, namely and in decreasing order of accuracy: Best – multi-word (0.72%), Best – end-punctuation (0.24%), Best – suffix– end-punctuation and Best – multi-word – end-punctuation (both 0.16%). As results from this feature selection procedure did not improve accuracy, the strategy of combining different models was tested next.
Next, typed, untyped, 3- and 4-gram models were combined to find the most pre- dictive stylometric feature combination. Typed and untypedn-grams are different features, since typedn-grams are tagged with the corresponding category. One of the reasons why the combination of typed and untyped n-grams can enhance the performance is that some typedn-grams, being divided into multiple categories, are discarded by the high threshold (frq>50), while untypedn-grams are still able to exceed this threshold; e.g., in the phrase“com compaix˜ao”(with compassion) the untyped 3-gram comappears 2 times, but it corresponds to two distinct typed 3- grams: onewhole-word3-gram and anotherprefix3-gram. Moreover, punctuation
Table 9
Results in terms of accuracy (%) combining typed character 4-grams with the three best predictive 3- gram categories and their combinations. Threshold>50, binary representation, SVM algorithm.
Feature set 10-fold 50%-test N of Features Best: All typed character 4-grams 70.40 65.92 9,251
All + prefix 3-grams 70.40 65.44 10,245
All + suffix 3-grams 70.56 65.44 9,896
All + mid-word 3-grams 70.56 65.28 11,217
All + prefix + suffix 3-grams 69.76 65.20 10,890 All + prefix + mid-word 3-grams 70.88 64.88 12,211 All + suffix + mid-word 3-grams 70.16 65.52 11,862 All + prefix + suffix + mid-word 3-grams 70.64 65.36 12,856
Table 10
Results in terms of accuracy (%) using the best feature combination from Table 9 (all + prefix + mid- word 3-grams) as baseline and discarding the worst predictive 4-gram categories (Table 8) and their combinations. Threshold>50, binary representation, SVM algorithm.
Feature set 10-fold 50%-test N of Features
Best: All + prefix + mid-word 3-grams 70.88 64.88 12,211
Best – suffix 4-grams 70.88 64.56 11,165
Best – multi-word 4-grams 70.80 65.60 10,668
Best – end-punct 4-grams 70.72 65.12 11,870
Best – suffix – multi-word 4-grams 70.72 64.40 9,622 Best – suffix – end-punct 4-grams 70.72 65.04 10.824 Best – multi-word – end-punct 4-grams 70.48 65.04 10,327 Best – suffix – multi-word – end-punct 4-grams 70.64 64.08 9.281
marks are separated from adjacent characters by space and included in the middle- punctuation category of typedn-grams, which produces differentn-grams [22];e.g., in the sample sentence (1), the instanceem?constitutes just one untyped 3-gram, but it corresponds to two typed 3-grams:em?(end-punct) and ? (mid-punct). Results are shown in Table 11. Using untyped 3- and 4-grams in combination with typed 3-grams yielded the best performance so far (72.16%). Thus, this combination was selected for further experiments described in the next subsection.
5.3 Further Experiments
5.3.1 Introducing Some Pre-Processing Steps
Pre-processing has proved to be a useful strategy for AA and related tasks [11, 20, 22, 31]. In this paper, two pre-processing steps were examined: (i) replacing digits and (ii) discarding text inside quotations, before extracting charactern-gram features. The first method consists in replacing each digit by ‘0’ (ex., 12,345→ 00,000) aiming at capturing the number format but not the actual number [22]; the second procedure aims at discarding information that does not reflect the author’s writing style. Finally, the two proposed steps were combined. Results are shown in
Table 11
Results in terms of accuracy (%) combining typed and untypedn-grams withn= 3 and 4. Threshold>50, binary representation, SVM algorithm.
Model 10-fold 50%-test N of Features
Untyped 3-grams + untyped 4-grams 71.68 66.00 15,194 Untyped 3-grams + untyped 4-grams +
typed 3-grams 72.16 65.20 20,607
Untyped 3-grams + untyped 4-grams +
typed 4-grams 71.60 66.08 24,445
Typed 3-grams + untyped 3-grams 70.96 63.84 10,072 Typed 3-grams + untyped 4-grams 71.52 65.36 15,948 Typed 3-grams + typed 4-grams 71.68 65.60 14,651 Typed 3-grams + typed 4-grams +
untyped 3-grams 71.60 65.52 19,310
Typed 3-grams + typed 4-grams +
untyped 4-grams 71.68 66.24 25,186
Typed 4-grams + untyped 4-grams 70.72 65.76 19,786 Typed 4-grams + untyped 3-grams 71.68 66.00 13,910 Typed 4-grams + typed 3-grams +
untyped 3-grams + untyped 4-grams 71.68 65.92 29,845
Table 12. The proposed pre-processing steps were unable to enhance the best 10- fold cross-validation result achieved in the previous stage; however, they provided a slight improvement in the 50%-test accuracy (0.48%).
Table 12
Results in terms of accuracy (%) after applying different pre-processing steps to the best feature combi- nation from Table 11. Threshold>50, binary representation, SVM algorithm.
Pre-processing 10-fold 50%-test N of Features Previous best: untyped 3-grams +
untyped 4-grams + typed 3-grams 72.16 65.20 20,607
Replacing digits 71.76 65.68 20,299
Discarding quotes 72.16 65.28 20,566
Replacing digits + discarding quotes 71.68 65.68 20,260
Other experiments were also carried out, namely, by converting all texts to lower- case and by replacing whole numbers by ‘0’ (ex., 12,345→0) and year mentions by ‘YYYY’ (ex., 2016→YYYY). These experiments, however, did not lead to im- provements in accuracy (for lack or space, the results are not provided here). In future work, the impact of other pre-processing steps will be investigated, such as discarding or anonymizing named entities [7].
5.3.2 Using Other Machine-Learning Algorithms
So far, WEKA’s [12] implementation of Support Vector Machines (SVM) algorithm was used. This algorithm with default parameters is considered among the best for the AA task in both the English and the Portuguese languages [23, 33, 36, 37].
Multinomial Naive Bayes (NBM) classifier, which is known to provide high results for text classification tasks [15, 22], was also examined. The J48 and Naive Bayes algorithms have also been examined but they were dismissed as they consistently showed lower results than the SVM algorithm.
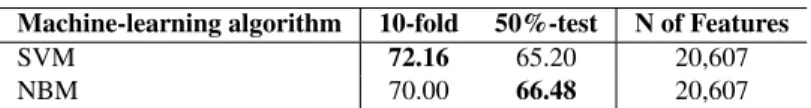
Table 13 presents the results of comparing SVM with NBM performance trained on the best combination ofn-gram categories (untyped 3-grams + untyped 4-grams + typed 3-grams) and without applying any pre-processing steps. In this case, NBM is 2.16% less accurate than SVM under 10-fold cross-validation, but it slightly outperforms SVM in the 50%-test setting. However, additional experiments us- ing NBM classifier with various threshold values and models (untyped, typed, and affix+punctuation), as well as with different feature combinations, showed that the results obtained using NBM classifier are consistently lower than when using SVM (the results are not provided due to lack of space).
Table 13
Results in terms of accuracy (%) using SVM and NBM machine-learning algorithms with the best com- bination ofn-gram categories (untyped 3-grams + untyped 4-grams + typed 3-grams), a frequency thresh- oldfrq>50, with binary representation and without any pre-processing.
Machine-learning algorithm 10-fold 50%-test N of Features
SVM 72.16 65.20 20,607
NBM 70.00 66.48 20,607
5.3.3 Using Unbalanced Corpus
Finally, the best-performing model (untyped 3- and 4-grams + typed 3-grams, shown in Table 11) was applied to theunbalancedcorpus (see Section 4.1,in fine) with the optimal parameters, selected from the best 10-fold cross-validation results, in order to compare this approach with that of Homem and Carvalho [13]. The baseline ex- periment was also conducted using the optimal settings for the bag-of-words (BoW) approach: frequency threshold frq= 0 and binary feature representation (see Ta- ble 4). Table 14 shows the results obtained using SVM and NBM classifiers.
Table 14
Results in terms of accuracy (%) when using the unbalanced corpus without any pre-processing: (1st row) the bag-of-words (BoW) baseline approach (frequency thresholdfrq>0, binary representation, and SVM algorithm); (2ndand 3rdrows) comparing SVM and NBM algorithms using the best feature combination from Table 11 with the frequency thresholdfrq>50 and binary representation.
Unbalanced corpus 10-fold 50%-test N of Features Bag-of-words, SVM (baseline) 62.53 57.27 68,429 Untyped 3-grams + untyped 4-grams +
typed 3-grams (SVM) 64.99 60.84 29,276
Untyped 3-grams + untyped 4-grams +
typed 3-grams (NBM) 59.98 57.16 29,276
Using the best model with the unbalanced corpus yielded an accuracy of 64.99%
under 10-fold cross-validation and 60.84% in the 50%-test setting. The SVM al-
gorithm, when compared with the results obtained with the balanced corpus, shows a 7.17% and 4.36% drop in accuracy (under 10-fold cross-validation and in the 50%-test setting, respectively), while the accuracy of the BoW baseline approach drops 7.87% and 4.57% (10-fold and 50%-test, respectively). In spite of the so- phisticated algorithm proposed by Homem and Carvalho [13], who also used the unbalanced corpus, their results were systematically below the 60% threshold. The BoW baseline approach with the optimal parameters selected in this paper showed results similar to those reported by these authors, while this paper approach based on (typed and untyped) charactern-grams outperforms them.
Conclusions
The Authorship Attribution (AA) task aims at identifying the author of a text based on text samples from known authors. This paper demonstrated that charactern- gram features are highly predictive for the AA task in Portuguese. It showed that the combination of character n-grams of different types and length, along with an appropriate selection of threshold values, feature representation, and machine- learning algorithm, allows one to achieve high performance in this task. The best result was achieved when training SVM classifier on the combination of untyped character 3-grams, untyped character 4-grams, and typed character 3-grams, us- ing binary feature representation and considering only those features that occur at least 50 times in the training corpus. This language-independent approach, with a commonly used SVM algorithm, outperformed both the bag-of-words baseline and previous approaches using the same corpus.
Varying frequency threshold values did not lead to significant improvements on the results. However, it allowed an average reduction of 88% of the entire feature set without loss of accuracy. Moreover, the paper demonstrated that the parameters selected by 10-fold cross-validation using only the training corpus provide near- optimal results when used in the 50%-test setting. The paper also showed that the conclusion of Sapkotaet al.[29] that affix+punctuation charactern-grams perform better than when using alln-grams is not valid for the Portuguese language. Still, more experiments using other corpora are required to verify this conclusion.
Finally, it was demonstrated that feature representation is an important aspect for the AA task in Portuguese. Binary feature representation, in all examined cases, provided higher results than term frequency (an average increase of 4.71% under 10-fold cross-validation and of 5.44% in the 50%-test setting using the balanced corpus). Therefore, in future work, alternative feature representation techniques will be tested, such as second order representation [17] or doc2vec-based feature representation [16]. The later has proved to provide good results for AA in En- glish [24] and in related tasks [21]. The proposed approach will also be examined under cross-topic and cross-genre AA conditions.
Acknowledgements
This work was supported by the Mexican Government (Conacyt projects 240844 and 20161958, SIP-IPN 20171813, 20171344, and 20172008, SNI, COFAA-IPN) and by the Portuguese Government, through Fundac¸˜ao para a Ciˆencia e a Tecnologia (FCT) with reference UID/CEC/50021/2013. The authors express their gratitude to
J.P. Carvalho and his collaborators, who kindly made the corpus available for this paper.
References
[1] Almeida, D.: Atribuic¸˜ao de autoria com prop´ositos forenses. ReVEL Revista Virtual de Estudos de Linguagem, vol. 12, no. 23, 2014, pp. 148–186 [2] Barbon, S., Igawa, R., and Zarpel˜ao, B.: Authorship verification applied to
detection of compromised accounts on online social networks. Multimedia Tools and Applications, 2016, pp. 1–21
[3] Bhargava, M., Mehndiratta, P., and Asawa, K.: Stylometric analysis for au- thorship attribution on twitter. Proceedings of the 2ndIntl. Conf. on Big Data Analytics, Springer, LNCS, vol. 8302, 2013, pp. 37–47
[4] Chaski, C.: Best Practices and Admissibility of Forensic Author Attribution.
Journal of Lay and Policy, vol. 21, no. 2, 2013, pp. 1333–1376
[5] Coulthard, M. and Johnson, A. (Eds.): The Routledge Handbook of Forensic Linguistics, Routledge, 2010
[6] Daelemans, W.: Explanation in computational stylometry. Proceedings of the 14thIntl. Conf. on Intelligent Text Processing and Computational Linguistics, CIC-Ling 2013, 2013, pp. 451–462
[7] Dias, F., Baptista, J., and Mamede, N.: Automated Anonymization of Text Documents. IEEE World Congress Computational Computational In- teligence/Intelligence Methods for NLP, 2016, pp.1287-1294
[8] Escalante, H., Solorio, T., and Montes-y-G´omez, M.: Local histograms of character n-grams for authorship attribution. Proceedings of ACL–HLT 2011, 2011, pp. 288–298
[9] Filho, J., Pasti, R., and de Castro, L.: Gender classification of twitter data based on textual meta-attributes extraction. New Advances in Information Systems and Technologies, Springer, 2016, vol. 444, pp. 1025–1034
[10] G´omez-Adorno, H., Sidorov, G., Pinto, D., Vilari˜no, D., and Gelbukh, A.:
Automatic authorship detection using textual patterns extracted from inte- grated syntactic graphs. Sensors, vol. 16, no. 9, 2016
[11] G´omez-Adorno, H., Markov, I., Sidorov, G., Posadas-Dur´an, J.-P., Sanchez- Perez, M., and Chanona-Hernandez, L.: Improving feature representation based on a neural network for author profiling in social media texts. Compu- tational Intelligence and Neuroscience, vol. 2016, 2016, 13 pages
[12] Hall, M., Frank, E., Holmes, G., Pfahringer, B., Reutemann, P., and Witten, I.: The WEKA data mining software: An update. SIGKDD Explorations, vol.
11, no. 1, 2009, pp. 10–18
[13] Homem, N. and Carvalho, J.P.: Web user identification with fuzzy finger- prints. Proceedings of the IEEE Intl. Conf. on Fuzzy Systems, IEEE Xplorer, 2011, pp. 2622–2629
[14] Kestemont, M.: Function words in authorship attribution. From black magic to theory? Proceedings of the 3rd Workshop on Computational Linguistics for Literature, EACL 2014, 2014, pp. 59–66
[15] Kibriya, A., Frank, E., Pfahringer, B., and Holmes, G.: Multinomial naive Bayes for text categorization revisited. Proceedings of the 17th Australian Joint Conf. on Advances in AI, AI 2004, 2005, pp. 488–499
[16] Le, Q. and Mikolov, T.: Distributed representations of sentences and docu- ments. Proceedings of the 31stIntl. Conf. on Machine Learning, ICML 2014, 2014, pp. 1188–1196
[17] L´opez-Monroy, A., Montes-y-G´omez, M., Escalante, H., Villase˜nor-Pineda, L., and Stamatatos, E.: Discriminative subprofile-specific representations for author profiling in social media. Knowledge-Based Systems, vol. 89, 2015, pp. 134–147
[18] Luyckx, K. and Daelemans, W.: Authorship attribution and verification with many authors and limited data. Proceedings of the 22ndIntl. Conf. on Com- putational Linguistics, COLING 2008, 2008, pp. 513–520
[19] Marquilhas, R., and Cardoso, A.: O estilo do crime: A an´alise de texto em estil´ıstica forense. XXVII Encontro Nacional da Associac¸˜ao Portuguesa de Lingu´ıstica – Textos selecionados, 2011, pp. 416–436
[20] Markov, I., G´omez-Adorno, H., and Sidorov, G.: Language- and subtask- dependent feature selection and classifier parameter tuning for author profil- ing. Working Notes Papers of the CLEF 2017 Evaluation Labs. CEUR Work- shop Proceedings, vol. 1866, CLEF and CEUR-WS.org, 2017
[21] Markov, I., G´omez-Adorno, H., Posadas-Dur´an, J.-P., Sidorov, G., and Gel- bukh, A.: Author profiling with doc2vec neural network-based document embeddings. Proceedings of the 15thMexican Intl. Conf. on Artificial Intelli- gence, MICAI 2016, vol. 10062, Part II, LNAI, Springer, 2017, pp. 117–131 [22] Markov, I., Stamatatos, E., and Sidorov, G.: Improving cross-topic authorship attribution: The role of pre-processing. Proceedings of the 18thIntl. Conf. on Computational Linguistics and Intelligent Text Processing, CICLing 2017, LNCS, Springer, 2017, in press
[23] Pavelec, D., Justino, E., and Oliveira, L.: Author identification using stylo- metric features. Inteligencia Artificial, Revista Iberoamericana de Inteligen- cia Artificial, vol. 11, no. 36, 2007, pp. 59–66
[24] Posadas-Dur´an, J.-P., G´omez-Adorno, H., Sidorov, G., Batyrshin, I., Pinto, D., and Chanona-Hern´andez, L.: Application of the distributed document representation in the authorship attribution task for small corpora. Soft Com- puting, 2016, pp. 1–13
[25] Qian, T., Liu, B., Chen, L., and Peng, Z.: Tri-training for authorship attribu- tion with limited training data. Proceedings of ACL 2014, 2014, pp. 345–351 [26] Ramnial, H., Panchoo, S., and Pudaruth, S.: Authorship attribution using sty- lometry and machine learning techniques. Intelligent Systems Technologies and Applications, Springer, Advances in Intelligent Systems and Computing, vol. 384, 2016, pp. 113–125
[27] Rocha, A., Scheirer, W., Forstall, C., Cavalcante, T., Theophilo, A., Shen, B., Carvalho, A., and Stamatatos, E.: Authorship attribution for social media forensics. IEEE Transactions on Information Forensics and Security, 2016 [28] Ruder, S., Ghaffari, P., and Breslin, J.: Character-level and multi-channel
convolutional neural networks for large-scale authorship attribution. arXiv preprint arXiv:1609.06686, 2016
[29] Sapkota, U., Bethard, S., Montes-y-G´omez, M., and Solorio, T.: Not all char- acter n-grams are created equal: A study in authorship attribution. Proceed- ings of NAACL–HLT 2015, 2015, pp. 93–102
[30] Schwartz, R., Tsur, O., Rappoport, A., and Koppel, M.: Authorship attribu- tion of micro-messages. Proceedings of EMNLP 2013, 2013, pp. 1880–1891 [31] Sidorov, G., Ibarra Romero, M., Markov, I., Guzman-Cabrera, R., Chanona- Hern´andez, L., and Vel´asquez, F.: Detecci´on autom´atica de similitud entre programas del lenguaje de programaci´on Karel basada en t´ecnicas de proce- samiento de lenguaje natural. Computaci´on y Sistemas, vol. 20, no. 2, 2016, pp. 279–288
[32] Sousa-Silva, R., Sarmento, L., Grant, T., Oliveira, E., and Maia, B.: Compar- ing Sentence-Level Features for Authorship Analysis in Portuguese. Compu- tational Processing of the Portuguese Language, Springer, LNAI vol. 6001, 2010, pp. 51–54
[33] Sousa-Silva, R., Laboreiro, G., Sarmento, L., Grant, T., Oliveira, E., and Maia, B.: ‘twazn me!!! ;(’ Automatic authorship analysis of micro-blogging messages. Proceedings of the 16th Intl. Conf. Application of Natural Lan- guage to Information Systems, Springer, vol. 6716, 2011, pp. 161–168 [34] Stamatatos, E.: Author identification using imbalanced and limited training
texts. Proceedings of the 18th Intl. Conf. on Database and Expert Systems Applications, DEXA 2007, 2007, pp. 237–241
[35] Stamatatos, E.: On the robustness of authorship attribution based on character n-gram features. Journal of Law & Policy, vol. 21, no. 2, 2013, pp. 427–439 [36] Teles, L.: Atribuic¸˜ao de autoria em lingu´ıstica forense: uma an´alise combi-
nada para identificac¸˜ao de autor atrav´es do texto. Master thesis, Universidade de Lisboa, 2016
[37] Varela, P., Justino, E., Bortolozzi, F., and Oliveira, L.: A computational ap- proach based on syntactic levels of language in authorship attribution. IEEE Latin America Transactions, vol. 14, no. 1, 2016, pp. 259–266