Methods Ecol Evol. 2019;10:735–743. wileyonlinelibrary.com/journal/mee3 © 2019 The Authors. Methods in Ecology and | 735
Evolution © 2019 British Ecological Society
1 | INTRODUCTION
Temporal trajectories of global diversity (Alroy, 2010a; Alroy et al., 2001, 2008; Sepkoski, Bambach, Raup, & Valentine, 1981) as well as extinction and origination rates (Alroy, 2008, 2014, 2015; Bambach, Knoll, & Wang, 2004; Benton, 1995; Carr & Kitchell, 1980; Foote, 2000; Newell, 1952; Raup & Sepkoski, 1982; Sepkoski, 1993) have led to the recognition of ancient mass extinctions (Alroy, 2008; Raup
& Sepkoski, 1982) and major insights about the interplay of evolu- tionary crisis and recovery. Calculating these time series from an incomplete fossil record is a fundamental task, as they underpin the statistical testing of grand questions in macroevolution.
Early studies largely relied on compendia of stratigraphic ranges, deriving diversity metrics from overlapping durations of taxa (e.g.
Sepkoski, 1984). Since the advent of the Palaeobiology Database (PaleoDB; https://paleobiodb.org) diversity dynamics have largely been inferred from occurrence datasets that incorporate hundreds of thousands of items (Alroy, 2008, 2010a; Alroy et al., 2001). Occurrence data allow for alternative counting methods and sampling standardiza- tion but implementing these methods in scripting languages is time- consuming and can be challenging for students and researchers with little programming experience. The algorithmic implementation of some procedures and the multiple steps of data filtering also permit considerable analytical freedom, which potentially compromises the comparability and traceability of results. Although there are novel alternatives to turnover rate calculation (e.g. the Bayesian approach of the PyRate package, Silvestro, Salamin, & Schnitzler, 2014), a stan- dardized toolkit for the traditional methods will facilitate a fast and Received: 23 September 2018
|
Accepted: 21 January 2019DOI: 10.1111/2041-210X.13161
A P P L I C A T I O N
The r package divDyn for quantifying diversity dynamics using fossil sampling data
Ádám T. Kocsis
1,2| Carl J. Reddin
1| John Alroy
3| Wolfgang Kiessling
11GeoZentrum Nordbayern, Universität Erlangen-Nürnberg, Erlangen, Germany
2MTA-MTM-ELTE Research Group for Paleontology, Budapest, Hungary
3Department of Biological Sciences, Macquarie University, Sydney, New South Wales, Australia
Correspondence Ádám T. Kocsis
Email: adam.kocsis@fau.de Funding information
Deutsche Forschungsgemeinschaft, Grant/
Award Number: Ko 5382/1-1, Ko 5382/1-2, Ki 806/16-1 and FO 2332
Handling Editor: Samantha Price
Abstract
1. Unbiased time series of diversity dynamics are vital for quantifying the grand his- tory of life. Applications include identifying ancient mass extinctions and inferring both biotic and abiotic controls on diversification rates.
2. We introduce divDyn, a new R package that facilitates the calculation of taxo- nomic richness, extinction and origination rates from time-binned fossil data.
State-of-the-art counting protocols, and sampling standardization functions per- mit the reconstruction of biologically meaningful time series. Additional functions permit the partitioning of turnover rates by environmental affinity.
3. Using divDyn, we display Phanerozoic-scale diversity dynamics of marine inverte- brates. With the help of the core function and standard subsampling options, we revisit the hypothesis of declining taxonomic rates over time, mass extinctions and equilibrial diversity dynamics and assess their methodological dependency. Our results suggest that rates declined only over the early Phanerozoic, only three mass extinctions stand out clearly, and evidence of equilibrial dynamics is dependent on the used methods.
4. The modular and fast implementation of published methods ensures traceability, reproducibility and comparability of future studies.
K E Y W O R D S
diversity dynamics, extinction, fossil record, origination, Palaeobiology Database, subsampling
consistent workflow and allow researchers to focus on scientific ques- tions rather than losing time with the repeated implementation of es- tablished methods.
Here, we present the R (R Development Core Team, 2018) pack- age divDyn, which facilitates the calculation of diversity dynam- ics from fossil occurrence datasets. Our purpose is to establish a transparent, traceable and modular workflow from data acquisition to the calculation of biologically meaningful diversity metrics. The primary application of the package is expected to be for data from the PaleoDB, the largest macrofossil occurrence dataset available.
However, any dataset for which diversity metrics are to be assessed in temporal or spatial intervals can also be processed with divDyn.
Examples are the Neotoma Paleoecology Database (Williams et al., 2018), Neptune (Lazarus, 1994), and AMMON (Korn & Ilg, 2007) databases. To demonstrate the benefits of divDyn, we revisit re- sults from an earlier study on Phanerozoic- scale diversity dynamics (Alroy, 2008).
2 | FEATURES
2.1 | Calculation of time series
To prepare an occurrence dataset for analysis in divDyn, it must be formatted as a table with each row representing a single oc- currence of a taxon (Table 1). The core function divDyn() cal- culates taxonomic richness, extinction and origination rate
estimates using the presence–absence patterns of the time bin- taxon matrix implied by the input dataset. It calculates a large suite of diversity metrics and rates in one go, ranging from classi- cal sampled- in- bin richness to the recent extinction and origina- tion rates (Table 2).
TA B L E 1 Format of the data (from the Palaeobiology Database) accepted by the main functions of the package
tax bin coll lat lng
Turbinaria 89 22,968 43.55 -3.82
Lithophyllia 89 22,968 43.55 -3.82
Caryophyllia 89 22,968 43.55 -3.82
Trochocyathus 89 22,968 43.55 -3.82
Favia 91 22,969 46.01 15.36
Solenastrea 91 22,969 46.01 15.36
Tarbellastraea 91 22,969 46.01 15.36
Mussismilia 91 22,969 46.01 15.36
Goniopora 90 22,971 18.09 -61.93
Porites 90 22,971 18.09 -61.93
Note. The tax variable includes the taxon names of the occurrences and bin indicates time (mandatory variables). Occurrences should be as- signed to discrete time intervals (bins), but a continuous time- related di- mension (e.g. years before present, or metres in a section) will be translated to discrete bins by the package. Time flows from smaller to larger numbers by default.
Variable name Metric name Type Reference
tSing, tOri, tExt, tThrough Range- based taxon patterns Counts Foote (1999) t2d, t2u, t3, tPart, tGFu, tGFd Occurrence- based taxon patterns Counts Alroy (2008, 2014) extProp, oriProp Proportional extinctions and originations Turnover Newell (1952) extPC, oriPC Per capita extinction and origination
rates
Turnover Foote (1999); Alroy
(1996) ext3t, ori3t Three- timer extinction and origination
rates
Turnover Alroy (2008)
extC3t, oriC3t Corrected three- timer extinction and origination rates
Turnover Alroy (2008)
extGF, oriGF Gap- filler extinction and origination rates
Turnover Alroy (2014)
ext2f3, ori2f3 Second- for- third substitution extinction
and origination rates Turnover Alroy (2015)
divSIB Sampled- in- bin diversity (SIB) Richness Miller and Foote
(1996)
divRT Range- through diversity (RT) Richness Newell (1952)
divBC Boundary- crosser diversity (BC) Richness Carr and Kitchell
(1980)
divCSIB Corrected sampled- in- bin diversity Richness Alroy et al. (2008) samp3t Three- timer sampling completeness Sampling completeness Alroy (2008) sampRange Range- based sampling completeness Sampling completeness Foote and Miller
(2007) TA B L E 2 Variables output by the main function of the package
2.2 | Sampling standardization procedures
Sampling standardization is a useful tool for reducing the bias of changing sampling intensity. Subsampling, the most common
group of methods in this field of research, uses interpolation to answer the general question, “What would the results look like if fewer data were available?”. Implementations of these methods are available for estimating richness from an incomplete sample (Hammer, Harper, & Ryan, 2001; Hsieh, Ma, & Chao, 2016), but their application is more complicated in the context of time- series reconstruction (Figure 1), where information is aggregated in mul- tiple time bins.
We formalized the subsampling process in the versatile wrapper function subsample(). If the dataset is divisible to time bin- specific parts, a subsampling function can be applied to each of them, so the resulting subsets feature the same sampling characteristics (for instance, intensity). The desired result is then a function (FUN) of this abstract dataset, which can be approximated by generating multiple, random subsamples and allowing the emerging variation to propa- gate to the results of FUN.
The advantage of this formalization is that FUN can be any user- provided function that is applicable to the original dataset, with any sort of output, such as vectors (time series) and complex structures.
In the case of primitive trial results (vectors and matrices), the av- eraging of time series can be automated. The package currently features Classical Rarefaction (CR; Miller & Foote, 1996; Sanders, 1968), Occurrence- Weighted By- List Subsampling (OxW; Alroy et al., 2001), and Shareholder Quorum Subsampling (SQS; Alroy, 2010a).
2.3 | Additional functionality
To facilitate the stratigraphic assignment of collections from the PaleoDB, we compiled tables using the dynamic time- scale interpreter of Fossilworks (http://fossilworks.org/) that links entries to major geochronological inter- vals of two predefined time- scales (the level of geological stages and the 10- million- year [Myr] time- scale). Additional tables are also provided to categorize the downloaded occurrences in terms of bathymetry (shallow, deep), substrate (siliciclastic vs. carbonate) and reef vs. non- reef environ- ments, which are useful for the calculation of environmental preferences (affinity() function) and extinction selectivity (Kiessling & Kocsis, 2015).
The divDyn() function creates output in discretized time inter- vals. Results can be visualized effectively with the additional plotting functions that display the used time- scale (tsplot()), stratigraphic ranges (ranges()) or changes in composition (parts()). The basic functionality of the package is elaborated in the accompanying F I G U R E 1 Demonstration of the procedures implemented in the subsampling wrapper function. (a) Calculation of raw results, (b) calculation of results from a single subsampling trial and (c) multiple trial results and averaging. nD represents a bin- specific subset of the data and g is the subsampling function. The curves show genus richness from the Phanerozoic example dataset, standardized with Shareholder Quorum Subsampling (SQS) at the stratigraphic resolution of geologic stages. Blue line on panel (b) is the same as on (a), red line (c) indicates the mean of the trials. The number of iterations was 100, the quorum for SQS is 0.7
500 400 300 200 100 0
05001,0001,5002,0002,500
Age (Ma)
Richness
Cm O S D C P T J K Pg Ng
raw SIB corrected SIB
500 400 300 200 100 0
05001,0001,5002,0002,500
Age (Ma)
Richness (corrected SIB)
Cm O S D C P T J K Pg Ng
Time (t)
Sampling intensity
... nD
1D 2D 3D 4D
Time (t)
Sampling intensity
... nD
1D 2D 3D 4D
500 400 300 200 100 0
02004006008001,000
Age (Ma)
Subsampled richness (corrected SIB)
Cm O S D C P T J K Pg Ng
(a)
(b)
(c) Multiple subsampling trial results Diversity curve from data of one subsampling trial
Diversity curves based on raw data
standard level of sampling g g
g g
g
vignette (Handout to the R package divDyn), with an example dataset of scleractinian corals used by Kiessling and Kocsis (2015).
3 | EX AMPLE APPLICATION:
PHANEROZOIC- SCALE DIVERSIT Y DYNAMICS OF MARINE ANIMALS
Tracing diversity through the entire Phanerozoic (the last 541 Myr of Earth history) has been a focus of palaeobiological research since the first global diversity curves were published (Newell, 1952). The tem- poral decline of turnover rates has largely gone unchallenged since its first observation (Raup & Sepkoski, 1982), whereas the original
“Big Five” mass extinction events of Raup and Sepkoski (1982) have been repeatedly revisited, with different conclusions (Alroy, 2008;
Bambach et al., 2004). Much discussion has focused on the dramatic rise of marine biodiversity over the last 100 Myr, which is evident in older compilations (Sepkoski, 1993; Valentine, 1970) but much less so in sampling- standardized analyses (Alroy et al., 2008). Not yet for- mally contested are Alroy's (2008, 2010b) analyses of the temporal relationship between diversity and rates. If these results are robust at different temporal resolutions, they strongly argue for equilibrial, diversity- dependent diversity dynamics (Alroy, 1996; Sepkoski, 1978, 1984). With the continuous expansion of both fossil occurrence data- sets and the toolkit to analyse them, it is necessary to re- evaluate such scientific outcomes on a periodical basis. The objective of this case study is to assess the robustness of previous results in the face of the increase in the number of fossil occurrences and the number of analytical choices we face when we express diversity dynamics over deep time.
F I G U R E 2 Genus- level Phanerozoic- scale extinction (a,b) and origination rates (c,d) calculated at the level of 10 million- year (Myr) bins (a,c) and stratigraphic stages (b,d). Each panel features 12 (3 treatment × 4 rate metrics) curves, either raw, CR (quotas are 4,800 occurrences for the 10 Myr bins and 1,100 for the stages) or Shareholder Quorum Subsampling- standardized (quorum is 0.7 for both) average per capita rates, corrected three- timer rates, gap- filler rates or second- for- third substitution rates
Extinction rates
J K Pg Ng
0.00.51.01.52.02.53.0 10 my bins
Cm O S D C P T J K Pg Ng
Stages
Age (Ma)
Origination rates
Cm O S D C P T
Cm O S D C P T J K Pg Ng
500 400 300 200 100 0
0.00.51.01.52.02.53.0
Age (Ma)
Cm O S D C P T J K Pg Ng
500 400 300 200 100 0
(a)
(c)
(b)
(d)
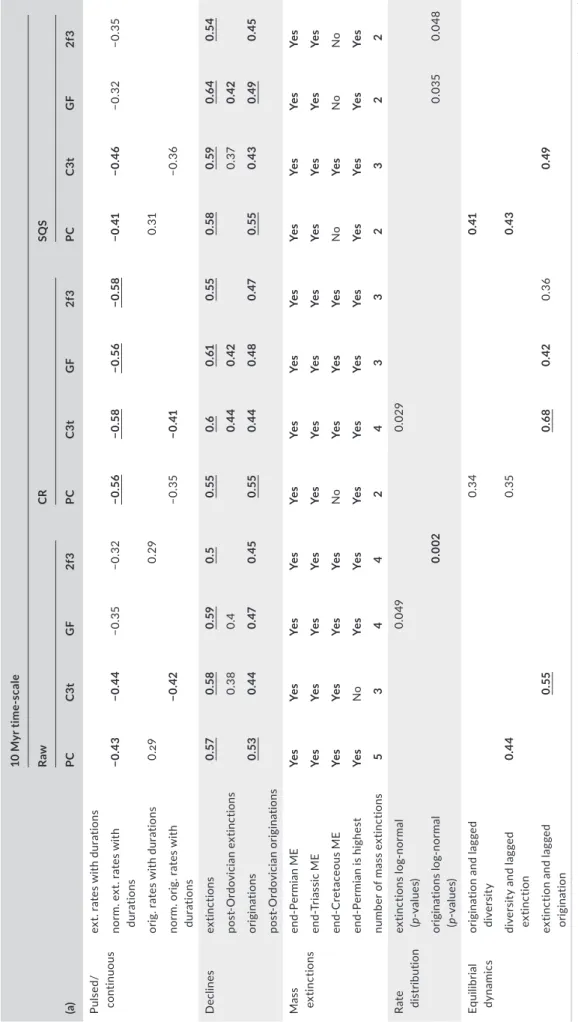
TABLE 3 Results from method- specific outcomes of the time- series calculations for 10 million- year (Myr) bins (a) and stages (b) (a)
10 Myr time- scale RawCRSQS PCC3tGF2f3PCC3tGF2f3PCC3tGF2f3 Pulsed/ continuousext. rates with durations norm. ext. rates with durations−0.43−0.44−0.35−0.32−0.56−0.58−0.56−0.58−0.41−0.46−0.32−0.35 orig. rates with durations0.290.290.31 norm. orig. rates with durations−0.42−0.35−0.41−0.36 Declinesextinctions0.570.580.590.50.550.60.610.550.580.590.640.54 post- Ordovician extinctions0.380.40.440.420.370.42 originations0.530.440.470.450.550.440.480.470.550.430.490.45 post- Ordovician originations Mass extinctionsend- Permian MEYesYesYesYesYesYesYesYesYesYesYesYes end- Triassic MEYesYesYesYesYesYesYesYesYesYesYesYes end- Cretaceous MEYesYesYesYesNoYesYesYesNoYesNoNo end- Permian is highestYesNoYesYesYesYesYesYesYesYesYesYes number of mass extinctions534424332322 Rate distributionextinctions log- normal (p- values)0.0490.029 originations log- normal (p- values)0.0020.0350.048 Equilibrial dynamicsorigination and lagged diversity0.340.41 diversity and lagged extinction0.440.350.43 extinction and lagged origination0.550.680.420.360.49 (Continues)
(b)
Stage- level time- scale RawCRSQS PCC3tGF2f3PCC3tGF2f3PCC3tGF2f3 Pulsed/continuousext. rates with durations0.230.260.240.240.24 norm. ext. rates with durations−0.46−0.35−0.32−0.24−0.64−0.53−0.57−0.51−0.54−0.51−0.44−0.36 orig. rates with durations0.340.310.320.240.240.22 norm. orig. rates with durations−0.52−0.51−0.41−0.32−0.66−0.57−0.57−0.52−0.58−0.5−0.43−0.41 Declinesextinctions0.520.380.390.350.590.430.460.460.590.390.390.37 post- Ordovician extinctions0.270.29 originations0.440.360.360.320.590.390.420.420.520.350.360.36 post- Ordovician originations0.25 Mass extinctionsend- Permian MEYesYesYesYesYesYesYesYesYesYesYesYes end- Triassic MEYesYesYesYesYesYesYesYesYesYesYesYes end- Cretaceous MEYesYesYesYesYesYesYesYesYesYesYesYes end- Permian is highestYesYesYesYesYesYesYesYesYesYesYesYes number of mass extinctions435333343363 Rate distributionextinctions log- normal (p- values)0.0160.0010.028<0.0010.01<0.001 originations log- normal (p- values)0.029<0.0010.0010.001<0.001 Equilibrial dynamicsorigination and lagged diversity0.390.30.230.340.520.330.330.27 diversity and lagged extinction0.610.410.410.350.450.630.240.380.31 extinction and lagged origination0.410.470.43 Note. Both tables are organized to five sections that correspond to discrete parts of the vignette provided in the Supporting Information: “Pulsed/continuous” shows Spearman correlation coefficients between the time series and interval durations (vignette section 5.1A). Significant results indicate undesirable, likely spurious associations. “Declines” indicate Spearman correlation coefficients between age and the values in the time series (v. s. 5.1B). The section “Mass extinctions” indicates whether an event is detectable from the time series, and the number of suggested mass extinctions (v. s. 5.2D). “Rate distribution” includes results of Shapiro–Wilk tests on the log- transformed, detrended rates (v. s. 5.2C). Significant values indicate deviation from log- normality. Section “Equilibrial dynamics” includes significant Spearman cross correlation estimates between time series. Equilibrial dynamics suggest that these three relationships be significant (v. s. 5.2E). Formatting indicates significance (except for bi- nary information): insignificant values are not reported, regular entries indicate 0.05 ≥ p > 0.01, bold entries 0.01 ≥p > 0.001 and underscored bold entries denotep ≤ 0.001. CR: Classical Rarefaction; SQS: Shareholder Quorum Subsampling; Rate metrics are abbreviated: PC: the per capita rates (Foote, 1999); C3t: corrected three- timer rates (Alroy, 2008); GF: gap- filler rates (Alroy, 2014); 2f3: second- for- third substitution rates (Alroy, 2015).
TABLE 3 (Continued)
3.1 | Data processing and applied methods
The analyses presented in this section can be reproduced with the second vignette accompanying the package (Supporting Information).
The data used here were downloaded from the PaleoDB on January 3, 2019, including all occurrences from the Ediacaran to the Holocene.
The data were filtered to marine taxa and binned to geological stages as well as the often- used 10 Myr bins (Alroy et al., 2008). As the procedural treatment of stages in the Cambrian and Ordovician systems was influenced by considerable stratigraphic error, they were resolved using biozone and formation entries (Ordovician), and with data from previous analyses (Cambrian, Na & Kiessling, 2015).
Following related literature, all analyses were carried out at the genus level. However, species- level analyses can be conducted with the same procedures.
We computed diversity dynamics at both stratigraphic res- olutions (stages and 10 Myr), with three different treatments of the data (raw, CR and SQS). Four different rate metrics were ap- plied: per capita rates (Foote, 1999; most prevalent in previous studies), corrected three- timer rates (Alroy, 2008), gap- filler equa- tions (Alroy, 2014) and second- for- third substitution rates of Alroy (2015). This resulted in 24 different sets (2 time- scales × 3 data treatments × 4 rate metrics) of richness, origination and extinction rate series, each affected in a different way by the distorting ef- fects of incomplete, heterogeneous sampling and estimation error.
As indicated by Foote (2005), most taxonomic turnover was probably pulsed, likely at stage boundaries. This assertion is supported by the infrequent correlations between interval dura- tions and rate values when the time dimension is excluded from the rate equations (Table 3 and Alroy, 2008). For the analysis of distributions, outliers and cross correlations, we detrended the rates and the richness by applying LOESS with AICc- based smoothing parameters (Wang, 2010) to describe long- term vari- ation (Bambach et al., 2004). Mass extinctions are defined as statistical outliers (using boxplot statistics) after removing the long- term trend.
3.2 | Results
The first order patterns match well across different methods but the estimates for the individual time slices (Figure 2), and thus the support of the hypotheses (Table 3), may vary considerably. Although a decline of extinction and origination rates is supported if the Cambrian and Ordovician are included in the dataset, these rates are unlikely to have featured a solid decline after the Ordovician period.
All detrended extinction rate series feature the latest Permian value as a mass extinction, which is consistently the highest value in the series. The number of mass extinctions varies among analyses. Of the traditional “Big Five” mass extinctions (Raup & Sepkoski, 1982), the end- Triassic and the end- Cretaceous values also usually show up as outliers, as was indicated by Alroy (2008). Equilibrial dynamics, however, received varying support with the different methods and time- scales.
3.3 | Discussion
Most major results derived from the Phanerozoic- scale analyses of the marine animal fossil record are robust after the additional 10 years of data entry and methodological development since Alroy (2008). Sepkoski (1993) found similar robustness in analysing his older, range- based dataset. One notable exception is the decline of rates through time, which receives varying support if the first two Phanerozoic periods are excluded, suggesting more station- ary turnover after the extinction of high- turnover clades by the mid- Ordovician. Our results support a more continuous transition between background and mass extinction and are more consistent with a “Big Three” (Alroy, 2008; Bambach et al., 2004) rather than a
“Big Five” (Raup & Sepkoski, 1982) scenario. Likewise, changing how the data are treated either questions equilibrial diversity dynamics or suggests that carrying capacities change over time (Alroy, 2010b;
Marshall & Quental, 2016; Sepkoski, 1984).
Whichever the case, using a standard toolkit like divDyn en- hances our ability to reproduce previous results and test the ef- fect of added data, changing temporal resolution, or alternative methods. We hope that our package will spur large- scale diversity analyses beyond the still small group of trained peers. We intend to expand the set of output variables in the future, for instance, by adding interfaces to the PyRate (Silvestro et al., 2014) program and implementations of capture–mark–recapture (Liow & Nichols, 2010) approaches.
ACKNOWLEDGEMENTS
The study was funded by the Deutsche Forschungsgemeinschaft (Ko 5382/1- 1, Ko 5382/1- 2 and Ki 806/16- 1) and is part of the Research Unit TERSANE (FO 2332). The authors are grateful to Na Lin for as- signing the Cambrian collections to stages. Discussions with M.
Steinbauer, E. Jarochowska, J. Pálfy, R. Benson and G. Antell helped in the development of the package, as did the feedback from the first year Master in Palaeobiology students at FAU. Comments of two anonymous reviewers greatly improved the paper. This is Paleobiology Database publication no 335.
AUTHORS’ CONTRIBUTIONS
A.T.K. conceived the project, wrote the first manuscript draft and the software using code from W.K. and J.A. as foundations. W.K. and C.J.R. contributed to testing, interface and feature development, as well as the debugging of code. All authors contributed to writing the manuscript.
DATA ACCESSIBILIT Y
The package is accessible from the CRAN servers (https://CRAN.
R-project.org/package=divDyn) and from its GitHub reposi- tory. The occurrence data used here are freely available from the Paleobiology Database (https://paleobiodb.org/data1.2/occs/list.cs
v?interval=Ediacaran,Holocene&show=class,classext,genus,subge nus,abund,coll,coords,loc,paleoloc,strat,stratext,lith,env,ref,crmod, timebins,timecompare). All files needed to reproduce the example are available on GitHub (archived in Zenodo, https://doi.org/10.5281/
zenodo.2545982).
ORCID
Ádám T. Kocsis http://orcid.org/0000-0002-9028-665X John Alroy http://orcid.org/0000-0002-9882-2111 Carl J. Reddin https://orcid.org/0000-0001-5930-1164 Wolfgang Kiessling https://orcid.org/0000-0002-1088-2014
REFERENCES
Alroy, J. (1996). Constant extinction, constrained diversification, and un- coordinated stasis in North American mammals. Palaeogeography, Palaeoclimatology, Palaeoecology, 127, 285–311. https://doi.
org/10.1016/S0031-0182(96)00100-9
Alroy, J. (2008). Dynamics of origination and extinction in the marine fossil record. Proceedings of the National Academy of Sciences of the United States of America, 105, 11536–11542. https://doi.org/10.1073/
pnas.0802597105
Alroy, J. (2010a). The shifting balance of diversity among major marine animal groups. Science, 329, 1191–1194. https://doi.org/10.1126/
science.1189910
Alroy, J. (2010b). Geographical, environmental and intrinsic biotic con- trols on Phanerozoic marine diversification. Palaeontology, 53, 1211–
1235. https://doi.org/10.1111/j.1475-4983.2010.01011.x
Alroy, J. (2014). Accurate and precise estimates of origination and ex- tinction rates. Paleobiology, 40, 374–397. https://doi.org/10.1666/
13036
Alroy, J. (2015). A more precise speciation and extinction rate esti- mator. Paleobiology, 41, 633–639. https://doi.org/10.1017/pab.
2015.26
Alroy, J., Aberhan, M., Bottjer, D. J., Foote, M., Fürsich, F. T., Harries, P. J.,
… Visaggi, C. C. (2008). Phanerozoic trends in the global diversity of marine invertebrates. Science, 321, 97–100. https://doi.org/10.1126/
science.1156963
Alroy, J., Marshall, C. R., Bambach, R. K., Bezusko, K., Foote, M., Fürsich, F. T., … Webber, A. (2001). Effects of sampling standardization on estimates of Phanerozoic marine diversification. Proceedings of the National Academy of Sciences of the United States of America, 98, 6261–6266. https://doi.org/10.1073/pnas.111144698
Bambach, R. K., Knoll, A. H., & Wang, S. C. (2004). Origination, ex- tinction, and mass depletions of marine diversity. Paleobiology, 30, 522–542. https://doi.org/10.1666/0094-8373(2004)030<0522:
OEAMDO>2.0.CO;2
Benton, M. J. (1995). Diversification and extinction in the history of life.
Science, 268, 52–58. https://doi.org/10.1126/science.7701342 Carr, T. R., & Kitchell, J. A. (1980). Dynamics of taxonomic diversity.
Paleobiology, 6, 427–443. https://doi.org/10.1017/S00948373000 03602 Foote, M. (1999). Morphological diversity in the evolutionary radiation
of Paleozoic and post- Paleozoic crinoids. Paleobiology, 25, 1–115.
https://doi.org/10.1017/S0094837300020236
Foote, M. (2000). Origination and extinction components of taxonomic diversity: General problems. Paleobiology, 26, 74–102. https://doi.org /10.1666/0094-8373(2000)26[74:OAECOT]2.0.CO;2
Foote, M. (2005). Pulsed origination and extinction in the marine realm.
Paleobiology, 31, 6–20. https://doi.org/10.1666/0094-8373(2005)031<
;0006:POAEIT>2.0.CO;2
Foote, M., & Miller, A. I. (2007). Principles of paleontology. New York, NY:
W. H. Freeman and Company.
Hammer, O., Harper, D. A. T., & Ryan, P. D. (2001). PAST: Paleontological statistics software package for education and data analsis.
Paleontologica Electronica, 4, 9.
Hsieh, T. C., Ma, K. H., & Chao, A. (2016). iNEXT: An R package for rarefaction and extrapolation of species diversity (Hill numbers). Methods in Ecology and Evolution, 7, 1451–1456. https://doi.org/10.1111/2041-210X.12613 Kiessling, W., & Kocsis, Á. T. (2015). Biodiversity dynamics and environmen- tal occupancy of fossil azooxanthellate and zooxanthellate scleractinian corals. Paleobiology, 41, 402–414. https://doi.org/10.1017/pab.2015.6 Korn, D., & Ilg, A. (2007). AMMON. Retrieved from http://www.wahre-
staerke.com/ammon/
Lazarus, D. (1994). Neptune: A marine micropaleontology database.
Mathematical Geology, 26, 817–832. https://doi.org/10.1007/
BF02083119
Liow, L. H., & Nichols, J. D. (2010). Estimating rates and probabilities of origination and extinction using taxonomic occurrence data: Capture- mark-recapture (CMR) approaches. In J. Alroy & G. Hunt (Eds.), Quantitative methods in paleobiology (pp. 81–94). Lubbock, TX: The Paleontological Society.
Marshall, C. R., & Quental, T. B. (2016). The uncertain role of diversity de- pendence in species diversification and the need to incorporate time- varying carrying capacities. Philosophical Transactions of the Royal Society B, 371, 20150217. https://doi.org/10.1098/rstb.2015.0217 Miller, A. I., & Foote, M. (1996). Calibrating the Ordovician radiation of
marine lfe: Implications for Phanerozoic diversity trends. Paleobiology, 22, 304–309. https://doi.org/10.1017/S0094837300016237 Na, L., & Kiessling, W. (2015). Diversity partitioning during the Cambrian
radiation. Proceedings of the National Academy of Sciences of the United States of America, 112, 4702–4706. https://doi.org/10.1073/
pnas.1424985112
Newell, N. D. (1952). Periodicity in invertebrate evolution. Journal of Paleontology, 26, 371–385.
R Development Core Team. (2018). R: A language and environment for statis- tical computing. Vienna, Austria: R Foundation for Statistical Computing.
Raup, D. M., & Sepkoski, J. J. J. (1982). Mass extinctions in the marine fossil record. Science, 215, 1501–1503. https://doi.org/10.1126/
science.215.4539.1501
Sanders, H. L. (1968). Marine benthic diversity: A comparative study. The American Naturalist, 102, 243–282. https://doi.org/10.1086/282541 Sepkoski, Jr., J. J. (1978). A kinetic model of Phanerozoic taxonomic di-
versity I. Analysis of marine orders. Paleobiology, 4, 223–251. https://
doi.org/10.1017/S0094837300005972
Sepkoski, Jr., J. J. (1984). A kinetic model of Phanerozoic taxonomic di- versity. III. Post- Paleozoic families and mass extinctions. Paleobiology, 10, 246–267. https://doi.org/10.1017/S0094837300008186 Sepkoski, J. J. J. (1993). Ten years in the library: New data confirm paleon-
tological patterns. Paleobiology, 19, 43–51. https://doi.org/10.1017/
S0094837300012306
Sepkoski, J. J., Bambach, R. K., Raup, D. M., & Valentine, J. W. (1981).
Phanerozoic marine diversity and the fossil record. Nature, 293, 435–
437. https://doi.org/10.1038/293435a0
Silvestro, D., Salamin, N., & Schnitzler, J. (2014). PyRate: A new program to estimate speciation and extinction rates from incomplete fossil data. Methods in Ecology and Evolution, 5, 1126–1131. https://doi.
org/10.1111/2041-210X.12263
Valentine, J. W. (1970). How many marine invertebrate fossil species? A new approximation. Journal of Paleontology, 44, 410–415.
Wang, X.-F. (2010) fANCOVA: Nonparametric analysis of covariance.
Retrieved from https://CRAN.R-project.org/package=fANCOVA Williams, J. W., Grimm, E. C., Blois, J. L., Charles, D. F., Davis, E. B., Goring, S.
J., … Takahara, H. (2018). The Neotoma Paleoecology Database, a mul- tiproxy, international, community- curated data resource. Quaternary Research, 89, 156–177. https://doi.org/10.1017/qua.2017.105
SUPPORTING INFORMATION
Additional supporting information may be found online in the Supporting Information section at the end of the article.
How to cite this article: Kocsis ÁT, Reddin CJ, Alroy J, Kiessling W. The R package divDyn for quantifying diversity dynamics using fossil sampling data. Methods Ecol Evol.
2019;10:735–743. https://doi.org/10.1111/2041-210X.13161