Article
Biochemical and Gene Expression Analyses in Different Poplar Clones: The Selection Tools for Afforestation of Halomorphic Environments
Vladislava Galovi´c1,*, Marko Kebert1, Boris M. Popovi´c2, Branislav Kovaˇcevi´c1, Verica Vasi´c1, Mary Prathiba Joseph3,4, Saša Orlovi´c1and LászlóSzabados4
Citation: Galovi´c, V.; Kebert, M.;
Popovi´c, B.M.; Kovaˇcevi´c, B.; Vasi´c, V.; Joseph, M.P.; Orlovi´c, S.; Szabados, L. Biochemical and Gene Expression Analyses in Different Poplar Clones:
The Selection Tools for Afforestation of Halomorphic Environments.
Forests2021,12, 636. https://doi.org/
10.3390/f12050636
Academic Editors: Ronald S. Zalesny Jr. and Andrej Pilipovi´c
Received: 2 April 2021 Accepted: 10 May 2021 Published: 18 May 2021
Publisher’s Note:MDPI stays neutral with regard to jurisdictional claims in published maps and institutional affil- iations.
Copyright: © 2021 by the authors.
Licensee MDPI, Basel, Switzerland.
This article is an open access article distributed under the terms and conditions of the Creative Commons Attribution (CC BY) license (https://
creativecommons.org/licenses/by/
4.0/).
1 Institute of Lowland Forestry and Environment (ILFE), University of Novi Sad, Antona ˇCehova 13d, 21000 Novi Sad, Serbia; kebertm@uns.ac.rs (M.K.); branek@uns.ac.rs (B.K.); vericav@uns.ac.rs (V.V.);
sasao@uns.ac.rs (S.O.)
2 Department of Field and Vegetable Crops, Faculty of Agriculture, University of Novi Sad, Trg Dositeja Obradovi´ca 8, 21000 Novi Sad, Serbia; boris.popovic@polj.uns.ac.rs
3 Laboratory of Plant Physiology and Biophysics, Plant Science Group, Institute of Molecular, Cell, and Systems Biology, University of Glasgow, Glasgow G12 8QQ, UK; mary.joseph@glasgow.ac.uk
4 Laboratory of Arabidopsis Molecular Genetics, Institute of Plant Biology, Biological Research Center of the Hungarian Academy of Sciences (BRC), University of Szeged, Temesvári krt. 62, 6726 Szeged, Hungary;
szabados.laszlo@brc.mta.hu
* Correspondence: galovic@uns.ac.rs; Tel.: +381-692-038-911
Abstract:Halomorphic soils cover a significant area in the Vojvodina region and represent ecological and economic challenges for agricultural and forestry sectors. In this study, four economically important Serbian poplar clones were compared according to their biochemical and transcriptomic responses towards mild and severe salt stress to select the most tolerant clones for afforestation of halomorphic soils. Three prospective clones ofPopulus deltoides(Bora-B229, Antonije-182/81 and PE19/66) and one of hybrid genetic backgroundP. nigra x P. deltoides, e.g.,P. x euramericana (Pannonia-M1) were hydroponically subjected to NaCl as a salt stress agent in a concentration range from 150 mM to 450 mM. Plant responses were measured at different time periods in the leaves. Biochemical response of poplar clones to salt stress was estimated by tracking several parameters such as different radical scavenging capacities (estimated by DPPH, FRAP and ABTS assays), accumulation of total phenolic content and flavonoids. Furthermore, accumulation of two osmolytes, glycine betaine and proline, were quantified. The genetic difference of those clones has been already shown by single nucleotide polymorphisms (SNPs) but this paper emphasized their differences regarding biochemical and transcriptomic salt stress responses. Five candidate genes, two putative poplar homologues of GRAS family TFs (PtGRAS17andPtGRAS16),PtDREB2of DREB family TFs and two abiotic stress-inducible genes (PtP5SC1,PtSOS1), were examined for their expression profiles. Results show that most salt stress-responsive genes were induced in clones M1 and PE19/66, thus showing they can tolerate salt environments with high concentrations and could be efficient in phytoremediation of salt environments. Clone M1 and PE19/66 has ABA-dependent mechanisms expressing thePtP5CS1gene while clone 182/81 could regulate the expression of the same gene by ABA-independent pathway. To improve salt tolerance in poplar, two putative GRAS/SCL TFs andPtDREB2gene seem to be promising candidates for genetic engineering of salt-tolerant poplar clones.
Keywords:poplar; salt stress; gene expression analyses; radical scavenger capacity; osmolytes
1. Introduction
Mitigation of climate change became a pivotal mission in the 21st century which employs vast scientific resources since climate change threatens some of the most important forest tree species with extinction. Rising global temperatures are expected to accelerate
Forests2021,12, 636. https://doi.org/10.3390/f12050636 https://www.mdpi.com/journal/forests
Forests2021,12, 636 2 of 21
salinization of soil. Until now, 20% of the world’s cultivated land and nearly half of irrigated land is believed to contain elevated concentrations of salt that reduce plant yield significantly below their genetic potential. Every minute, soil salinity claims about three hectares of arable land from conventional crop farming [1] and as the climate warms up, the soil continues to get saltier [2]. This implicates not only crop yield losses but also other environmental problems [3–5], in the forestry sector which is also under serious pressure [6].
This increasing tendency is occurring in Serbia at a greater frequency, especially in the agricultural region of Vojvodina. Halomorphic soil area of 106,000 hectares (5.5%) estimated by Ivaniševi´c et al. [7] is increasing due to industrial pollution, mining and neglected irrigation [8].
One of the major consequences of various environmental stresses, including salt stress, is oxidative stress [9,10]. Oxidative stress presents an imbalance between antioxidant defense and production of reactive oxygen species (ROS), including hydrogen peroxide and oxygen-centered free radicals like superoxide, hydroxyl and hydroperoxyl radicals [11].
Plants produce many antioxidants responsible for the neutralization and detoxification of ROS. One of the largest and most diverse groups of antioxidants present in plants are polyphenols. Phenolic compounds act as antioxidants preventing the escalation of oxidative stress and protecting plants against the oxidative damage of increased ROS levels [12]. Moreover, beside antioxidant activity, polyphenols exhibit multiple roles in plant–environment interactions, including signaling and plant defense [13–15]. Many stud- ies have confirmed that salt and drought stress provoke polyphenol accumulation in most vascular plant species [12–15] but there are still only a small number of research studies on woody plant species. Post-harvest treatment ofGinkgo bilobaleaves with 200 mmol/L NaCl significantly increased the accumulation of flavonoids [16,17]. The effects of salt stress on polyphenol and antioxidant status of poplar are still unexplored and poorly understood.
High levels of sodium ions (Na+) are toxic to plants because of their adverse effects on cellular metabolism and ion homeostasis [18–20]. Therefore, maintaining high and low levels of Na+in the cell, specifically in the cytoplasm, is essential for plants [19,21]. Various plant genetic strategies have been proposed to solve the salinity issue in the climate change context. One strategy is to find a mechanism based on biosynthesis of secondary metabolites that would counteract and balance ionic and hyperosmotic stresses and alleviate overall stress to survive these conditions [20,21]. The other strategy proposed by Shabala et al. [1]
is based on targeting the mechanisms conferring Na+sequestration in external storage organs in halophytes. Also, there are strategies based on manipulation with regulatory genes as a more effective approach for developing stress-tolerant plants [22]. According to Hasegawa et al. [23], functional genomics studies of plant stress responses, particularly the identification of a core set of stress-related transcripts, are crucial for both tolerant germplasm exploitation and tolerant crop development through genetic manipulation.
Numerous scientists characterized physiological, biochemical and molecular responses of different model plants to investigate salt stress mechanisms that each of them has devel- oped as a unique salt-adaptive feature. Hence, plants that exhibit high genetic variation for salt tolerance and biological response to salt stress are highly species, genotype and organ specific. Due to the entirely sequenced genome of poplar (Populus trichocarpa) [24], this species became a model plant system for molecular research in woody plant species, which significantly facilitated molecular biology research in forestry. Another poplar species that draws a lot of scientific attention isPopulus euphraticaOliv. that is known for its tolerance to salinity, which was of great importance for large-scale afforestation on saline desert sites in China due to its ability to tolerate up to 450 mM NaCl [25].
When plants are subjected to salt stress, they can increase their stress tolerance by regulating the production of certain metabolites that can reduce damage. Examples include synthesizing osmotic adjustment substances, such as proline, glycine betaine, polyols, polyamines and some soluble proteins, as well as protective enzymes [25–27]. Extensive literature about different salt and drought effects on accumulation of free proline in various vascular but also woody plant species is available [28–33]. An overall conclusion could be
Forests2021,12, 636 3 of 21
that proline accumulation has a significant impact on plant tolerance to salt since most of the studies reported considerably higher amounts of this amino acid in plants subjected to salt stress [34–36]. For that reason, proline has been introduced as a universal salinity- and drought-inducible biochemical marker. Due to its osmoprotective and antioxidant prop- erties, an increase in proline content was linked to improved salt tolerance in plants. The same can be said about proline in the context of other abiotic stress factors such as drought, extreme temperatures, UV radiation and heavy metals induced stress that consequently causes secondary stresses such as osmotic and/or oxidative stress [37,38]. Beside men- tioned modes of action against environmental stresses, other functions were later identified for proline, such as its chaperone function and its important role in signaling and in modu- lation of the translation of proline-rich proteins, as well as redox potential buffering and regulation of different enzymes’ activities and stabilization of ROS-scavenging enzymes, as reviewed by Cushman et al. [37]. It was found inG. bilobaseedlings that the proline content decreased significantly under low NaCl concentrations (50 and 100 mmol/L) and increased significantly under higher concentrations compared to non-treated controls [16].
Intriguingly, proline accumulation was strongly suppressed in tobacco leaves when the plants were exposed to a combination of different stresses [29].
Another important salt stress biochemical marker is quaternary ammonium com- pound (QAC), known as glycine betaine (GB), that is a fully N-methylated derivative of glycine. GB has a strong osmoprotective action caused by dehydration injuries at the cellular level as well as during salt stress [39]. Plants that are characterized with higher amounts of GB at the organ or cell level normally represent genotypes that are more tol- erant to salt than sensitive genotypes. Significantly higher levels of GB during salt stress were found in different crop plants including sugar beet (Beta vulgaris), spinach (Spinacia oleracea), barley (Hordeum vulgare), wheat (Triticum aestivum) and sorghum (Sorghum bicolor) under various abiotic factors [39,40]. Large embodiments of the literature are focused on the mechanisms of increased stress tolerance of plants after exogenous proline and glycine betaine application, especially concerning drought, salt, cold or high-temperature stresses of genetically engineered plants that overproduce GB and/or proline [30,40,41].
Encoding different structural and regulatory proteins, numerous genes are upreg- ulated under stress conditions in vegetative tissue [20,30]. The candidate genes for this study belong to different metabolic pathways and have various modes of action but all play a role in the salt stress defense mechanism. Delta-1-pyrroline-5-carboxylate synthetase enzymes (P5CS), which catalyze the rate-limiting step of proline biosynthesis, are encoded by two closely related P5CS genes (P5CS1andP5CS2) in Arabidopsis. Transcription of the P5CS genes is differentially regulated by drought, salinity and abscisic acid, suggesting that these genes play specific roles in the control of proline biosynthesis [42]. According to the same authors, p5cs1-1 mutants accumulate less proline in response to salt stress than wild-type seedlings. Their roots are more hypersensitive to salt stress and have increased evidence of oxidative stress and lipid peroxidation under salt stress than the wild-type plants. Proline accumulation is thought to function as a compatible osmolyte that stabilizes membranes and subcellular components [31,32]. The SOS1 gene is one of the Na+trans- porters that modulate salt tolerance in plants [43]. It belongs to an overly salt-sensitive pathway and acts as a proton exchanger. Maintaining low levels of sodium ions in the cell cytosol is critical for plant growth and development. Biochemical studies suggest that Na+/H+exchangers in the plasma membrane of plant cells contribute to cellular sodium homeostasis by transporting sodium ions out of the cell [44]. Genetic analysis has linked components of the overly salt-sensitive pathway (SOS1–3) to salt tolerance inArabidopsis thaliana[45,46]. The predicted SOS1 protein sequence and comparisons of sodium ion accumulation in wild-type and SOS1 plants suggest that SOS1 is involved directly in the transport of sodium ions across the plasma membrane. SOS1 contributes to plasma membrane Na+/H+exchange and SOS2 and SOS3 regulates SOS1 transport activity [43].
Steady-state SOS1 transcript levels increase significantly in roots and to a much lesser extent in shoots when seedlings are exposed to high levels of NaCl. This regulation by
Forests2021,12, 636 4 of 21
salt is mediated, at least in part, by the other identified components of the SOS pathway, SOS3 (a calcineurin B-like calcium-binding protein) and SOS2 (a serine/threonine protein kinase) [44].
Transcription factors (TFs) play important regulatory roles in targeting specific stress- related genes via binding to cis-acting elements in the DNA adjacent to the specific gene [47,48]. The DREB transcription factors play important roles in regulating abiotic stress-related genes and thereby imparting tolerance to stresses such as cold, drought and high-salt environment to the plant [49,50]. To date, many DREB genes have been identified from various plant species, and the products of these genes have been classified into six groups, termed A-1 to A-6 [49]. DREB members of different groups play diverse roles in plants. The CBF/DREB1s of the A-1 group play a critical role in cold-responsive gene ex- pression, whereas DREB2s in group A-2 show expression under dehydration and high-salt stresses [51,52]. Meanwhile, crosstalk between CBF/DREB1 and DREB2 pathways may exist, because some DREB1 genes are also induced by osmotic stress or high-salt stress [53].
Salt and drought-inducible poplar GRAS protein SCL7 showed that this gene is potentially useful for engineering drought and salt tolerance in trees, thus focusing our attention to a GRAS/SCL transcription factor (TF) as a candidate gene for this study [48].
GRAS gene homologs have been found inA. thaliana and in other higher plants like black cottonwood (P. trichocarpa) where two putative homologous nucleotide sequences have been obtained,PtGRAS17andPtGRAS16. Moreover, poplarGRAS16, according to phylogenetic analyses, does not exist in the Arabidopsis genome. Characterization of these two salt stress-associated genes, by screening for nucleotide diversity (SNPs) in the coding region, proved that these four clones differ from each other [54], which leads to the assumption that those clones might also have a different response to salt stress. In our earlier research, the genetic difference of the clones was proven by SNPs but their biochemical and transcriptomic background regarding their response to salt stress will be revealed in this paper for the first time.
Investigating the polyphenol and antioxidant status as well as revealing the molecular response of different poplar clones will be helpful in developing selection strategies for improving poplar salt tolerance. Moreover, information on salt-responsive proteins/genes will be crucial for improving salt tolerance through genetic engineering techniques [22].
Although numerous genetic studies in the field of adaptability of forest species have been published, little is known about the molecular basis of this process [54]. This research contributes to revealing the molecular basis of adaptation (e.g., tolerance to abiotic stress) involving biochemical and gene expression analyses on domestic poplar clones.
The aim of this research was to employ biochemical and gene expression analyses to characterize the genetic impact on the clones in response to salt stress and evaluate reliable candidate marker genes as tools for clone selection for afforestation of the halomorphic environment.
2. Materials and Methods
2.1. Plant Material and Growth Conditions
One-year-old Populus cuttings were collected from the Gene bank of the Institute of Lowland Forestry and Environment (ILFE), Novi Sad, Serbia. The three-way random experiment was established in hydroponic culture where 4 different poplar clones were analyzed. The clones were chosen for their favorable selection characteristics like vigorous growth, straight stem, excellent rooting potential and tolerance against prevalent pests and diseases. Three clones representPopulus deltoides(B229, collection number B229; 182/81, collection number 182/81 and PE19/66) and one was of hybrid origin, M1, collection number M1 (Populus x euramericana) (Table1). All biochemical and expression assays were done in triplicates on the leaf level. In total, 144 cuttings (36 cuttings per clone) were used for the experiment. The cuttings were randomized in 4 trays, dipped in aerated Hoagland solution and exposed to a 16 -hour photoperiod until full root and leaf development. After a month of growth and once fully developed, they were gradually subjected to salt stress
Forests2021,12, 636 5 of 21
with variation in NaCl concentrations (150 mM, 300 mM, 450 mM). For expression studies the time point sampling (control and treated) were 3, 8 and 24 h after NaCl treatment, while for biochemical assays were 3, 8, 12 and 24 h upon stress induction. Samples were frozen in liquid nitrogen and kept at−80◦C for further procedures.
Table 1.Poplar clones used in this study.
Clone Name Clone Collection No. Species
Bora B229 P. deltoides
In the process PE19/66 P. deltoides
Pannonia M1 P. x euramericana
Antonije 182/81 P. deltoides
2.2. Biochemical Analyses
2.2.1. Extract Preparation for Biochemical Assays
20 mg of leaf tissue were homogenized in 2 mL of 96% ethanol. The homogenate was centrifuged at 15,000gfor 10 min at 4◦C and the supernatant was used for biochemical assays. All assays were measured on a spectrophotometric plate reader (MultiScan GO, Thermo Fisher Scientific, Waltham, MA, USA).
2.2.2. Flavonoid Determination
The aluminum chloride colorimetric method [55] with slight modifications was used for flavonoid determination. Briefly, 30µL of the extract was added to 90µL of methanol, then 6µL 1.0 M NaCH3COO plus 6µL 0.75 M AlCl3were added to the mixture and the volume was brought to 300µL with water. The absorbance of the reaction mixture was measured at 415 nm. The number of total flavonoids was calculated from a calibration curve constructed in 8 points in the interval of 10–250µg using quercetin as a standard.
Results were expressed as quercetin equivalents (QE) in milligrams per gram FW of the initial sample extracted in ethanol using 10 as a dilution factor.
2.2.3. Total Phenol Content (TPC) Assay
Amounts of total phenols were determined by using the method given by Chang et al. [55].
Extracts of 25µL, 125µL of 0.1 M Folin–Ciocalteu reagent and 100µL of sodium carbonate (7.5% Na2CO3) were mixed. The absorbance was read at 760 nm on a spectrophotometric plate reader (MultiScan GO, Thermo Fisher Scientific, Waltham, MA USA). The results were expressed as gallic acid equivalents (GAE) in milligrams per g of fresh weight.
2.2.4. DPPH Assay
Extracts were tested for their scavenging effect on the 2.2-diphenyl-1-picrylhydrazyl (DPPH) radical according to the method of Kim et al. [56]. 10µL of plant extract were added to 270µl of a 0.004% (w/v) solution of DPPH in 95% ethanol. The reaction mixture was shaken vigorously, and the absorbance of the remaining DPPH was measured at 520 nm after 5 min. Radical scavenger capacity (RSC) of poplar extracts against DPPH was expressed in mmol of Trolox equivalents per g fresh weight (mmol TE/g FW). The DPPH radical scavenging capacity (RSC%) was expressed as a percentage calculated by using the Equation (1):
RSC [%] = (AControl−ASample)/AControl∗100% (1) where AControlstands for the absorbance of the DPPH reagent while ASamplerepresents the absorbance of DPPH reagent in the presence of the extract.
2.2.5. ABTS+Assay
Antioxidant activity of ethanolic extracts was estimated in terms of the ABTS+radical- scavenging capacity following the procedure described by Arnao [57]. 10µL of sample
Forests2021,12, 636 6 of 21
were added to 290µL of diluted ABTS+solution in microplate wells, and the absorbance was measured at 734 nm. The free radical-scavenging activity was expressed as mmol of Trolox Equivalent (TE) per gram FW sample (mmol TE g−1FW).
2.2.6. FRAP Assay
The FRAP test measures the ability of antioxidants to reduce the ferric 2.4.6-tripyridyl- s-triazine complex (Fe3+-(TPTZ)2)3−to the intensively blue-colored ferrous complex ((Fe2+- (TPTZ)2)2−in acidic medium. To perform the assay, 20µL of leaf extract was added to 225µL of FRAP reagent and 25µL of water and shaken for 20 s and the absorbance was recorded at 593 nm. Ascorbic acid with concentrations from 0 to 500µM was used as a standard. Results were expressed as ascorbic equivalents (AE) in milligrams per gram FW of the initial sample extracted in ethanol [58].
2.3. Biochemical Data Analysis
Tolerance index (TI) [59] was used to calculate clone response to the examined treat- ments, in comparison to control, for every biochemical parameter by the Equation (2):
TI = Xt/XControl (2)
where Xtstands for the value of the examined treatment and the XControlstands for each value obtained for the control.
The obtained data for biochemical parameters were analyzed by repeated measures two-way analysis of variance, with clone and salt concentration as the main effects and time of measurement as the effect of repeated measures. The results of repeated measures ANOVA were used for Tukey’s HSD (honestly significant difference) test. In graphs and tables presenting results of Tukey’s test, treatments that have the same letter belong to the same homogenous group at the level of a = 0.05 (the same letter stands for the treatments that are not statistically significant). These tests were performed in STATISTICA 13 software [60].
2.4. Gene Expression Analyses
2.4.1. RT-PCR and Dye-Based qPCR Analyses
Reverse transcription PCR (RT-PCR) and subsequently quantitative PCR (qPCR) were performed to test the expression level of five stress-inducible candidate genes in the controls and treated poplar leaf tissue.
Experimental part and all preparations for expression analyses, including RT-PCR, were carried out in ILFE molecular laboratory while the qPCR analyses were conducted at Biological Research Centre, Szeged, Hungary (BRC). Total RNA from each sample (control and treated) was extracted from leaves using RNeasy Mini kit (Qiagen, Hilden, Germany). The integrity of total RNA was assessed and determined together with its quality and quantity by MultiNA chip electrophoresis system (SHIMADZU, Kyoto, Japan).
The RNA (1µg) was reverse transcribed into cDNA using the AMV Reverse Transcrip- tase enzyme (Merck Millipore, Burlington, MA, USA). The reaction mixture for reverse transcription was prepared following the manufacturer’s instruction. Integrity of cDNA was first check by BioSpec-nano Micro-volume UV-Vis Spectrophotometer (SHIMADZU, Kyoto, Japan), followed by qPCR expression check of different cDNA dilutions with the reference gene and the genes of interest. All the samples were set in triplets. The diluted cDNA (1:20) was subsequently used as template for qPCR using the primers:
PtP5CS1-F (50-ggcgttctcctgattgttttt-30) andPtP5CS1-R (50-gagtccattcccacttctgatt-30);PtSOS1- F (50-ttgattggaaaaactcctgctc-30) andPtSOS1-R (50-tcctgatggaatgacagcctac-30);PtDREB2-F (50-gattgttctcggggagttga-30) andPtDREB2-R (50-ccacgaaggattttctgattga-30);PtGRAS17-F (50-cttaaaaatccctctctctctctcc-30) andPtGRAS17-R (50-tctccagccaaccttcttactt-30);PtGRAS16-F (50-actatttctttagacccaacgacgac-30) andPtGRAS16-R (50-atcgcctccacaacagcc-30);PtActin_F (50-ggatattcagccccttgtctg-30) andPtActin_R (50-ttctgccccattccaacc-30) (Table2).
Forests2021,12, 636 7 of 21
Table 2. List of stress-inducible candidate genes, accession numbers and corresponding primer sequences used for expression analyses.
Stress-Induced Genes NCBI Accession Number
Sequences (5’→3’)
Tm (0C) Product Size (bp)
P5CS1 EEF01373 PtP5CS1-F ggcgttctcctgattgttttt 60.48 84
PtP5CS1-R gagtccattcccacttctgatt 59.44
SOS1 EEF02008 PtSOS1-F ttgattggaaaaactcctgctc 60.59 146
PtSOS1-R tcctgatggaatgacagcctac 61.40
DREB2 XM_002315114 PtDREB2-F gattgttctcggggagttga 60.05 78
PtDREB2-R ccacgaaggattttctgattga 61.33 GRAS17
(Scaffold_7) XM_002310190 PtGRAS17-F cttaaaaatccctctctctctctcc 59.46 118 PtGRAS17-R tctccagccaaccttcttactt 59.41
GRAS16 XM_002327770 PtGRAS16-F actatttctttagacccaacgacgac 62.25 66
(Scaffold_5) PtGRAS16-R atcgcctccacaacagcc 62.10
β-Actin XM_024591321 PtActin_F ggatattcagccccttgtctg 60.90 141
PtActin_R ttctgccccattccaacc 61.00
All gene expression analyses were carried out using an Abi Prism 7900 qPCR machine (Applied Biosystems, Waltham, MA, USA). Dye-based qPCR analyses were performed using SYBR Green JumpStart™ Taq ReadyMix™ (Merck Millipore, Burlington, MA, USA).
All qPCRs were performed using 12.5µL SYBR Green JumpStart™ Taq ReadyMix™ (Merck Millipore, Burlington, MA, USA), a pair of primers for each candidate gene (0.2µM each) and 10µL of 1:20 diluted cDNA in a final volume of 25µL. The qPCR protocol was as follows: 95◦C for 10 min and 40 cycles of 95◦C for 15 s, followed by 60◦C for 1 min.
The technical replicates for qPCR were in triplets per each sample. The β-Actingene (XM_024591321) was used as the most reliable internal control to quantify the relative transcript level of each candidate gene in each sample. The relative expression level of target genes was calculated with the 2−∆∆Ctmethod [61].
2.4.2. Stress-Related Candidate Genes
After bioinformatics data mining, five stress-related candidate genes were selected:
PtP5SC1(PtP5CS2): delta-1-pyrroline-5-carboxylate synthetase (P. trichocarpa),PtSOS1:
sodium proton exchanger (P. trichocarpa),PtDREB2: dehydration, cold and high-salt stress protein (P. trichocarpa),PtGRAS17: GRAS family transcription factor (P. trichocarpa),Pt- GRAS16: GRAS family transcription factor (P. trichocarpa). List of stress-inducible candidate genes, accession numbers and corresponding primer sequences were shown in Table2.
2.4.3. Gene Expression Data Analyses
Using the Arabidopsis Information Resource (TAIR) and National Center for Biotech- nological Information (NCBI) database, candidate genes were selected to test their relative expression in stress-exposed poplar tissue. Candidate genes,PtP5CS1,PtSOS1,PtDREB2, PtGRAS16,PtGRAS17, activated in response to various abiotic stresses, including salt stress, were selected. A protein–protein BLAST search against thePopulus trichocarpagenome using theArabidopsis thalianasequences was performed and related primer sequences were synthesized. After expression analysis by the qPCR method, samples were analyzed. Data analyses determined the relative expression pattern, a certain time after treatment. The relative expression level was calculated by normalizing the PCR threshold cycle number of each gene with that of theβ-Actinreference gene. Expression pattern graphs were done in the Rggplot package (R, 2013) [62].
3. Results and Discussion 3.1. Biochemical Analyses
The results obtained from the biochemical investigation of the salt stress effect on four black poplar clones (B229, 182/81, M1-M1 and PE19/66) are presented in Figures1–6 and in Tables S1–S4 (Supplementary File). Figures represent the dynamic response of
Forests2021,12, 636 8 of 21
each clone 3, 8, 12 and 24 h after treatment with 150, 300 and 450 mM NaCl. Each parameter was expressed as the specific tolerance index (TI) [9]. Data on total phenolic content tolerance index—TPCTI—are presented in Figure1. Figures1–6represents results regarding polyphenol parameters (total phenolic content, total flavonoid content and flavonoid/phenolic ratio), antioxidant capacity (DPPH radical-scavenging activity) and indicators of osmotic stress (proline content and glycine betaine content).
Forests 2021, 12, x FOR PEER REVIEW 8 of 21
PtGRAS16: GRAS family transcription factor (P. trichocarpa). List of stress-inducible can- didate genes, accession numbers and corresponding primer sequences were shown in Ta- ble 2.
2.4.3. Gene Expression Data Analyses
Using the Arabidopsis Information Resource (TAIR) and National Center for Biotech- nological Information (NCBI) database, candidate genes were selected to test their relative expression in stress-exposed poplar tissue. Candidate genes, PtP5CS1, PtSOS1, PtDREB2, PtGRAS16, PtGRAS17, activated in response to various abiotic stresses, including salt stress, were selected. A protein–protein BLAST search against the Populus trichocarpa ge- nome using the Arabidopsis thaliana sequences was performed and related primer se- quences were synthesized. After expression analysis by the qPCR method, samples were analyzed. Data analyses determined the relative expression pattern, a certain time after treatment. The relative expression level was calculated by normalizing the PCR threshold cycle number of each gene with that of the β-Actin reference gene. Expression pattern graphs were done in the Rggplot package (R, 2013) [62].
3. Results and Discussion 3.1. Biochemical Analyses
The results obtained from the biochemical investigation of the salt stress effect on four black poplar clones (B229, 182/81, M1-M1 and PE19/66) are presented in Figures 1–6 and in Tables S1–S4 (Supplementary file). Figures represent the dynamic response of each clone 3, 8, 12 and 24 h after treatment with 150, 300 and 450 mM NaCl. Each parameter was expressed as the specific tolerance index (TI) [9]. Data on total phenolic content toler- ance index—TPCTI—are presented in Figure 1. Figures 1–6 represents results regarding polyphenol parameters (total phenolic content, total flavonoid content and flavonoid/phe- nolic ratio), antioxidant capacity (DPPH radical-scavenging activity) and indicators of os- motic stress (proline content and glycine betaine content).
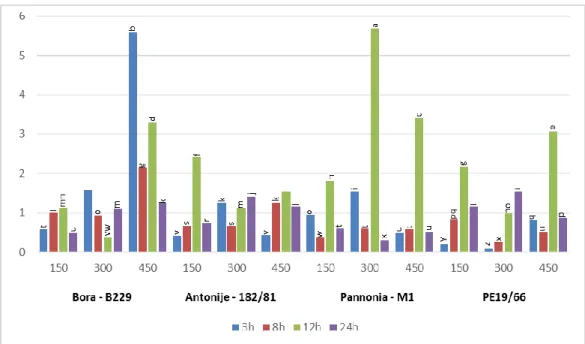
Figure 1. Tukey HSD test (CI0.05 = 0.219) for total phenolic content tolerance index (TPCTI) in poplar clones (Bora-B229, Antonije-182/81, Pannonia-M1 and PE19/66) 3, 8, 12 and 24 h after treatment with 150, 300 and 450 mM NaCl. Treatments that have the same letter belong to the same homogenous group at the level of α = 0.05 (the same letter stands for the treatments that are not statistically sig- nificant). These tests were performed in STATISTICA 13 software [60].
Figure 1.Tukey HSD test (CI0.05= 0.219) for total phenolic content tolerance index (TPCTI) in poplar clones (Bora-B229, Antonije-182/81, Pannonia-M1 and PE19/66) 3, 8, 12 and 24 h after treatment with 150, 300 and 450 mM NaCl. Treatments that have the same letter belong to the same homogenous group at the level ofα= 0.05 (the same letter stands for the treatments that are not statistically significant). These tests were performed in STATISTICA 13 software [60].
Forests 2021, 12, x FOR PEER REVIEW 9 of 21
Figure 2. Tukey HSD test (CI0.05 = 0.201) for total flavonoid content tolerance index (TFCTI) in poplar clones (Bora-B229, Antonije-182/81, Pannonia-M1 and PE19/66) 3, 8, 12 and 24 h after treatment with 150, 300 and 450 mM NaCl. Treatments that have the same letter belong to the same homogenous group at the level of α = 0.05 (the same letter stands for the treatments that are not statistically sig- nificant). These tests were performed in STATISTICA 13 software [60].
Figure 3. Tukey HSD test (CI0.05 = 0.350) for the flavonoid/phenolic ratio tolerance index (FPRTI) in poplar clones (Bora-B229, Antonije-182/81, Pannonia-M1 and PE19/66) 3, 8, 12 and 24 h after treat- ment with 150, 300 and 450 mM NaCl. Treatments that have the same letter belong to the same homogenous group at the level of α = 0.05 (the same letter stands for the treatments that are not statistically significant). These tests were performed in STATISTICA 13 software [60].
Figure 2.Tukey HSD test (CI0.05= 0.201) for total flavonoid content tolerance index (TFCTI) in poplar clones (Bora-B229, Antonije-182/81, Pannonia-M1 and PE19/66) 3, 8, 12 and 24 h after treatment with 150, 300 and 450 mM NaCl. Treatments that have the same letter belong to the same homogenous group at the level ofα= 0.05 (the same letter stands for the treatments that are not statistically significant). These tests were performed in STATISTICA 13 software [60].
Forests2021,12, 636 9 of 21
Forests 2021, 12, x FOR PEER REVIEW 9 of 21
Figure 2. Tukey HSD test (CI0.05 = 0.201) for total flavonoid content tolerance index (TFCTI) in poplar clones (Bora-B229, Antonije-182/81, Pannonia-M1 and PE19/66) 3, 8, 12 and 24 h after treatment with 150, 300 and 450 mM NaCl. Treatments that have the same letter belong to the same homogenous group at the level of α = 0.05 (the same letter stands for the treatments that are not statistically sig- nificant). These tests were performed in STATISTICA 13 software [60].
Figure 3. Tukey HSD test (CI0.05 = 0.350) for the flavonoid/phenolic ratio tolerance index (FPRTI) in poplar clones (Bora-B229, Antonije-182/81, Pannonia-M1 and PE19/66) 3, 8, 12 and 24 h after treat- ment with 150, 300 and 450 mM NaCl. Treatments that have the same letter belong to the same homogenous group at the level of α = 0.05 (the same letter stands for the treatments that are not statistically significant). These tests were performed in STATISTICA 13 software [60].
Figure 3.Tukey HSD test (CI0.05= 0.350) for the flavonoid/phenolic ratio tolerance index (FPRTI) in poplar clones (Bora- B229, Antonije-182/81, Pannonia-M1 and PE19/66) 3, 8, 12 and 24 h after treatment with 150, 300 and 450 mM NaCl.
Treatments that have the same letter belong to the same homogenous group at the level ofα= 0.05 (the same letter stands for the treatments that are not statistically significant). These tests were performed in STATISTICA 13 software [60].
Forests 2021, 12, x FOR PEER REVIEW 10 of 21
Figure 4. Tukey HSD test (CI0.05 = 0.217) for DPPH-scavenging activity tolerance index (DPPHTI) in poplar clones (Bora-B229, Antonije-182/81, Pannonia-M1 and PE19/66) 3, 8, 12 and 24 h after treat- ment with 150, 300 and 450 mM NaCl. Treatments that have the same letter belong to the same homogenous group at the level of α = 0.05 (the same letter stands for the treatments that are not statistically significant). These tests were performed in STATISTICA 13 software [60].
Figure 5. Tukey HSD test (CI0.05 = 0.051) for proline content tolerance index (PCTI) in poplar clones (Bora-B229, Antonije-182/81, Pannonia-M1 and PE19/66) 3, 8, 12 and 24 h after treatment with 150, 300 and 450 mM NaCl. Treatments that have the same letter belong to the same homogenous group at the level of α = 0.05 (the same letter stands for the treatments that are not statistically significant).
These tests were performed in STATISTICA 13 software [60].
Figure 4.Tukey HSD test (CI0.05= 0.217) for DPPH-scavenging activity tolerance index (DPPHTI) in poplar clones (Bora- B229, Antonije-182/81, Pannonia-M1 and PE19/66) 3, 8, 12 and 24 h after treatment with 150, 300 and 450 mM NaCl.
Treatments that have the same letter belong to the same homogenous group at the level ofα= 0.05 (the same letter stands for the treatments that are not statistically significant). These tests were performed in STATISTICA 13 software [60].
Forests2021,12, 636 10 of 21
Forests 2021, 12, x FOR PEER REVIEW 10 of 21
Figure 4. Tukey HSD test (CI0.05 = 0.217) for DPPH-scavenging activity tolerance index (DPPHTI) in poplar clones (Bora-B229, Antonije-182/81, Pannonia-M1 and PE19/66) 3, 8, 12 and 24 h after treat- ment with 150, 300 and 450 mM NaCl. Treatments that have the same letter belong to the same homogenous group at the level of α = 0.05 (the same letter stands for the treatments that are not statistically significant). These tests were performed in STATISTICA 13 software [60].
Figure 5. Tukey HSD test (CI0.05 = 0.051) for proline content tolerance index (PCTI) in poplar clones (Bora-B229, Antonije-182/81, Pannonia-M1 and PE19/66) 3, 8, 12 and 24 h after treatment with 150, 300 and 450 mM NaCl. Treatments that have the same letter belong to the same homogenous group at the level of α = 0.05 (the same letter stands for the treatments that are not statistically significant).
These tests were performed in STATISTICA 13 software [60].
Figure 5.Tukey HSD test (CI0.05= 0.051) for proline content tolerance index (PCTI) in poplar clones (Bora-B229, Antonije- 182/81, Pannonia-M1 and PE19/66) 3, 8, 12 and 24 h after treatment with 150, 300 and 450 mM NaCl. Treatments that have the same letter belong to the same homogenous group at the level ofα= 0.05 (the same letter stands for the treatments that are not statistically significant). These tests were performed in STATISTICA 13 software [60].
Forests 2021, 12, x FOR PEER REVIEW 11 of 21
Figure 6. Tukey HSD test (CI0.05 = 0.004) for the glycine betaine content tolerance index (GBCTI) in poplar clones (Bora-B229, Antonije-182/81, Pannonia-M1 and PE19/66) 3, 8, 12 and 24 h after treat- ment with 150, 300 and 450 mM NaCl. Treatments that have the same letter belong to the same homogenous group at the level of α = 0.05 (the same letter stands for the treatments that are not statistically significant). These tests were performed in STATISTICA 13 software [60].
The maximum of the total phenolic content tolerance index (TPCTI) was observed 8 h after the treatment was set (at all concentrations), especially in treatment with the high- est concentration of salt (450 mM) in clones PE19/66 and B229. This was also observed in clones 182/81 at 300 and 450 mM and M1 at 150 and 300 mM. That parameter usually increased with the concentration in all investigated poplar clones, except for M1 where TPCTI 8 h after the treatment declined with increasing salt concentration. Twelve hours after the experiment was set, significant decrease in TPCTI was usually observed. It was followed by none significantly different or rarely higher values observed at 24 h after the treatment, except in M1 in treatments with 450 mM NaCl. The lowest TPCTI was observed three hours after the treatment with 450 mM in poplar clone 182/81, which was followed by the highest observed TPCTI (1.884) after 8 h at 450 mM NaCl. By a general comparison of all the results, it can be concluded that in all clones except M1, there was a spike of TPCTI at 8 h after the treatment, which rises with the increase in salt concentration.
Many authors have found that excessive salinity increased plant phenolic levels [10–
12]. The increase in total phenolics content can be related to the increased expression of the gene for the enzyme L-phenylalanine ammonia-lyase responsible for the biosynthesis of phenolic acids [13]. Investigation of the response of two poplar hybrid clones to the high-salt stress showed that they differ in phenolic and antioxidant levels [14] which is in accordance with our findings, especially in the case of clone M1.
The results obtained by total flavonoid content measurements are expressed as total flavonoids content tolerance index (TFCTI) and flavonoids/phenolics ratio (FPRTI) are presented in Figure 2 and Figure 3, respectively.
The highest response of TFCTI on treatments with salt concentrations of 150 and 300 mM was observed eight hours after the treatment in all clones. Clone B229 had the highest TFCTI at 150 mM and 300 mM NaCl. At the same time, clone PE19/66 had a slightly weaker reaction with the TFCTI of cca 1.97 at 150 and 300 mM NaCl, followed by clones 182/81 and M1. A significant decrease of total flavonoids was observed 12 h after treat- ment with concentrations of 150 and 300 mM NaCl in all clones when compared to the situation at 8 h after treatment, but at 450 mM NaCl, the response of the clones, compared to response level at 8 h post treatment, differed. In B229, TFCTI declined, in clone 182/81
Figure 6.Tukey HSD test (CI0.05= 0.004) for the glycine betaine content tolerance index (GBCTI) in poplar clones (Bora-B229, Antonije-182/81, Pannonia-M1 and PE19/66) 3, 8, 12 and 24 h after treatment with 150, 300 and 450 mM NaCl. Treatments that have the same letter belong to the same homogenous group at the level ofα= 0.05 (the same letter stands for the treatments that are not statistically significant). These tests were performed in STATISTICA 13 software [60].
Forests2021,12, 636 11 of 21
The maximum of the total phenolic content tolerance index (TPCTI) was observed 8 h after the treatment was set (at all concentrations), especially in treatment with the highest concentration of salt (450 mM) in clones PE19/66 and B229. This was also observed in clones 182/81 at 300 and 450 mM and M1 at 150 and 300 mM. That parameter usually increased with the concentration in all investigated poplar clones, except for M1 where TPCTI 8 h after the treatment declined with increasing salt concentration. Twelve hours after the experiment was set, significant decrease in TPCTI was usually observed. It was followed by none significantly different or rarely higher values observed at 24 h after the treatment, except in M1 in treatments with 450 mM NaCl. The lowest TPCTI was observed three hours after the treatment with 450 mM in poplar clone 182/81, which was followed by the highest observed TPCTI (1.884) after 8 h at 450 mM NaCl. By a general comparison of all the results, it can be concluded that in all clones except M1, there was a spike of TPCTI at 8 h after the treatment, which rises with the increase in salt concentration.
Many authors have found that excessive salinity increased plant phenolic levels [10–12].
The increase in total phenolics content can be related to the increased expression of the gene for the enzyme L-phenylalanine ammonia-lyase responsible for the biosynthesis of phenolic acids [13]. Investigation of the response of two poplar hybrid clones to the high-salt stress showed that they differ in phenolic and antioxidant levels [14] which is in accordance with our findings, especially in the case of clone M1.
The results obtained by total flavonoid content measurements are expressed as total flavonoids content tolerance index (TFCTI) and flavonoids/phenolics ratio (FPRTI) are presented in Figures2and3, respectively.
The highest response of TFCTI on treatments with salt concentrations of 150 and 300 mM was observed eight hours after the treatment in all clones. Clone B229 had the highest TFCTI at 150 mM and 300 mM NaCl. At the same time, clone PE19/66 had a slightly weaker reaction with the TFCTI of cca 1.97 at 150 and 300 mM NaCl, followed by clones 182/81 and M1. A significant decrease of total flavonoids was observed 12 h after treatment with concentrations of 150 and 300 mM NaCl in all clones when compared to the situation at 8 h after treatment, but at 450 mM NaCl, the response of the clones, compared to response level at 8 h post treatment, differed. In B229, TFCTI declined, in clone 182/81 it increased, while a significant decline was noticed at 8 h post treatment, and in clones M1 and PE19/66 the difference between TFCTI at 8 and 12 h was not significant.
The ratio between total flavonoids and total phenolics can be interpreted as a con- tribution of flavonoid to the total phenol content, and the tolerance index based on this parameter (FPRTI) can also be a valuable indicator of differences between genotypes in their reaction to abiotic stresses [63]. All the results presented in Figure3were obtained by comparing them to the control value normalized to 1 (100%). In clone B229, the FPRTI value increased compared to the control value at 150 mM NaCl by 170% after 8 h and by 90% after 12 h. At 300 mM NaCl, the same index increased from 97% after 8 h to 124% after 12 h. In clone 182/81, the FPRTI value dramatically increased (242%) 3 h after treatment at 450 mM NaCl compared to the control. The initial increase was followed by a significant decrease in FPRTI value (89%) compared to the control. Although the accumulation of flavonoids under the influence of the stress occurred in all clones, in clones B229 and 182/81, the flavonoid/total phenol ratio tolerance index was higher than the other two examined clones.
Polyphenols are secondary metabolites, which are not primarily connected to the processes of growth and development but are of vital importance for their ecological interactions and their role in defense mechanisms, modulating transcriptional regulation, signal transduction and hormonal regulation [15]. According to Xu et al. [16], salt stress can elicit intensive gene expression changes which affect physiological and molecular pathways, including the synthesis of flavonoids. Flavonoids are a major class of polyphenols, which play important roles in eliminating free radicals and preventing oxidation [15]. Our observation that, in some poplar genotypes, the flavonoid/total phenol ratio can increase is in accordance with published results that, despite the decrease in total phenol content in
Forests2021,12, 636 12 of 21
he investigated poplar genotypes, flavonoids content can be affected by stress [15]. These observations could be explained by the essential role of flavonoids among other phenolics in physiological regulation and response to stress. Vuksanovi´c et al. [63] stressed that a high flavonoids/phenolics ratio was associated with low-intensity stress and with genotypes tolerant to acidification, while at high-intensity stress and in genotypes with low tolerance to acidification, this ratio declined due to a higher content of total phenolics and lower content of flavonoids. In that sense, the higher FPRTI observed in our study for clones B229 and 182/81 indicates their higher tolerance to salt stress than in M1 and PE 19/66.
Total antioxidant capacity was measured by determination of DPPH radical-scavenging activity. The results were presented by the analog tolerance index (DPPHTI) in Figure4.
The highest DPPHTI was observed 8 h after the experiment set under all applied concentrations in all clones, except for PE19/66 which had its peaks already in 3 h, espe- cially at 450 mM NaCl. The highest DPPHTI was detected in clone B229, which achieved 255% (150 mM, 8 h), 80.5% (300 mM, 8 h) and 193% (450 mM, 8 h) higher DPPH radical- scavenging activity than the analog control treatment. High initial induction (after 3 h) of DPPH radical scavengers was observed also in clone PE19/66 (182% higher than con- trol) after the treatment with the highest salt concentration (450 mM NaCl). Considering obtained results, it can be concluded that the greatest initial antioxidant response to salt stress, according to the DPPH method, was found in genotype B229.
Diverse environmental stress factors, including salt stress, can lead to an imbalance between antioxidant defenses and the number of reactive oxygen species (ROS) causing oxidative stress [28,34]. The scavenging of reactive oxygen species (ROS) is one of the possi- ble mechanisms of plants action against oxidative stress provoked by salt stress. The DPPH method is based on the scavenging action toward artificial 2,2-diphenyl-1-picrylhydrazyl (DPPH) [64]. A positive correlation between total phenols and DPPH radical-scavenging capacity has also been found both in the salt-stressed and control poplar plants [14] and generally in plant tissue [64]. Generally, the increase in antioxidant activity is a well- established mechanism for the stress response in plants [15,63]. However, Štajner et al. [64]
suggest that an intense increase of DPPH-scavenging capacity, as well as a strong increase of total phenolic content, was not characteristic for tolerant genotypes. Instead, moderate increase of these parameters, and moderate decrease of total flavonoids and, especially, the ratio between total flavonoids and total phenolics is characteristics of tolerant genotypes.
In that sense, high DPPHTI at 450 mM NaCl 24 h after the treatment suggests that genotype PE19/66 is less tolerable to high-salt stress than the other three examined clones. Results concerning proline and glycine betaine accumulation were expressed by tolerance indices based on proline content and glycine betaine content (Figures5and6).
As presented in Figure 5, the highest proline content tolerance index (PCTI) was observed mostly after 12 h in all four clones by specific salt concentrations. The most intense peaks after 12 h were observed for clone B229 at 450 mM NaCl (230%), clone M1 at 300 mM NaCl (469%) and at 450 mM NaCl (242%) and clone PE19/66 at 450 mM NaCl (206%), while clone B229 showed a high peek at 450 mM NaCl 3 h after treatment. At 24 h, a decrease in the proline content tolerance index was observed with few exceptions. Concerning the overall results for proline, clones B229 and M1 seem to achieve the strongest response to salt stress, while M1 and PE 19/66 showed the lowest PCTI 24 h after the treatment.
Forests2021,12, 636 13 of 21
The response of the other osmolyte, glycine betaine, depended on the salt concen- tration as well as clone and duration of the treatment. It was not possible to determine any general trend. It was observed that clone B229 showed the highest initial response by the glycine betaine content tolerance index (GBCTI) after 3 h, especially under 450 mM (187%), while in M1, the highest GBCTI were recorded after 12 h, especially at 450 mM NaCl (86.5%). The maximal response of clone 182/81 was after 24 h, especially under 300 mM (146%), but at 450 mM NaCl the maximum was after 3 h, while in clone PE19/66, GBCTI exceeded 1 only at 300 mM NaCl 8 h after treatment.
One of the most important strategies to enhance plant tolerance to osmotic stress, including water and salt stress, is the accumulation of osmotically active substances. Many studies have shown that the proline content in higher plants increases under different environmental stresses including drought, high salinity, UV irradiation, heavy metals, oxidative stress and in response to biotic stresses [37]. Proline has a complex effect on stress responses, including cell membrane protection from oxidative stress, by enhancing antioxidant activity, reducing H2O2levels and facilitating growth [63]. It has been found that hybrid black poplar subjected to osmotic stress, enhances the accumulation of glycine betaine and proline as the most important strategy to resist the osmotic stress and overcome water deficit [63]. The effect of salt stress on ion concentration, proline content, antioxidant enzyme activities and gene expression has been studied in tomato cultivars as well [33]. It was revealed that plant tissue dynamically responds to the salt stress and that the proline concentration had peaks after certain time intervals (6 h and seven days) for the genotype that was more tolerant to the salt stress. Investigation of the role of glycine betaine in enhanced salinity tolerance in some plants pointed to its possible role in the maintenance of K+homeostasis, reduction of lipid peroxidation and an increase in SOD activity, a key enzyme of the reactive oxygen species-scavenging system [65].
3.2. Comparative Genomic Studies
To facilitate the identification of stress-related candidate genes for expression stud- ies and future poplar clone improvement, we queried the previously published protein sequences that show homology withP. trichocarpastress-related genesPtP5CS1(PtP5CS2):
delta-1-pyrroline-5-carboxylate synthetase,PtSOS1: sodium proton exchanger,PtDREB2:
dehydration, cold and high-salt stress protein,PtGRAS17andPtGRAS16: GRAS family transcription factor. The phylogenetic tree differentiated four distinct clades where our protein sequences showed high evolutionary relatedness with the proteins of Populus euphratica, which is a model plant species for salt stress studies and is of great importance for large-scale afforestation on saline desert sites (Figure7).
Forests2021,12, 636 14 of 21
Forests 2021, 12, x FOR PEER REVIEW 14 of 21
Figure 7. Phylogenetic analyses of protein sequences encoded by four stress-related genes of P.
trichocarpa. The evolutionary history was inferred using the Neighbour-Joining method [66,67].
The optimal tree with the sum of branch length = 6.68 is shown. The tree is drawn to scale, with branch lengths in the same units as those of the evolutionary distances used to infer the phyloge- netic tree. The evolutionary distances were computed using the Poisson correction method [68]
and are in the units of the number of amino acid substitutions per site. The analysis involved 46 amino acid sequences. All ambiguous positions were removed for each sequence pair. There were a total of 1153 positions in the final dataset. Analyses were conducted in MEGA5 [69].
3.3. Differential Expression Pattern of Salt Stress-Related Candidate Genes 3.3.1. Salt Stress Responses of PtP5CS1
The expression pattern of the PtP5CS1 gene shows that the highest induction of this gene occurred in clone PE19/66 where the most transcript abundance was noticed at 300 mM NaCl after 3 h of exposure. This clone responded in a gradual expression rate, in comparison to control, in a low concentration of salt (150 mM) in early phases (3 and 8 h).
The same patterns were recorded at 450 mM NaCl after 3 and 8 h. Relative expression was fivefold higher when this clone was exposed to 300 mM NaCl after 3 h of stress exposure in comparison to the M1 clone. It is interesting that clone PE19/66 after 24 h of exposure to all stressor concentrations holds the similar relative expression level.
Figure 7. Phylogenetic analyses of protein sequences encoded by four stress-related genes ofP.
trichocarpa. The evolutionary history was inferred using the Neighbour-Joining method [66,67]. The optimal tree with the sum of branch length = 6.68 is shown. The tree is drawn to scale, with branch lengths in the same units as those of the evolutionary distances used to infer the phylogenetic tree.
The evolutionary distances were computed using the Poisson correction method [68] and are in the units of the number of amino acid substitutions per site. The analysis involved 46 amino acid sequences. All ambiguous positions were removed for each sequence pair. There were a total of 1153 positions in the final dataset. Analyses were conducted in MEGA5 [69].
3.3. Differential Expression Pattern of Salt Stress-Related Candidate Genes 3.3.1. Salt Stress Responses ofPtP5CS1
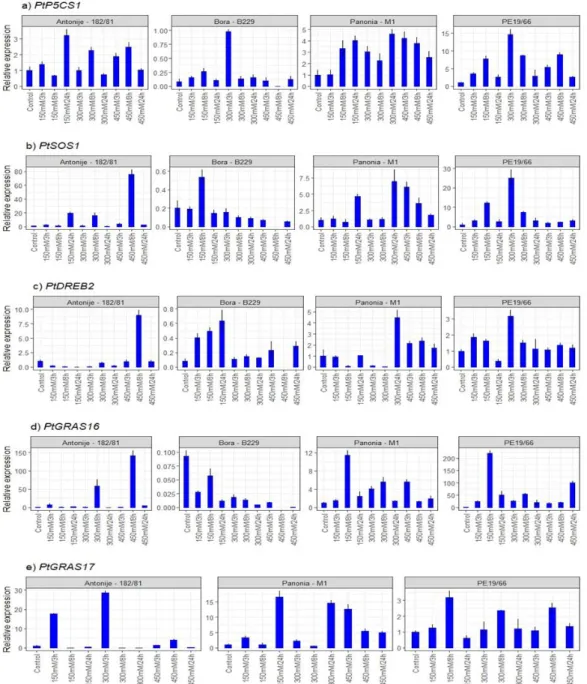
The expression pattern of thePtP5CS1gene shows that the highest induction of this gene occurred in clone PE19/66 where the most transcript abundance was noticed at 300 mM NaCl after 3 h of exposure. This clone responded in a gradual expression rate, in comparison to control, in a low concentration of salt (150 mM) in early phases (3 and 8 h).
The same patterns were recorded at 450 mM NaCl after 3 and 8 h. Relative expression was fivefold higher when this clone was exposed to 300 mM NaCl after 3 h of stress exposure in comparison to the M1 clone. It is interesting that clone PE19/66 after 24 h of exposure to all stressor concentrations holds the similar relative expression level.
Clone M1 and 182/81 shared similar expression values, however, clone 182/81 showed a lower induction while M1 recorded a somewhat higher and steady induction throughout the experiment. The weakest induction was noticed in the clone B229 where thePtP5CS1 transcript level was almost equal toβ-Actinexpression (Figure8and Table S5 in Supple-
Forests2021,12, 636 15 of 21
mentary File). According to Fabro et al. [32], drought and salt stress differentially activate the expression of two P5CS-related genes in Arabidopsis thaliana,AtP5CS1andAtP5CS2, whereAtP5CS1 is activated by an ABA-dependent signal transduction pathway. Our results support the findings of those authors where the highest induction of thePtP5CS1 gene was found in clone PE19/66 that was already confirmed for the same clone for the PtRD29Bgene that was activated by an ABA-dependent pathway [70].
The expression pattern ofPtP5CS1is supported with the biochemical data where the accumulation of proline in PE19/66 reveals a similar pattern. These findings suggest that thePtP5CS1gene is involved in proline accumulation during salt stress which was a confirmation of what was expected during the experiment. From examination of all gathered data, it could be concluded that the clone PE19/66 has different mechanisms expressing thePtP5CS1gene during salt stress through the ABA-dependent signaling pathway compared to 182/81 and M1 clones.
Forests 2021, 12, x FOR PEER REVIEW 15 of 21
Clone M1 and 182/81 shared similar expression values, however, clone 182/81 showed a lower induction while M1 recorded a somewhat higher and steady induction throughout the experiment. The weakest induction was noticed in the clone B229 where the PtP5CS1 transcript level was almost equal to β-Actin expression (Figure 8 and Table S5 in supple- mentary file). According to Fabro et al. [32], drought and salt stress differentially activate the expression of two P5CS-related genes in Arabidopsis thaliana, AtP5CS1 and AtP5CS2, where AtP5CS1 is activated by an ABA-dependent signal transduction pathway. Our results support the findings of those authors where the highest induction of the PtP5CS1 gene was found in clone PE19/66 that was already confirmed for the same clone for the PtRD29B gene that was activated by an ABA-dependent pathway [70].
Figure 8. Two-step RT-qPCR results. Differential expression profiles of PtP5CS1, PtSOS1,
PtGRAS16, PtGRAS17, PtDREB2 genes induced by salt (NaCl) treatment at various concentrations (150 mM, 300 mM and 450 mM) and differing treatment durations (3 h, 8 h, 24 h).
Figure 8.Two-step RT-qPCR results. Differential expression profiles ofPtP5CS1,PtSOS1,PtGRAS16,PtGRAS17,PtDREB2 genes induced by salt (NaCl) treatment at various concentrations (150 mM, 300 mM and 450 mM) and differing treatment durations (3 h, 8 h, 24 h).
Forests2021,12, 636 16 of 21
3.3.2. Salt Responses of PtSOS1
This transporter gene is associated with cellular sodium homeostasis by transporting sodium ions out of the cell. Clone B229 showed the weakest expression. In the M1 clone, thePtSOS1gene showed a late increase (24 h) in expression at 150 mM and 300 mM and a gradual decrease at 450 mM. Clones 182/81 and PE19/66 showed abundant transcript am- plification at higher salt concentrations (450 mM and 300 mM) after 8 h and 3 h, respectively.
Clone PE19/66 showed a gradual increase in early expression (150 mM after 3 and 8 h) and almost no transcript amplification in high salt concentration at all time points (450 mM in 3, 8 and 24 h). Steady state of theSOS1transcript levels increase significantly in roots and to a much lesser extent in shoots when seedlings are exposed to high levels of NaCl [44]. This finding is supported by the same authors where they stated that this regulation by salt is mediated, at least in part, by the other identified components of the SOS pathway, SOS3 (a calcineurin B-like calcium-binding protein) and SOS2 (a serine/threonine protein kinase).
Even though thePtSOS1gene expression pattern differed between all clones, clone M1 showed the highest expression with in more saturated stressor at 300 mM and 450 mM after 3, 8 and 24 h, while clone PE19/66 reacted earlier and expressed this gene at a low salt concentration. The latest studies revealed thatAtSOS1is maybe involved in long-distance transport of Na+from the roots to the shoots and mediates absorption and transport of other ions (K+, Ca2+and H+), maintaining pH homeostasis in plants [71,72]. Regarding these findings we can assume that clone PE19/66 by higher induction of this gene in the leaf tissue has the possibility to make faster uptake of the salt while clone M1 responded slower and at heavier stress conditions. These give us a choice in recommendation of these two clones for phytoremediation of devastated soils and afforestation of holomorphic environment.
3.3.3. Salt Responses of PtDREB2
In three out of four clones, higher salt concentrations (300 mM and 450 mM) induced this regulatory gene with low transcript abundance. In clones M1 and PE19/66 were detected induction of the gene expression at 300 mM 24 h after exposure was detected, however, it was threefold lower than that observed in the 182/81 clone at 450 mM 8 h after exposure. Clone B229 reacted in the opposite manner in comparison to other clones, showing the lowest activation of thePtDREB2gene with a gradual increase in its transcript level at the lower concentration of the stressor agent (150 mM at 3, 8 and 24 h).
The manner of ABA-independent regulation manner of DREB genes in general and the results of higher salt stress induction of the DREB1 gene are supported by [53]. ABA- independent signaling systems have been described as pathways that mediate adaptation to stress by the activation of the CBF/DREB (cold-binding factor/dehydration-responsive element binding) regulon [73]. The most recent study [74] supports crosstalk between ABA- dependent and ABA-independent pathways in the regulation of gene expression under salt stress. From that point of view, both clones, M1 and PE19/66, had the most prominent induction level eventhough it was concluded earlier about their ABA-dependent way of salt stress regulation. Since clone 182/81 showed ABA-independent regulation of the PtDREB2gene in this study andPtRD17expression [70], it is not surprising that this clone showed low expression patterns in comparison to the other clones under investigation.
In order to improve salt tolerance in poplar, due to TFs specific role as master regulators of many stress-responsive genes,PtDREB2transcription factor is a good candidate for validation through generation of transgenic poplar lines.
3.3.4. Salt Responses of PtGRAS16 and PtGRAS17
By single nucleotide screening (SNPs) of these two homologues it was recently proved the genetic differences between all four clones that were used also in this study were recently proved [54]. In clone 182/81, thePtGRAS16homolog showed two peaks after 8 h at the high salt concentrations (300 mM and 450 mM, respectively) but early-expressed transcripts after 8 h and at the low salt concentration (150 mM) in PE19/66 clone. This
Forests2021,12, 636 17 of 21
clone showed a higher expression level in comparison to the 182/81 clone. There was no considerable activation of this gene in B229 clone. Differential expression analyses revealed that thePtGRAS17homolog of thePtGRASgene was not expressed in the B229 clone. Its highest activation values were noted in 182/81 at early stress stages (150 mM and 300 mM) 3 h after treatment and it was twofold higher in comparison to clone M1 where this clone expressed this homolog at 150 mM and 300 mM 24 h of after stress induction. In PE19/66, there was slight activation throughout the salt treatment.
By a comparison of the expression pattern between two homologues, clone 182/81 expressedPtGRAS17earlier (3 h after treatment at 150 mM and 300 mM) while PtGRAS16 was expressed later (8 h after treatment at 300 mM and 450 mM). Clone M1 reacted by higher induction ofPtGRAS17 at 300 mM and 450 mM while the same clone exhibit abundant amplification at 150 mM of salt stress. Additionally, it is interesting that clone PE19/66 highly expressed thePtGRAS16homologue almost 10 folds higher thanPtGRAS16.
All the above mentioned findings undoubtedly confirmed that those homologues can be used as a marker gene in the differentiation of clones in breeding programs. This finding is supported by Fladung et al. [75].
It is interesting that clone B229 revealed a low induction of polyphenols and showed low accumulation of flavonoid content as well as low transcription rate for all salt- responsive genes in all concentrations, and even lower levels at higher concentrations of the stress agent. These explanations can vary according to available literature. If there is a mutation of any of the components of the salt overly sensitive pathway (SOS), that could result in severely reduced salt tolerance [74], which is not possible since it will be noticed in the clone phenotype. The other assumption is that this genotype is behaving like halophyte species where, under salt stress, primary and secondary metabolites, including proline and sugar alcohols, function as osmolytes in halophytes and glycophytes [76], whereas in halophytes, prestress metabolite levels are significantly higher. This may ex- plain its greater capacity for osmotic stress adjustment. This behavior can be compared to halophyteP. euphraticawhere the evidence for a general activation of stress-relevant genes was not detected. Because of its low transcriptional responsiveness to salinity, it was hypothesized that this species exhibits an innate activation of the stress-protective genes in comparison to sensitive poplars [77]. The evolutionary adaptation ofP. euphraticato salt environments is linked with higher energy requirements of cellular metabolism and a loss of transcriptional regulation [77]. Therefore, we can assume that clone B229 was prone to tolerate salt environments even at high concentrations like 450 mM and could be efficient in phytoremediation of salt environments. Since the expression data for this clone are unexpectedly low for all investigated genes, it would be necessary to take additional measurements in the future work.
According to gene expression analyses, it can be assumed that clones PE19/66 and M1 clone regulate the expression of thePtP5CS1gene through the ABA-dependent pathway, while the clone 182/81 expressedPtDREB2through the ABA-independent pathway. This could be the evidence that clones have different regulation systems in gene expression and respond to salt stress differently by expressing the salt-responsive genes in different manner, which points out their genetic divergence. This knowledge could be used in breeding programs in order to improve salt tolerance by usingPtDREB2andPtGRAStranscription factor genes. They could be good candidates for screening the filial generations of stress- tolerant poplars because of their role as master regulators of many stress-responsive genes.
The most important segment of this work represents accomplishing a successful strat- egy for approaching the climate change problem by employing biochemical and functional genomic tools using RT-qPCR technology. By testing several salt stress-related gene ex- pressions, in this study, we broaden our knowledge about the genetic background and obtained the first applicable insights into the salt stress tolerance of different economically important poplar clones. Revealing their different biochemical and molecular response to the salt stress will enhance the possibility of phytoremediation therefore, the afforestation of halomorphic soils with these poplar clones in the Vojvodina region, Serbia.