Physiology International, Volume 105 (3), pp. 210–224 (2018) DOI: 10.1556/2060.105.2018.3.21
Prenatal hypoxia – ischemia decreases spatial memory and increases aggression during adolescence
R Indriawati1,2, S Aswin3, R Susilowati4, G Partadiredja1
1Faculty of Medicine, Public Health, and Nursing, Department of Physiology, Universitas Gadjah Mada, Yogyakarta, Indonesia
2Faculty of Medicine and Health Sciences, Department of Physiology, Universitas Muhammadiyah, Yogyakarta, Indonesia
3Faculty of Medicine, Public Health, and Nursing, Department of Anatomy, Universitas Gadjah Mada, Yogyakarta, Indonesia
4Faculty of Medicine, Public Health, and Nursing, Department of Histology and Cell Biology, Universitas Gadjah Mada, Yogyakarta, Indonesia
Received: June 27, 2017 Accepted: May 31, 2018
Prenatal hypoxia–ischemia (HI) is a major cause of mortality and chronic neurological diseases in newborns. HI contributes to the emergence of several neurological disorders such as cognitive and behavioral deficits due to the atypical brain development. This study aimed at assessing the effects of prenatal HI on the spatial memory and aggression of rats during adolescence. Pregnant rats were divided into treatment and control groups. The rats of the treatment groups underwent unilateral ligation of the uterine artery on pregnancy day 7, 12, or 17. The offspring of these rats were tested for spatial memory and aggression when they reached 33 days of age. It has been found that the percentages of alternations in the Y-maze and the number of crossings in the Morris water maze tests of the HI groups were lower than those of the control groups.The total offense and defense aggression scores of the HI groups were higher than those of the control groups. In conclusion, the longer the duration of HI, the more deficits it causes in the spatial memory and aggression of rats during adolescence.
Keywords:hypoxia, ischemia, prenatal, spatial memory, aggression
Introduction
Over the past three decades, there has been a growing interest on research about the prenatal environment as a critical window of fetal development as well as an important factor for the later outcomes. Epidemiological studies have explored the links between adverse prenatal conditions and increased risk for diseases, health problems, and psychological outcomes later in life (6). Prenatal hypoxia–ischemia (HI) can cause brain lesions. Brain damage resulting from HI is a major cause of mortality and chronic disability, including cognitive and behavioral disturbances (34). Chronic prenatal HI is a strong prognosis factor for the outcome of various diseases (5,12). It has been found that prenatal HI contributes to the emergence of several neurological disorders such as cognitive and behavioral deficits due to the atypical brain development (1,25,28).
Corresponding author: Ginus Partadiredja
Faculty of Medicine, Public Health, and Nursing, Department of Physiology, Universitas Gadjah Mada Jl. Farmako, Sekip Utara, Yogyakarta 55281, Indonesia
Phone: +62 274 649 492; Fax: +62 274 546 486; E-mails:gpartadiredja@ugm.ac.id;gpartadiredja@yahoo.com
HI is considered to be associated with the onset of behavioral and cognitive disorders (10,17). The effects of HI during the brain embryogenesis and development on the animal or human brain structure and on behavior in later life depend to a great extent on the period of pregnancy when the HI occurs. The HI during the embryonic period leads to various structural and functional abnormalities in the postnatal period (31). Of note, the neurogenesis in the cortex of mice is very high between embryonic days 12 and 16 (13), whereas the peak of cortical neurogenesis occurs at embryonic day 14 (27). Cell death begins to occur approximately 3 h after the induction of HI in rats. The increase in the number of apoptotic cells occurs on the 3rd embryonic day and reaches a peak 7 days later. Approximately 14–20 days after the induction, lesions in the brain tissue could be detected in the hippocampus (13). Memory disorder due to the prenatal HI may be tested using Morris water maze (MWM) procedure to assess long-term spatial memory disorders, and Y-maze to assess short-term spatial memory disorders.
Aggression can be tested using offensive and defensive aggression procedures.
Long-term effects of HI treatment during early intrauterine development are very important to be investigated. Moreover, little is known about the relationship between prenatal HI, spatial memory, and aggression. We were interested in studying the effects of prenatal HI before, during, and after the peak of neurogenesis on the spatial memory and aggression.
Materials and Methods Animals and treatment
This study included 12 confirmed 10- to 12-week-old pregnant Sprague–Dawley rats weighing 175–200 g. The rats were kept at the animal house of Integrated Research Laboratory, Universitas Gadjah Mada, under controlled conditions of 12-h light–dark cycle, with a temperature range of about 30±2 °C, and humidity of about 50%±10%. They were fed food pellets and allowed to acquire reverse osmosis water ad libitum. The animal handling and experimental procedure were approved by the Medical and Health Research Ethics Committee (MHREC), Faculty of Medicine, Universitas Gadjah Mada, Yogyakarta (approval number: KE/FK/1234/EC/2015).
The pregnant rats were grouped randomly into six groups (three treatment and three control groups), each group consisting of two rats. The rats of the treatment groups underwent unilateral ligation of the right uterine artery, which supplies one uterine horn, on pregnancy day 7, 12, or 17 (designated as HI7, HI12, and HI17groups) under deep anesthesia induced by a combination of 10 mg/kg ketamine hydrochloride (PT Guardian Pharmatama, Jakarta, Indonesia) and 15 mg/kg xylazine (PT Guardian Pharmatama) given intramuscularly. Control groups (C7, C12, and C17 groups) consisted of sham-operated rats, which underwent laparotomy without unilateral ligation of the uterine artery on the same pregnancy day as the treatment groups. Upon birth, rat pups weighing over 5.50 g at birth were excluded from the experiment (7). From each group of dams,five male pups were selected randomly and therefore there were a total of 30 rats in six groups. The offspring underwent behavioral tests later during the adolescent period.
Y-maze procedure
The rats were tested for Y-maze test when they were 42 days old. The subjects were familiarized with the test room at least 1 day prior to the test. The maze consisted of three symmetrical arms (A, B, and C), each of which had a length of 50 cm, height of 20 cm, and
width of 10 cm. Those arms were placed at 120° to each other and hence constructed a“Y” form. The test procedure was conducted according to the protocol of previous studies (8,29). In brief, rats were placed at the end part of a randomly chosen arm, and were expected to move around the maze freely. A 4-min period was given to the rat for exploring the maze.
Data about the sequence of arms entered, total arm entries, and number of alternations were recorded.“Entry to an arm”was defined as the whole entry of all four limbs of the rat into an arm.“Alternation”represents a sequence of all entries by the rat in three different arms. For example, a rat entered the three different arms (A, B, or C) at an arm entry sequence of CABACBACAB. The alternation of this sequence was CAB BAC ACB CBA BAC CAB, and the number of alternation was 6. The alternation data were used to calculate the percentage of alternations, which is defined as the ratio of the number of actual alternations to possible alternations, multiplied by 100. The number of possible alternations was defined as the total number of arm entries minus two (8,29). Therefore, the percentage of alternations was expressed as:
% alternation=number of alternation ðtotal arm entries−2Þ:
The maze was cleaned using a 70% ethanol solution prior to the test of each rat to ensure that no odor clues were left by previous rats. The testing sequences of rats in relation to the treatment category were determined randomly and the examiner of the test was blinded to the rat groups.
MWM procedure
MWM test was performed 1 day after the Y-maze test. The protocol used in this spatial memory test was that described by Bouet et al. (2) with a slight modification. The water maze procedure consisted of three phases: learning phase (hidden platform), retention phase (no platform), and visual test (visible platform). The tool consisted of a circular pool, which was divided virtually into four equal-sized quadrants. Two equally distanced starting points were marked around the inner wall of the pool of each quadrant. The tank wasfilled with water and made opaque by adding milk. A circular platform was submerged 0.5 cm below the surface of the water in the center of one randomly selected (target) quadrant. The position of the platform was kept constant for each rat throughout the experiment (2).
On the day of trials, the platform was placed in the middle of the target quadrant for each rat. The trial started by placing any given rat in the tank at a randomly selected starting point.
The rat was forced to swim in order to escape from the water and was expected to accidentally locate the platform and climb onto it. The time required by the rat from the beginning of swimming until climbing onto the platform was recorded as“escape latency.”All trials were recorded using a video camera. The length of the swimming track of the rat was measured using a curvimeter (Comcurve 10; Koizumi Sokki Mfg, Nagaoka-shi, Niigata, Japan) (14).
The rats were trained four trials a day in the learning phase for 4 days [from postnatal day (P) 43 to P46]. The data collected were escape latency (s), path length (cm), and speed (cm/s) to reach the platform. The long-term memory test (retention phase) was performed 24 h after the last learning session. The rats were placed in the tank without platform for 60 s.
The data collected were the latency, path length, number of crossings, and number of crossings to the quadrant opposite to the target quadrant. The data of the latency were
transformed into distance percentages, which were the ratio of the path length of rats in the target quadrant to the total trajectory within 60 s. Time percentage was the ratio of the latency of rats spent on the target quadrant to 60 s. The number of crossings was the frequency of rats crossing the border of the target quadrant for 60 s. The number of opposite crossings was the frequency of rats passing the quadrant border opposite to the test quadrant for 60 s. The visual test was performed 1 day after the retention phase. The test consisted of three trials with the platform protruding from the surface of the water and therefore visible to the rats. The duration of each trial of this test was 60 s.
Aggression test
The rats were tested for offensive and defensive aggression tests using Koolhaas procedure (16), starting from P33 to P40. The test was performed at night, approximately between 6 and 7 p.m. The rats were placed in cages with their female companions for 1 week before the test. The beddings of the cages were not changed prior to the test in order to maintain the olfactory cues, which signified the territoriality of the resident rats. The companion female rats were taken away from the residential cages 1 h prior to the test.“Intruder”male rats were introduced into the residential cages and left to stay for 10 min to interact with the resident rats. All behaviors of the resident rats were recorded during the 10-min period. After completion of the test, the intruder rats were removed from the cages. The companion female rats were reunited with the resident male rats in their respective home cages.
The data of offensive aggressive behavior that were recorded and examined included the duration and frequency of attack latency, direction of movement, social exploration, anogenital sniffing, rearing, lateral threat, upright posture, clinch attack, keep down, chase, non-social exploration, and rest or inactivity. The total offense score was calculated from the sum of lateral threat, upright, clinch, keep down, and chase movement scores. Social exploration score was calculated from the sum of the social exploration and anogenital sniffing scores.
The data of defensive behavior were obtained from the record of the duration and frequency of submission latency, submissive posture, move away from the resident rat,flight, defensive upright posture, freeze, non-social exploration, and rearing. The total defense score was calculated from the sum of the amount of time spent onflight, defensive upright posture, submission, and freezing movements.
Statistical analyses
All behavioral tests data were analyzed by one-way analysis of variance (ANOVA) procedure, followed by Tukey’spost hoctest where appropriate. The birth weight data of rats were not normally distributed and not homogeneous and therefore were analyzed using Kruskal–Wallis test, followed by Mann–Whitney’spost hoctest. The spatial memory test data were analyzed by one-way ANOVA procedure, followed by Tukey’spost hoctest where appropriate, except for the learning phase data. The learning phase data were analyzed using general linear model repeated measures (GLM RM) procedure. All statistical analyses were conducted using SPSS software version 19.0 (SPSS Inc., Chicago, IL, USA).
Results Body weights
The data of body weights of pups upon birth, which were calculated using Kruskal–Wallis test, revealed a significant main effect of groups (TableI). Mann–Whitney’spost hoctest
showed that the birth weights of pups of the HI7, HI12, and HI17groups were lower than those of the C7, C12, and C17groups, respectively (p=0.002).
Y-maze test
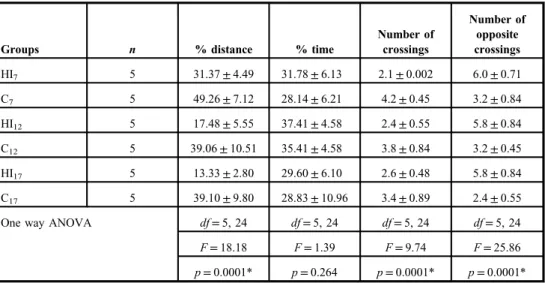
The number of alternations, total arm entries, and percentages of alternations during the Y- maze test are shown in Table II. One-way ANOVA procedure of these data showed a significant main effect of groups in the number and percentage of alternation. The Tukey’s post hoc test revealed that the percentages of alternation, which indicate a spatial memory capability (8,29), of HI7, HI12, and HI17groups were lower than those of the corresponding
Table I.Mean±SD (g) of the birth weights of rats
Groups n Mean±SD p
HI7 5 4.48±0.31 0.002*
C7 5 6.32±0.19
HI12 5 4.92±0.83
C12 5 6.64±0.37
HI17 5 4.84±0.36
C17 5 6.46±0.29
Data are calculated by Kruskal–Wallis test. SD: standard deviation; HI7, HI12, HI17: rat groups with prenatal hypoxia–ischemia on the 7th, 12th, and 17th days of gestational age, respectively; C7, C12, and C17: sham-operated controls on the 7th, 12th, and 17th days of gestational age, respectively.
*p<0.05
Table II.Mean±SD of the number of alternations, total arms entries, and percentage of alternations in Y-maze test
Groups n
Number of
alternations Total arms entries
Percentage of alternations
HI7 5 1.60±0.55 9.83±3.80 9.83±3.80
C7 5 2.80±1.79 12.80±7.01 26.88±3.87
HI12 5 1.60±0.55 13.60±3.65 12.82±12.82
C12 5 2.60±1.82 13.20±9.52 28.27±6.57
HI17 5 2.80±1.31 13.20±9.52 19.11±2.93
C17 5 4.20±0.84 16.20±2.28 29.49±2.71
One-way ANOVA df=5, 24 df=5, 24 df=5, 24
F=2.93 F=0.89 F=19.29
p=0.03* p=0.49 p=0.001*
SD: standard deviation; ANOVA: analysis of variance;n: number of animals;df: degrees of freedom;F:Fvalue; HI7, HI12, and HI17: rat groups with prenatal hypoxia–ischemia on the 7th, 12th, and 17th days of gestational age, respectively; C7, C12, and C17: sham-operated controls on the 7th, 12th, and 17th days of gestational age, respectively.
*p<0.05
control (C7, C12, and C17) groups (p=0.0001, p=0.0001, p=0.009, respectively). In addition, the percentage of alternation of the HI7group was lower than that of the HI17group (p=0.024). Therefore, the lowest spatial memory capability occurred in the HI7group.
MWM test
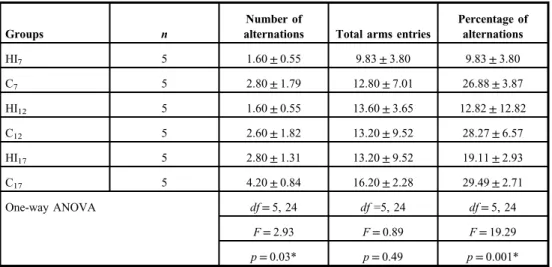
The data of distance traveled during the learning phase of the MWM procedure are presented in Fig. 1. The average path length of all groups of rats followed an irregular pattern of fluctuation. The GLM RM multivariance test using Wilks’lambda of these data revealed a significant difference (p=0.012) between groups. The pairwise comparison of these data showed that the HI12group traveled at a significantly longer trajectory than the C12group (p=0.010).
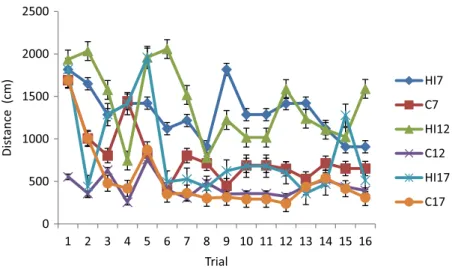
The data on latency during the learning phase of MWM test (Fig. 2) show that the longest latency in thefirst trial was the latency of the HI17group (60±0.01 s), whereas the shortest was that of the C12group (51±3.27 s). The longest latency in the last trial was the latency of the HI12(24.6±8.08 s) group, whereas the shortest was that of the C12group (5.2±2.39 s). The GLM RM multivariance test of Wilks’lambda of these data showed that there was a significant difference (p=0.016) between groups in the latency during the learning phase. The pairwise comparison of the data revealed that the latency of the HI7group was longer than that of the C7group (p=0.008).
The average swimming speed of all groups of rats during the learning phase of the MWM procedure (Fig.3) also followed an irregular pattern. The fastest group in thefirst trial was the HI12(37.4±2.86 cm/s) group and the slowest was the C12group (10.71±2.73 cm/s).
The fastest group in the last trial was the C7group (141.14±12.43 cm/s) and the slowest was the HI17group (68.68±18.02 cm/s). The GLM RM multivariance test of Wilks’lambda of these data demonstrated a significant difference (p=0.008) between groups in the latency during the learning phase. The pairwise comparison of the data revealed that the swimming speed of the HI7group was higher than that of the C7group (p=0.010), and it was also higher
Fig. 1.Mean±standard deviation of the distance traveled during the learning phase of the MWM test. HI7, HI12, and HI17: rat groups with prenatal hypoxia–ischemia on the 7th, 12th, and 17th days of gestational age, respectively;
C7, C12, and C17: sham-operated controls on the 7th, 12th, and 17th days of gestational age, respectively
in the HI12group than in the C12group (p=0.012), and also higher in the HI17group than in the C17group (p=0.02).
The data of the distance percentage, time percentage, number of crossings, and number of opposite crossings in the retention phase of the MWM test are shown in TableIII. The one- way ANOVA test of these data showed a significant main effect of groups in the distance percentage, number of crossings, and number of opposite crossings. The Tukey’spost hoc test showed that the distance percentage of the HI7 group was higher than that of the C7 (p=0.008), HI12 (p=0.05), and HI17 (p=0.007) groups; higher in the HI12 than in
Fig. 3.Mean±standard deviation of swimming speed during the learning phase of the Morris water maze test. HI7, HI12, and HI17: rat groups with prenatal hypoxia–ischemia on the 7th, 12th, and 17th days of gestational age, respectively; C7, C12, and C17: sham-operated controls on the 7th, 12th, and 17th days of gestational age, respectively Fig. 2.Mean±standard deviation of latency during the learning phase of the Morris water maze test. HI7, HI12, and HI17: rat groups with prenatal hypoxia–ischemia on the 7th, 12th, and 17th days of gestational age, respectively;
C7, C12, and C17: sham-operated controls on the 7th, 12th, and 17th days of gestational age, respectively
the C12group (p=0.001); and also higher in the HI17than in the C17group (p=0.0001). The post hoctest also showed that the number of crossings of the HI7group was lower than that of the C7group (p=0.0001), and lower in the HI12group than in the C12group (p=0.017).
Furthermore, thepost hoctest revealed that the mean number of opposite crossings of the HI7
group was higher than that of the C7group (p=0.0001), and it was higher in the HI12than C12
in the group (p=0.0001), and also higher in the HI17than in the C17 group (p=0.0001).
One-way ANOVA test of the data of the visual test conducted on the fifth day of the MWM procedure showed that there was no significant difference between groups in the average time to reach the platform on thefirst, second, and third trials. This result indicated that there was no difference in the sensorimotor ability between groups of rats, and therefore any difference occurring in the learning and retention phases of MWM might purely arise from the difference in the memory capability of rats in the various groups.
The offensive aggressive behavior
One-way ANOVA procedure of the data of the offensive aggressive behavior of the rats (TableIV) showed a significant main effect of groups on the attack latency, rearing, clinch attack, chase, and rest. The Tukey’spost hoctest revealed that the attack latency of the HI7
group was higher than that of the HI12(p=0.012) and HI17(p=0.06) groups. The rearing of the HI7group was higher than that of the HI12(p=0.001) and HI17(p=0.013) groups. The clinch attack of the HI7group was higher than that of the HI12(p=0.024) and HI17(p=0.01) groups. The chase of the HI7group was higher than that of the C7(p=0.039) group. The rest of HI7group was higher than that of the C7(p=0.028) group.
One-way ANOVA test of the data of the total offense scores (Fig. 4) showed a significant main effect of groups. The Tukey’s post hoctest of the data revealed that the
Table III.Mean±SD of distance percentage, time percentage, number of crossings, and number of opposite crossings in the retention phase of Morris water maze test
Groups n % distance % time
Number of crossings
Number of opposite crossings
HI7 5 31.37±4.49 31.78±6.13 2.1±0.002 6.0±0.71
C7 5 49.26±7.12 28.14±6.21 4.2±0.45 3.2±0.84
HI12 5 17.48±5.55 37.41±4.58 2.4±0.55 5.8±0.84
C12 5 39.06±10.51 35.41±4.58 3.8±0.84 3.2±0.45
HI17 5 13.33±2.80 29.60±6.10 2.6±0.48 5.8±0.84
C17 5 39.10±9.80 28.83±10.96 3.4±0.89 2.4±0.55
One way ANOVA df=5, 24 df=5, 24 df=5, 24 df=5, 24
F=18.18 F=1.39 F=9.74 F=25.86
p=0.0001* p=0.264 p=0.0001* p=0.0001*
SD: standard deviation; ANOVA: analysis of variance;n: number of animals;df: degrees of freedom;F:Fvalue; HI7, HI12, and HI17: rat groups with prenatal hypoxia–ischemia on the 7th, 12th, and 17th days of gestational age, respectively; C7, C12, and C17: sham-operated controls on the 7th, 12th, and 17th days of gestational age, respectively.
TableIV.Mean±SDoftheoffensiveaggressivebehaviorofratsduringadolescence Behavior
GroupsOne-wayANOVA HI7C7HI12C12HI17C17dfFp Attacklatency14.40±0.584.80±0.136.60±0.354.00±0.716.00±0.402.80±0.175,247.830.0001* Directionofmovement16.00±0.369.60±0.3611.80±0.819.60±0.2911.40±0.278.60±0.215,241.420.254 Socialexploration2.00±0.122.40±0.892.60±0.892.00±0.143.90±0.831.60±0.155,242.190.890 Rearing1.40±0.890.00±0.000.00±0.000.00±0.000.40±0.050.00±0.005,248.620.0001* Anogenitalsniffing2.00±0.448.00±0.892.60±0.892.00±0.413.90±0.891.60±0.155,242.090.102 Lateralthreat4.00±0.893.00±0.174.40±0.392.60±0.214.00±0.541.40±0.135,242.200.087 Uprightposture7.60±0.391.60±0.213.00±0.352.20±0.254.00±0.541.40±0.135,242.280.079 Clinchattack14.20±0.614.80±0.136.60±0.303.60±0.235.80±0.382.40±0.235,247.090.0001* Keepdown3.80±0.252.00±0.442.00±0.441.49±0.261.00±0.711.80±0.265,242.490.060 Chase13.60±0.894.60±0.752.00±0.231.40±0.261.00±0.711.80±0.265,244.310.0006* Non-socialexploration1.80±0.291.80±0.111.40±0.131.80±0.111.00±0.141.47±0.155,240.300.907 Rest1.00±0.101.80±0.111.40±0.131.60±0.891.40±0.131.03±0.125,243.550.015* SD:standarddeviation;ANOVA:analysisofvariance;n:numberofanimals;df:degreesoffreedom;F:Fvalue;HI7,HI12,andHI17:ratgroupswithprenatalhypoxia–ischemiaon the7th,12th,and17thdaysofgestationalage,respectively;C7,C12,andC17:sham-operatedcontrolsonthe7th,12th,and17thdaysofgestationalage,respectively. *p<0.05
total offense score was higher in the HI7group than in the C7group (p=0.001). In addition, the score of the HI7group was higher than that of the HI17(p=0.016) group.
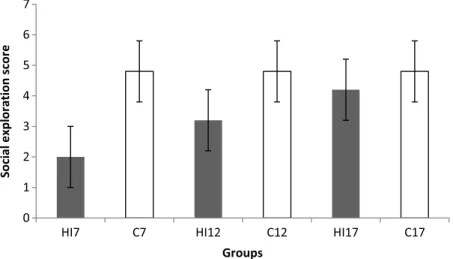
The social exploration scores of the rats are shown in Fig.5. One-way ANOVA test of the social exploration scores showed a significant main effect of groups (p=0.041). The
Fig. 4.Mean±standard deviation of total offense score of the six groups of rats. The score was calculated from the sum of lateral threat, upright, clinch, keep down, and chase movement scores. HI7, HI12, and HI17: rat groups with prenatal hypoxia–ischemia on the 7th, 12th, and 17th days of gestational age, respectively; C7, C12, and C17: sham- operated controls on the 7th, 12th, and 17th days of gestational age, respectively. Results of one-way ANOVA:
df=5, 24;F=2.76;p=0.001
Fig. 5.Mean±standard deviation of social exploration score of the six groups of rats. The score was calculated from the sum of the amount of time spent onflight, defensive upright posture, submission, and freezing movements. HI7, HI12, and HI17: rat groups with prenatal hypoxia–ischemia on the 7th, 12th, and 17th days of gestational age,
respectively; C7, C12, and C17: sham-operated controls on the 7th, 12th, and 17th days of gestational age, respectively. Results of one-way ANOVA:df=5, 24;F=2.76;p=0.041
TableV.Mean±SDofthedefensiveaggressivebehaviorofratsduringadolescence Behavior
GroupsOne-wayANOVA HI7C7HI12C12HI17C17dfFp Submissionlatency4.80±0.245.57±0.261.10±0.005.20±0.235.80±0.916.67±0.155,241.060.409 Submissiveposture2.80±0.141.71±0.751.21±0.451.80±0.8311.20±3.272.00±0.105,242.360.0001* Moveaway1.80±0.112.00±0.134.40±0.232.60±0.152.80±0.842.00±0.175,242.060.106 Flight1.40±0.542.71±0.123.20±0.333.60±0.152.20±0.843.67±0.155,241.180.347 Defensiveuprightposture2.20±0.833.00±0.153.00±0.163.20±0.843.20±0.163.67±0.585,240.760.586 Freeze5.20±0.884.00±0.811.00±0.013.80±0.841.00±0.013.33±0.585,241.120.379 Non-socialexploration2.00±0.712.14±0.371.20±0.802.20±0.452.40±0.842.33±0.585,241.430.008* Rearing1.80±0.841.43±0.781.40±0.892.20±0.131.40±0.543.00±0.105,241.860.139 SD:standarddeviation;ANOVA:analysisofvariance;n:numberofanimals;df:degreesoffreedom;F:Fvalue;HI7,HI12,andHI17:ratgroupswithprenatalhypoxia–ischemiaon the7th,12th,and17thdaysofgestationalage,respectively;C7,C12,andC17:sham-operatedcontrolsonthe7th,12th,and17thdaysofgestationalage,respectively. *p<0.05
Tukey’spost hoctest of the data revealed that the social exploration score was higher in the HI7group than in the HI17group (p=0.047).
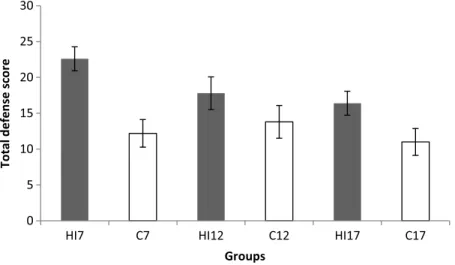
The defensive aggressive behavior
One-way ANOVA of the defensive aggressive behavior data (Table V) demonstrated a significant main effect of groups in the submissive posture (p=0.001) and non-social exploration behavior (p=0.008). The Tukey’s post hoc test showed that the submissive posture score of the HI7 group was higher than that of the HI17 group (p=0.0001).
The non-social exploration behavior score of the HI7 group was higher than that of the HI12 group (p=0.021).
One-way ANOVA analysis of the total defense score data (Fig.6) showed a significant main effect of groups. The Tukey’spost hoctest of these data showed that the total defense score was higher in the HI7group than in the C7group (p=0.005), also it was higher in the HI12group than in the C12 group (p=0.01), and in HI17group than in the C17group (p=0.02) (15).
Discussion
Y-maze and MWM tests were used to detect the spatial memory of the rats. Y-maze assesses the short-term spatial memory and MWM procedure examines the long-term spatial memory. The Y-maze test evaluates the memory capability of rats, based on their tendency to explore new environments. Rats normally prefer to investigate a new arm of the maze rather than returning to the ones that were previously visited. Several brain areas including the prefrontal cortex, hippocampus, septum, and basal forebrain are involved in solving this task (8, 29).
Fig. 6.Mean±standard deviation of total defense score of the six groups of rats. The score was calculated from the sum of the amount of time spent onflight, defensive upright posture, submission, and freezing movements. HI7, HI12, and HI17: rat groups with prenatal hypoxia–ischemia on the 7th, 12th, and 17th days of gestational age, respectively;
C7, C12, and C17: sham-operated controls on the 7th, 12th, and 17th days of gestational age, respectively. Results of one-way ANOVA:df=5, 24;F=3.20;p=0.023
In this study, the Y-maze procedure showed that the percentages of alternations of the HI7, HI12, and HI17groups were lower than that of the corresponding control groups. The lowest percentage of alternations was observed in the HI7group. The MWM test demon- strated that the distance percentages and the numbers of crossings of the HI7, HI12, and HI17
groups were lower than those of the corresponding control groups. Overall, this study found that the spatial memory of the HI rats was lower than that of the controls. This is consistent with the findings of other studies (1, 3,11, 19,26, 33) that fetal HI affects typical brain development and induces atypical cognitive and behavioral presentations. The frontal cortex, hippocampus, and subventricular zone are the most vulnerable regions to the HI insult (23).
A previous investigation by Chen et al. (3) demonstrated that the spatial memory capability of HI rats was lower than that of the controls. This low spatial memory performance may be caused by the neuronal damage and the decrease in the number of the prefrontal cortex and hippocampal cholinergic neurons (3). The degeneration and necrosis in the prefrontal cortex and hippocampus were observed to be proportional with the duration of HI (4). A study by Dubrovskaia and Zhuravin (9) on rats revealed that prenatal HI during embryonic days 14 and 18 impaired short- and long-term memory, as shown in other studies (13,19,30). Chronic prenatal HI condition has been considered to be associated with the disruption in neuron production during the late fetal life, but this effect did not last until the postnatal period (28).
Prenatal HI may cause changes in the brain structure, which underlie adversely permanent dysfunctions, such as mental retardation, motor disturbances, learning disability, epilepsy, cerebral palsy, and cardiovascular diseases (5,28). Cerebral palsy has been reported to occur in 2 per 1,000 infants. Prenatal HI causes 15%–20% of deaths during the postnatal period, and 25% will have permanent neuropsychological development disorders (12,19).
This study also observed that the aggression of the HI rats was higher than that of the controls. Subjects of this study were male rats. In human studies, aggressive behavior was associated with male gender, length of stay at wards, legal status, and HI as the cause of brain injury. Aggression was found to be highly prevalent among male patients with acquired brain injury (33) and male rats (11). The results of aggression test of this study showed that offensive and defensive aggression during adolescence was higher in the experimental than in the control groups. Aggressive behavior aimed at causing damage or pain to another individual. Aggression has been associated with structural and functional deficits in numer- ous brain areas, including the dorsolateral region of the prefrontal cortex (DLPFC). Our results are in agreement with recent studies suggesting that the left DLPFC plays a major role in aggressive behavior (21,24). The exact mechanisms of prenatal HI, cognitive deficits, and behavioral disorders are still being debated. At present, the relationship between prenatal HI and aggression remains unclear (20). For example, some studies argued that hypoxia influences social function but not aggressive behavior (18,32). A rat-model study performed by Nakazawa and Tang (22) also reported that neonatal HI did not increase the aggressive behavior.
Conclusions
In conclusion, HI causes deficits in the spatial memory and aggression of rats during adolescence. The longer the duration of prenatal HI, the lower the spatial memory, and the higher the aggression during adolescence. Future studies may be warranted to investigate the precise pathophysiological mechanisms of this behavioral deterioration.
Acknowledgements
This study was funded byKopertis Wilayah VYogyakarta,Kementrian Pendidikan dan Kebudayaan(Ministry of Education and Culture), Indonesia (Hibah BersaingProject DIPA no: 023.04.1.673453/2015). The authors would like to thank Wasino (Integrated Research Laboratory, Universitas Gadjah Mada) and Suparno (Department of Physiology, Faculty of Medicine, Universitas Gadjah Mada) for their technical assistance.
Conflict of interest
The authors declare no conflict of interest.
REFERENCES
1. Barrett RD, Bennet L, Davidson J, Dean JM, George S, Emerald BS, Gunn AJ: Destruction and reconstruction:
hypoxia and the developing brain. Birth Defects Res. C. Embryo Today. 81, 163–176 (2007)
2. Bouet V, Freret T, Ankri S, Bezault M, Renolleau S, Boulouard M, Jacotot E, Chauvier D, Schumann-Bard P:
Predicting sensorimotor and memory deficits after neonatal ischemic stroke with referfusion in the rat. Behav.
Brain Res. 212, 56–63 (2010)
3. Chen Y, Zhao CL, Zhang CL, Xu Q: The progressive effect of chronic intermittent hypoxia on cognitive function and the cholinergic neuron in rats. Biomed. Rep. 27, 192–195 (2011)
4. Chung YY, Jeon HY, Kim SW: Cortical neuronal loss after chronic prenatal hypoxia: a comparative laboratory study. J. Korean Neurosurg. Soc. 56, 488–491 (2014)
5. Chung YY, So K, Kim E, Kim SW, Jeon HY: Immunoreactivity of eurogenic factor in the guinea pig brain after prenatal hypoxia. Ann. Anat. 200, 66–72 (2015)
6. de Rooij SR, Wouters H, Yonker JE, Painter RC, Roseboom TJ: Prenatal undernutrition and cognitive function in late adulthood. Proc. Natl. Acad. Sci. U. S. A. 107, 16881–16886 (2010)
7. Delcour M, Oliver P, Chambon C, Pansiot J, Russier M, Liberge M, Xin D, Gestreau C, Alescio-Lautier B, Gressens P, Verney C, Barbe MF, Baud O, Coq JO: Neuroanatomical, sensorimotor and cognitive deficits in adult rats with white matter injury following prenatal ischemia. J. Brain Pathol. 22, 1–16 (2012)
8. Detrait E, Brohez C, Hanon E, DeRyck M (2010): Automation of continuous spontaneous alternation to increase the throughput for in vivo screening of cognitive enhancers. Optimization of the ethovision system for the Y-maze test in mice. In: Proceeding Measuring Behaviour, eds Spink AJ, Grieco F, Krips OE, Loijens LWS, Noldus LPJJ, Zimmerman PH, Noldus Information Technology, Eindhoven, The Netherlands, pp. 141–144 9. Dubrovskaia NM, Zhuravin IA: Specificity of ontogenic development of behavior of rats subjected to prenatal
hypoxia on the 14-th or 18-th days of embryogenesis. Zh. Vyssh. Nerv. Deiat. Im. I P Pavlova. 58, 718–727 (2008)
10. Fazzi E, Bova S, Giovenzana A, Signorini S, Uggetti C, Bianchi P: Cognitive visual dysfunctions in preterm children with periventricular leukomalacia. Dev. Med. Child Neurol. 51, 974–981 (2009)
11. Ferraz MM, Sab IM, Silva MA, Santos DA, Ferraz MR: Prenatal hypoxia ischemia increases male rat sexual behavior. J. Sex. Med. 12, 2013–2021 (2015)
12. Gilany K, Vafakhah M: Hypoxia: a review. J. Paramed. Sci. 1, 43–54 (2010)
13. Golan MH, Mane R, Molczadzki G, Zuckerman M, Kaplan-Louson V, Huleihel M, Perez-Polo JR: Impaired migration signaling in the hippocampus following prenatal hypoxia. Neuropharmacology 57, 511–522 (2009) 14. Hermawati E, Sari DCR, Partadiredja G: The effect of black garlic ethanol extract on the spatial memory and estimated total number of pyramidal cell of the hippocampus of monosodium glutamate-exposed adolescent male Wistar rat. Anat. Sci. Int. 90, 275–286 (2015)
15. Indriawati R (2017): Pengaruh hipoksia iskemik pranatal terhadap memori spasial dan agresivitas. Kajian kadar HIF-1α, reseptor dopamin D1dan BDNF [Indonesian] [The effects of prenatal hypoxia-ischaemia on the spatial memory and aggression. A study on HIF-1α, dopamine D1receptor, and BDNF level]. Thesis, Universitas Gadjah Mada, Yogyakarta, Indonesia
16. Koolhaas JM, Coppens CM, de Boer SF, Buwalda B, Meerlo P, Timmermans PJ: The resident-intruder paradigm: a standardized test for aggression, violence and social stress. J. Vis. Exp. 77, e4367 (2013) 17. Larroque B, Delobel M, Arnaud C, Marchand L: Outcome at 5 and 8 years of children born very preterm. Arch.
Pediatr. 15, 589–591 2008
18. Laviola G, Adriani W, Rea M, Aloe L, Alleva E: Social withdrawal, neophobia, and stereotyped behavior in developing rats exposed to neonatal asphyxia. Psychopharmacology 175, 196–205 (2004)
19. Li Y, Gonzales P, Zhang L: Fetal stress and programming of hypoxia/ischemic-sensitive phenotype in neonatal brain: mechanisms and possible interventions. Prog. Neurobiol. 98, 145–165 (2012)
20. Mikati MA, Zeinieh MP, Kurdi RM, Harb SA, El Hokayem JA, Daderian RH, Shamseddine A, Obeid M, Bitar FF, El Sabban M: Long-term effects of acute and of chronic hypoxia on behavior and on hippocampal histology in the developing brain. Brain Res. Dev. Brain Res. 157, 98–102 (2005)
21. Minati L, Campanhã C, Critchley HD, Boggio PS: Effects of transcranial direct-current stimulation (tDCS) of the dorsolateral prefrontal cortex (DLPFC) during a mixed-gambling risky decision-making task. Cogn. Neurosci. 3, 80–88 (2012)
22. Nakazawa M, Tang AC: Adult aggression during an initial social encounter: effects of neonatal anoxia and relation to juvenile open-field activity. Neurosci. Lett. 408, 119–123 (2006)
23. Northington FJ, Ferriero DM, Graham EM, Traystman RJ, Martin LJ: Early neurodegeneration after hypoxia- ischemia in neonatal rat is necrosis while delayed neuronal death is apoptosis. Neurobiol. Dis. 8, 207–219 (2001) 24. Perach-Barzilay N, Tauber A, Klein E, Chistyakov A, Ne’eman R, Shamay-Tsoory SG: Asymmetry in the dorsolateral prefrontal cortex and aggressive behavior: a continuous theta-burst magnetic stimulation study.
J. Soc. Neurosci. 8, 178–188 (2013)
25. Rees S, Harding R: Brain development during fetal life: influences of the intra-uterine environment. Neurosci.
Lett. 361, 111–114 (2004)
26. Sab IM, Ferraz MMD, Amaral TAS, Resende AC, Ferraz MR, Matsuura C: Prenatal hypoxia, habituation memory and oxidative stress. Pharmacol. Biochem. Behav. 107, 24–28 (2013)
27. Sauvageot CM, Stiles CD: Molecular mechanism controlling cortical gliogenesis. Curr. Opin. Neurobiol. 12, 143–146 (2002)
28. So K, Chung Y, Lee H, Kim E, Jeon Y: The effect of chronic prenatal hypoxia on the development of mature neurons in the cerebellum. J. Neurodev. Disord. 5, 17 (2013)
29. Tamura H, Ishikawa Y, Hino N: Neuropsin is essential for early processes of memory acquisition and Schaffer collateral long-term potentiation in adult mouse hippocampusin vivo. J. Physiol. 570, 541–551 (2006) 30. Tyul’kova EI, Vataeva LA, Vetrovoy OV, Romanovsky DY: Prenatal hypoxia modifies working memory and
the activity of hippocampal polyphosphoinositide system in rats. Zh. Evol. Biokhim. Fiziol. 51, 115–121 (2015) 31. Vasilev DS, Dubrovskaya NM, Tumanova NL, Zhuravin IA: Prenatal hypoxia in different periods of embryogenesis differentially affects cell migration, neuronal plasticity, and rat behavior in postnatal ontogenesis.
Front. Neurosci. 10, 126 (2016)
32. Venerosi A, Cutuli D, Chiaroti F, Calamandrei G: C-section birth per se or followed by acute global asphyxia altered emotional behavior in neonate and adult rats. Behav. Brain Res. 168, 56–63 (2006)
33. Visscher AJ, van Meijel B, Stolker JJ, Wiersma J, Nijman H: Aggressive behaviour of inpatients with acquired brain injury. Clin. Nurs. 20, 3414–3422 (2011)
34. Volpe JJ: Brain injury in premature infants: a complex amalgam of destructive and developmental disturbances.
Lancet Neurol. 88, 1–13 (2009)