via machine learning
Husam Rajab
p, Mussa Ebrahim and Tibor Cinkler
Department of Telecommunications and Media Informatics, Faculty of Electrical Engineering and Informatics, Budapest University of Technology and Economics, M}uegyetem rkp. 3, H-1111 Budapest, Hungary
Received: August 5, 2020 • Revised manuscript received: December 9, 2020 • Accepted: December 16, 2020 Published online: April 30, 2021
ABSTRACT
Recently, one of the most common needs of people are to be connected to the Internet anytime, anywhere, anyhow. The Internet of Things is a materialized paradigm in which everyday objects are implemented with Internet connectivity, enabling them to collect and interchange information. As energy is expected to be more expensive, the energy supply is often not available for IoT devices, the low power wide area networks attempt to be the solution to this problem. LoRaWAN provides radio coverage over long distances by enhancing the reach of the base stations via adapting transmission rates, transmission power, modulation, duty cycles, etc. This paper aims to decrease the power consumption using machine learning and deep neural network by applying support vector regression and deep neural network algorithms, which can support to extend the battery lifetime.
KEYWORDS
internet of things, low power wide area network, machine learning, deep neural network, support vector regression
1. INTRODUCTION
The exponential growth of using the Internet of Things (IoT) is becoming an increasingly challenging problem. IoT includes a group of devices connected to the Internet, which are usually defined by their low complexity, long-range transmission, and their low power consumption, most likely battery-powered sensors connected to the Internet [1]. IoT is a burgeoning field that could be employed in various areas, intelligent fridges to wearable devices [2, 3]. Due to amount of IoT devices increasing ubiquity and connected to Low Power Wide Area Networks (LPWANs) is forcing the network operators to enhance the scalability of their networks [4].
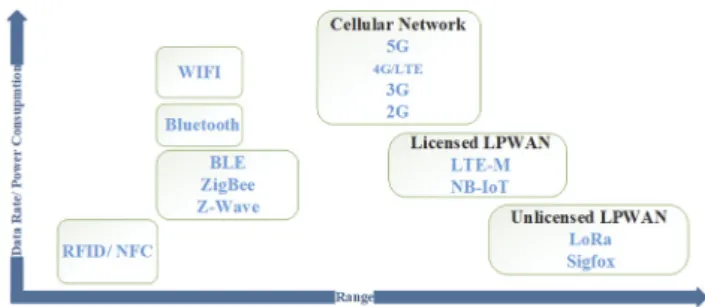
Moreover, a small battery that requires enduring for several years typically powers these mobile devices. Wide Area Networks (WANs) play an essential role in connecting the pri- mary facilitation through LPWAN is enabling power-efficient wireless communication over long distances [5]. Figure 1illustrates the comparison between LPWAN technologies.
In each approach, a trade-off between location accuracy and energy consumption must be taken into consideration. However, when investigating various studies of the same method, many other parameters need to be considered. In this concern, the efficient use of data compression and local data analysis to decrease the required transmission bandwidth is a realizable strategy, which could be emerged with the use of long-range small-bandwidth protocols [6]. One of LPWAN technologies that have reached great interest and importance is Long Range (LoRa) (a long range, low power, low bit rate wireless transmission and networking protocol). LoRa is one of the promising solutions that is significant for many IoT application scenarios, in particular smart grids, smart cities, smart metering, smart agricul- ture, geological monitoring, etc. [7].
Pollack Periodica • An International Journal for Engineering and Information Sciences
16 (2021) 2, 86–91
DOI:
10.1556/606.2020.00263
© 2020 The Author(s)
ORIGINAL RESEARCH PAPER
pCorresponding author.
E-mail:husamrajab@tmit.bme.hu
Furthermore, it is a non-cellular modulation technology for LoRaWAN. LoRaWAN is the standard protocol for WAN part of the communications. LoRa is the physical layer of the radio network for IoT solutions and has more reliable link budgets than other comparable radio technol- ogies [8]. LoRaWAN is mainly designed and optimized for uplinks where the end devices broadcast data to the gateway using periodic and aperiodic communication or due to a specified radio duty-cycle [9]. However, this design does not support extensive data communication, like video, photos [10] but works rather on the milibit per second speeds when averaged over a day or a week. Overall, LoRaWAN networks are remarkably customizable wireless networks fitted to individually adapting the transmission parameter of their constituting devices. Accordingly, from the networking prospect, an optimal configuration can be found for each node that embraces transmission parameters of every node [11]. That would allow us to optimize the use of the available communication bandwidth effectively, so some predefined figures of merit, one is the throughput, battery lifetime, which could be maximized. Machine Learning (ML) tech- niques like Q-learning and multi-armed bandit can play a significant role in scheduling and random access to manage the resources in the smart cities and smart home environ- ment. It is because these ML methods learn and can adapt dynamically to the variations (changes) in the network ecosystem [12].
Moreover, several machine-learning algorithms are evaluated in terms of power consumption and battery lifetime in [13]. This research investigates and assesses Support Vector Regression (SVR) and Deep Neural Network (DNN) algorithms applied to the LoRaWAN protocol to decrease the power consumption and extend the battery lifetime.
2. RELATED WORK
Several works have studied the impacts of different LoRa transmission configurations onto IoT networks, for instance, determining the overall network capacity of single-gateway networks [9,12]. Machine learning is being applied on the edge nodes to reduce power consumption and transmission bandwidth. Soto et al. [14] provide a theoretical framework for employing machine learning to the IoT. In [15, 16] the isolated energy requirements of the edge devices are inves- tigated without examining the communication protocols involved. The communication protocol is a power- consuming component. Accordingly, various communica- tion technologies for IoT devices such as LoRa, NarrowBand (NB-IoT), and Bluetooth Low Energy (BLE), which are Low Power Wide Area (LPWA), are illustrated in Figure 1. The advantage of LPWA is that it can communicate over long distances with low power consumption. Therefore, the au- thors in [17] investigated the LoRa application and indicated that the decreased bitrate is one of the most confining factors in facilitating ubiquitous real-time IoT applications. [18, 19]
investigated transmission parameters of each node to
improve network throughput. To the best of knowledge, there is no work that evaluates the power requirements for a system that combines the low power protocol LoRa with machine learning algorithms for further decreasing power requirements, that is the main result of this paper. A solu- tion to extend the battery lifetime of IoT devices primarily for LoRa/LoRaWAN is proposed, however, without loss of generality these results are applicable to various other LPWAN technologies.
3. PROBLEM STATEMENTS
The massive use of IoT devices, and its further rapid growth requires more focus on power consumption of these devices and these networks. The main goal of the LPWAN network is to use as low power as possible, even for long-distance transmissions. This requires to optimize the power con- sumption of the IoT devices and of the IoT network. This research aims to optimize the power consumption of LoR- aWAN using ML (Machine Laerning) algorithms. The LoRaWAN device power consumption depends on various parameters for instance user requirements, territorial limit, and resource allocation, etc. Optimizing parameters like transmit on time, tsystm, BW, tcycle, etc. is managing the demands and values of LoRaWAN limitation depending on their consumption. This research proposes two machine- learning algorithms to optimize the power consumption of the LoRaWAN device, which is the SVR and DNN model.
Based on the parameters to configure the parameters of the LoRaWAN device and predict different metrics based on the needs of the user. Mathematically, x-coordinate represents the independent variables or user requirement for LoR- aWAN, andy-coordinate represents the dependent variables.
Thus, the correlation between dependent variables and in- dependent variables maximizes the probability of observing the event according to the random error. Moreover, observing a simple linear relationship between the two sets of values to calculate the battery life in years of IoT devices.
3.1. Data set
In regards to optimizing the power consumption and to implement ML algorithms, data collection procedure and group of trainable data sets for LoRaWAN devices is as follow: the data set preparation takes the first step – the
Fig. 1.Low power wide area technologies
implementation of machine learning algorithms is the sec- ond step. Machine learning in IoT devices takes place in this step after finding real-life data. Thirdly, simulation and implementation of LoRaWAN device is to measure the power consumption as a function of different factors. One of the challenging issues is to find real-life data and preparing the data set for the model. In this research, the proposed data set is implemented using power consumption factors formula, which is derived from The Things Network United Kingdom (TTN UK), which gives us close to the real-life data [20]. Moreover, as it is shown in Table 1, the input parameters are generated randomly using the rules and regulations of things network of Europe environmental pa- rameters. Furthermore, in the first step, 20-power con- sumption factor parameters that have impact on LoRaWAN.
However, to make the proposed dataset more efficient, exploring, reducing and refining additional parameters was relevant. Afterword, the input dataset winded up with 15 main power consumption parameters and generate their value according to the TTN policy [20]. The total number of data set entries used is 35,192, which is appropriate for this purpose.
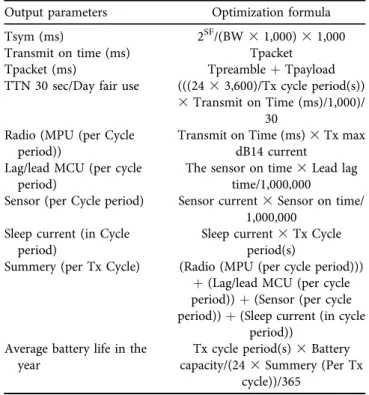
The output parameter is generated using the input parameter, by applying the formula that is provided in Table 2. Therefore, the histogram shows the calculated outcome of each parameter and its range.
Data reduction and cleaning should be done before loading the data into the model because unreliable or misleading data can lead us to inevitable or incorrect results.
In other words, data cleaning and reduction means deleting or removing unnecessary parameters. The heat map corre- lation system is used to recognize the correlation between each parameter and remove some parameters from the dataset, which have no impact on the optimization process.
The correlation of all the dependent and independent pa- rameters is evaluated using numerical values. The value one is the highest correlation, which means the relationship
between the parameters is similar. Furthermore, zero value or less than one shows how much the parameters are correlated to each other. Nevertheless, after reduction and cleaning, it winded up with 15 independent input parame- ters and 10 dependent output parameters.
3.2. Data loader
As it was mentioned in the previous section, the dataset is prepared efficiently with proportional parameters through the reduction and cleaning methods.
Before starting the implementation using the proposed ML algorithms preparing the training dataset was relevant, afterwards, using the data loader to load the dataset.
In this section, the data loading process separated into two steps, data splitting and data scaling:
1. Data splitting
Since the generated data set is 35,192, in the data split- ting section, the division of the data into to train set and test set, 80–20% respectively for the ML model was sufficient.
Letx5train set;y5test set;z5length of the dataset,
x¼z30:8; (1)
x¼z30:2: (2)
2. Data scaling
In the data scaling section, the used mini-max system is in the interval of [0. . .1] which means it takes the smallest value and the most significant value of each column in the dataset and represents than in the range of 0 and 1 respectively.
Table 2.Sample formula for output parameters Output parameters Optimization formula
Tsym (ms) 2SF/(BW31,000)31,000
Transmit on time (ms) Tpacket
Tpacket (ms) TpreambleþTpayload
TTN 30 sec/Day fair use (((2433,600)/Tx cycle period(s)) 3Transmit on Time (ms)/1,000)/
30 Radio (MPU (per Cycle
period))
Transmit on Time (ms)3Tx max dB14 current
Lag/lead MCU (per cycle period)
The sensor on time3Lead lag time/1,000,000
Sensor (per Cycle period) Sensor current3Sensor on time/
1,000,000 Sleep current (in Cycle
period)
Sleep current3Tx Cycle period(s)
Summery (per Tx Cycle) (Radio (MPU (per cycle period))) þ(Lag/lead MCU (per cycle period))þ(Sensor (per cycle period))þ(Sleep current (in cycle
period)) Average battery life in the
year
Tx cycle period(s)3Battery capacity/(243Summery (Per Tx
cycle))/365
Table 1.Sample Input parameters and range used
Input Minimum-input
Maximum- input
Battery capacity (mAh) 600 1,500
Spreading factor (SF) 7 12
Custom payload 1 100
Overhead payload 1 50
Transmission (Tx) Max (dB) 14 current
50 90
Sleep current (mA) 0.01 0.5
Sensor current (MA) 10 60
Lead lag time (ms) 1 20
Low data rate optimize “0”(If SF≥7 and SF≤10)
“1”(IF SF >
10)
Codding rate 1 4
Band width 125 500
Explicit header 0 1
Sensor on time (ms) 600 1,000
Tx cycle period (ms) 60 500
3.3. Proposed ML algorithms
3.3.1. Support vector regression. SVR algorithm was used to verify and optimize the power consumption of LoR- aWAN because it is composed of the linear regression function. However, SVR is used for predictions instead of classification, which have multiple input (x-features) fea- tures and numerous output features (y-features).
y¼b0þb1x1: (3) wherey5y1,y2,y3. . .yn;x5x1,x2,x3. . .xn;b05biasand b1 5weight of the parameter.
The dataset is composed of multiple input parameter (x) and a various output parameter (y), x-independent variables and y-dependent variables respectively. In the model it takes 15 independent variables and tries to map them, gives us the predicted value then compare the ex- pected value with the real value by calculating the absolute difference.
3.3.2. Deep neural network. A DNN is an ANN with multiple layers between the input and output layers [21].
The DNN finds the correct mathematical manipulation to turn input into the output, whether it is a linear relationship or a non-linear relationship.
In this research DNN is used in addition to SVR for comparison purposes and to find more results that are efficient by optimizing the power consumption of LoR- aWAN. The DNN consists of multiple linear regression functions. It has three layers, including an input layer, a hidden layer and an output layer, therefore 15 input, 100 hidden layers, and 10 output.
4. RESULTS AND SIMULATION
In the previous section, the performance of two different learning algorithms parameters in a network in which all devices use the same standard was analyzed. In this section, the ability of these two algorithms are confirmed to reduce power consumption and highlight the strength of the pro- posed algorithms to cope with different attributes. For that purpose, comparing the SVR model with DDN are shown in Figs 2 and 3, respectively. Through evaluating the perfor- mance of these learning algorithms, considering that the predicted columns the absolute difference of the expected value with the real value. Firstly, by analyzing the number of transmissions in each channel by setting the batch size to five, since the total number of datasets is 35,192 and choose 5-batch size is relevant for the training, every batch will have 4,689 rows of data after training.Figures 2 and 3show the absolute difference of each batch, which means that after training it is taking five rows of the test-dataset in every epoch and demonstrate the absolute difference. The maximum absolute difference is 0.025 for SVR and 0.040 for DNN respectively, which makes DNN closer to 0 or close to real value than SVR. However, when experimenting on a random epoch number, it gives different values in every trial
even with bigger epoch; it might generate a more consid- erable absolute difference.
Accordingly, when analyzing the evolution of power consumption using DNN and SVR ML algorithms and compare it to the real data. In addition, choosing the number randomly for the batch and epochs, we used five batches, and 200 epochs with random parameters.
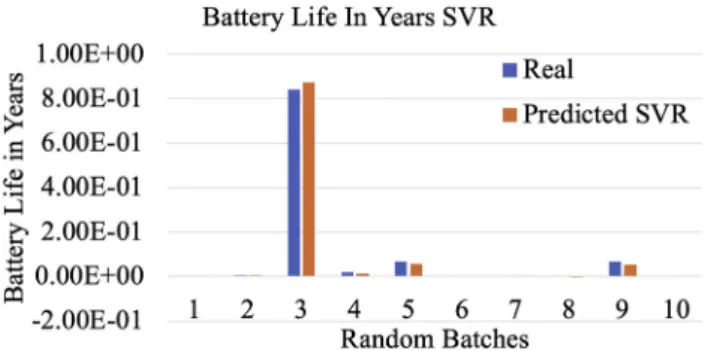
Figures 4 and 5 show the battery consumption in years of the real data and the predicted data using both ML algorithms. Eventually, the results in both the ML algorithm is most likely similar to the actual data’s battery consumption. However, when checking the de- tails of predicted values versus the real values, the result was changeable, which means the battery life of the predicted is more significant than the real-life in most cases. For instance, in Fig. 4, on row 2, 4, 6, 7, and 8, the expected result is higher than the real. Furthermore, at some point, the real-life values are more notable than the predicted.
Fig. 2.Absolute difference SVR model
Fig. 3.Absolute difference of DNN
5. CONCLUSION
In this work, after an extensive analysis of the power con- sumption requirements, we evaluated two different Machine Learning algorithms on a dataset to optimize the power consumption of the LoRaWAN device, which is the SVR and DNN model.
Based on the parameters to configure the parameters of the LoRaWAN device and predict different metrics based on the needs of the user. Thus, the correlation between dependent variables and independent variables maximizes the probability of observing the event according to the random error. Moreover, because of the lack of power and implications on battery life for the device, preserving a simple linear relationship between the two sets of values to calculate the battery life is essential.
The future work consists of further improving the dataset representation by preprocessing the dataset using a Genetic Algorithm (GA). Finally, to integrate LoRaWAN networks with multiple gateways.
ACKNOWLEDGEMENTS
“This work was supported by the Ericsson –BME 5G joint research and cooperation project, partly funded by the Na- tional Research, Development and Innovation Office, Hungary with project number 2018-1.3.1-VKE-2018- 00005.”Also, this research is supported by Tempus Public Foundation, Stipendium Hungaricum Scholarship Pro- gramme and High Speed Networks Lab, Department of
Telecommunications and Media Informatics, Budapest University of Technology and Economics.
REFERENCES
[1] R. S. Sinha, Y. Wei, and S. H. Hwang,“A survey on LPWA tech- nology: LoRa and NB-IoT,”ICT Express, vol. 3, no. 1, pp. 14–21, 2017.
[2] K. Mekki, E. Bajic, F. Chaxel, and F. Meyer,“A comparative study of LPWAN technologies for large-scale IoT deployment,” ICT Express, vol. 5, no. 1, pp. 1–5, 2019.
[3] M. Haghi, K. Thurow, and R. Stoll,“Wearable devices in medical internet of things: Scientific research and commercially available devices,”Healthc. Inform. Res., vol. 23, no. 1, pp. 4–15, 2017.
[4] O. Georgiou and U. Raza,“Low power wide area network analysis:
Can LoRa scale?” IEEE Wirel. Commun. Lett., vol. 6, no. 2, pp. 162–165, 2017.
[5] H. Linka, M. Rademacher, O. G. Aliu, K. Jonas, B. Rhein-sieg, and S. Augustin,“Path loss models for low-power wide-area networks:
Experimental results using LoRa,” in Conference on 23. ITG Fachtagung Mobilkommunikation, Technologien und Anwendun- gen, Osnabr€uck, Germany, May 16–17, 2018, 2018, pp. 10–14.
[6] B. Djail, W. K. Hidouci, and M. Loudini,“A comparative evalu- ation of techniques for N-way joins in wireless sensors networks,” Pollack Period., vol. 15, no. 2, pp. 13–24, 2020.
[7] D. F. Carvalho, P. Ferrari, E. Sisinni, A. Depari, S. Rinaldi, M. Pasetti, and D. Silva, “A test methodology for evaluating architectural delays of LoRaWAN implementations,” Pervasive Mobile Comput., vol. 56, pp. 1–17, 2019.
[8] D. Bankov, E. Khorov, and A. Lyakhov,“Mathematical model of LoRaWAN channel access with capture effect,” in IEEE 28th Annual International Symposium on Personal, Indoor and Mobile Radio Communications, Montreal, QC, Canada, Oct. 8–13, 2017, 2017, pp. 1–5.
[9] H. Rajab, T. Cinkler, and T. Bouguera,“IoT scheduling for higher throughput and lower transmission power,” Wireless Networks, https://doi.org/10.1007/s11276-020-02307-1, 2020.
[10] SX1272 development kit, User guide, Wireless and sensing products. [Online]. Available:www.semtech.com. Accessed: May 26, 2020.
[11] F. Adelantado, X. Vilajosana, P. Tuset-Peiro, B. Martinez, J. Melia- Segui, and T. Watteyne,“Understanding the limits of LoRaWAN,” IEEE Commun. Mag., vol. 55, no. 9, pp. 34–40, 2017.
[12] S. Ali, A. Ferdowsi, W. Saad, N. Rajatheva, and J. Haapola,
“Sleeping multi-armed bandit learning for fast uplink grant allo- cation in machine type communications,” arXiv, vol. 68, no. 8, pp. 5072–5086, 2018.
[13] S. Bozkurt, G. Elibol, S. Gunal, and U. Yayan, “A comparative study on machine learning algorithms for indoor positioning,”in 2015 International Symposium on Innovations in Intelligent SysTems and Applications, Proceedings, Madrid, Spain, Sep. 2–4, 2015, 2015, pp. 1–8.
[14] J. A. C. Soto, M. Jentsch, D. Preuveneers, and E. Ilie-Zudor,
“CEML: Mixing and moving complex event processing and ma- chine learning to the edge of the network for IoT applications,”in Proceedings of the 6th International Conference on the Internet of Things, Stuttgart, Germany, Nov. 7–9, 2016, 2016, pp. 103–110.
Fig. 5.Power consumption comparison DNN Fig. 4.Power consumption comparison SVR
[15] I. Pentek,A. Garai, and A. Adamk o,“Open iot-based telemedicine hub and infrastructure,”Pollack Period., vol. 13, no. 1, pp. 33–44, 2018.
[16] N. El Rachkidy, A. Guitton, and M. Kaneko, “Collision resolution protocol for delay and energy efficient LoRa networks,” IEEE Trans. Green. Commun. Netw., vol. 3, no. 2, pp. 535–551, 2019.
[17] R. Bonnefoi, L. Besson, C. Moy, E. Kaufmann, and J. Palicot,
“Multi-armed bandit learning in IoT networks: Learning helps even in non-stationary settings,”in12th EAI International Con- ference on Cognitive Radio Oriented Wireless Networks, Lisbon, Portugal, Sep. 20, 2017, 2017, pp. 173–185.
[18] A. Sabovic, C. Delgado, D. Subotic, B. Jooris, E. De Poorter, and J.
Famaey,“Energy-aware sensing on battery-less lorawan devices
with energy harvesting,”Electron., vol. 9, no. 6, Paper no. 904, pp.
1–18, 2020.
[19] M. Bor and U. Roedig,“LoRa transmission parameter selection,” inProceedings–2017 13th International Conference on Distributed Computing in Sensor Systems, Ottawa, ON, Canada, June 5–7, 2017, 2017, pp. 27–34.
[20] LoRaWAN|The Things Network. [Online]. Availabe:https://www.
thethingsnetwork.org/docs/lorawan/. Accessed: Dec. 8, 2020.
[21] F. Granata, S. Papirio, G. Esposito, R. Gargano, and G. De Marinis, “Machine learning algorithms for the forecasting of wastewater quality indicators,”Water, vol. 9, no. 2, Paper no. 105, pp. 1–12, 2017.
Open Access. This is an open-access article distributed under the terms of the Creative Commons Attribution 4.0 International License (https://creativecommons.org/
licenses/by/4.0/), which permits unrestricted use, distribution, and reproduction in any medium, provided the original author and source are credited, a link to the CC License is provided, and changes–if any–are indicated. (SID_1)