Both trait-neutrality and filtering effects are validated by the
vegetation patterns detected in the functional recovery of sand grasslands
P. Török 1,2, G. Matus3, E. Tóth1, M. Papp3, A. Kelemen2,4, J. Sonkoly 1,2 & B. Tóthmérész2,5 Neutral theory of species assembly means that species assembly is governed by stochastic dispersal processes and fluctuations in established populations. An alternative theory suggests that assembly is strongly determined by functional trait filtering governed by abiotic and biotic filtering selecting species from the local species pool. To test these assumptions, in the current paper we analysed vegetation changes in the first 12 years of succession after heavy goose grazing on acidic sand. With trait-based analyses using permanent plots we addressed the following hypotheses: (i) High fluctuations in the trait values are typical in the first years; later a temporally divergent change in the trait patterns of sites with different vertical position became characteristic. (ii) In the functional diversity of regenerative and vegetative traits we expected different temporal patterns. We confirmed the first hypothesis, as in the first few years most traits displayed high fluctuations with no clear patterns. Our findings weakly supported the second hypothesis; while there were distinct patterns detected in the functional richness of traits, functional divergence and evenness displayed no clear distinctive patterns. We can conclude that both trait neutrality and filtering effects operate in the vegetation changes of the first period of secondary succession.
Grassland ecosystems are suffering worldwide from area loss and changing levels of human pressure mostly in form of altered management ranging from intensification to underuse and abandonment1. To mitigate the neg- ative effects of human pressure and to facilitate the recovery of grasslands, it is vital to understand dynamic pro- cesses that govern species assembly and processes related to the changes in biodiversity. One of the most exciting species assembly processes is vegetation succession. The early studies dealt with the description and analysis of general changes in vegetation patterns, but later the link between pattern and processes has become more impor- tant2. Driven by socio-economic and environmental changes, there is an increasing trend of land abandonment worldwide, which underlines the necessity to understand processes that govern vegetation succession in aban- doned agricultural areas3.
There are several contrasting views of species assembly and the course of succession. Neutral theory of species assembly (in sense of Hubbel4) suggests that species assembly is rather a stochastic process and it is governed by dispersal processes (e.g. priority effects and differences in species arrival and/or seed banks) and stochas- tic fluctuations in established populations. This view is deeply rooted in the view of Gleason5 and in the initial floristic composition theory of Egler6 (revisited by Wilson et al.7). Another approach suggests that community assembly is strongly determined by functional trait filtering governed by more or less definite interaction of abiotic and biotic filtering processes selecting species from the available local species pool. This means that the
1MTA-DE Lendület Functional and Restoration Ecology Research Group, Egyetem tér 1, H-4032, Debrecen, Hungary. 2University of Debrecen, Department of Ecology, Egyetem tér 1, H-4032, Debrecen, Hungary. 3University of Debrecen, Department of Botany, Egyetem tér 1, H-4032, Debrecen, Hungary. 4MTA Postdoctoral Research Program, MTA TKI, Nádor utca 7, Budapest, H-1051, Hungary. 5MTA-DE Biodiversity and Ecosystem Services Research Group, Egyetem tér 1, H-4032, Debrecen, Hungary. Correspondence and requests for materials should be addressed to P.T. (email: molinia@gmail.com)
Received: 6 June 2018 Accepted: 31 August 2018 Published: xx xx xxxx
OPEN
vegetation development processes are rather predictable based on the functional trait composition of the com- munity. This view is strongly linked to the classical deterministic successional theory of Clements8, improved by several authors including Drury & Nisbet9 or Conell & Slatyer10. Field evidence suggests that due to differences in local species pools, dispersal processes, site characteristics, and climate, multiple pathways of succession occur.
This implies that neutrality and filtering both operate in communities; however, their spatial and temporal pat- terns may differ within and between different species assemblies11. Former research suggests that early vegetation development is mainly driven by stochastic fluctuations and dispersal interacting with local abiotic conditions, while biotic habitat filtering (e.g. by facilitation or competition) becomes an important driver later on12.
The trait-based approach may provide a powerful tool to understand the mechanisms of temporal changes, species assembly and biotic interactions13,14. Using traits instead of studying changes in taxonomic composition also enables us to detect general trends and processes directing vegetation changes in similar habitats but with different flora15. Studying changes in the trait composition was increasingly considered in studies of vegetation succession in the last decade, but most interest was directed to forest succession so far (but see Purschke et al.16 or Douma et al.17).
Most studies report trait-based analyses of vegetation development comparing the vegetation along a chron- osequence17–20. Although studies of chronosequences are useful in detecting general patterns of vegetation change21, the most interesting early-phase filtering and assembly processes remained hidden because of broad age categories used in most studies. In the current paper we analysed vegetation patterns during the first 12 years of secondary succession after heavy goose grazing in an acidic sand area. We used a permanent plot setup and trait-based analyses to address the following hypotheses: (i) Former research suggests that early vegetation development is characterised by stochastic processes and the interaction of abiotic and biotic filtering become increasingly important driver of vegetation changes in the later period12,22. Thus, we expected high fluctuations in the trait values in the first years; and later a temporally divergent change in trait patterns of sites with different vertical position. (ii) It was pointed out that regenerative traits like seed bank formation and dispersal type are in general more crucial for the vegetation development in the first period of succession, while vegetative traits related to competition and establishment become more important later19,23. Thus, we expected different temporal patterns in the functional diversity of regenerative and vegetative traits.
Methods
Study site and vegetation sampling. Our sample sites were located at the Martinka Pasture nature reserve situated 15 km to the east from the city of Debrecen, East Hungary (a 2.8 km2 large area situated N 47°34′00″–35′20″, E 21°46′30″–48′40″). The climate of the nature reserve is moderately continental with a mean annual precipitation of 600 mm and a mean annual temperature of 10 °C, but large fluctuations in mean tem- peratures and precipitation are rather typical24. In the studied time period of 12 years, 1998, 1999 and 2002 were those with high precipitation (i.e. with at least 25% above the average), whereas the dry years (i.e. with at least 25% below the average) were 1992, 1993 and 2000. The study area is covered with 3–10 m high dunes formed from acidic sand, separated with flat dune slacks and channels. The vegetation is characterised by sand grassland communities at the dune tops and slopes and with various wet meadows and marshes in the dune slacks.
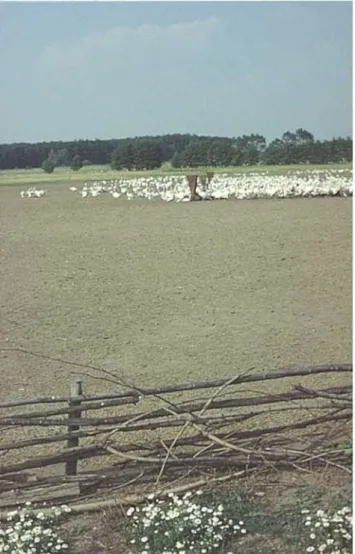
The area was traditionally used for cattle and sheep grazing, but in the late '80s large areas were fenced and tens of thousands of domestic geese were kept with supplementary feeding until the denudation of the original vegetation24. After the almost complete elimination of the vegetation the fences were translocated to another place covered with grassland vegetation (Fig. 1). This type of management resulted in a large-scale degradation of the sandy grassland areas, but also provided excellent objects for studying secondary grassland succession.
Four sites located at former goose farms with different elevation were selected for the study. All farms were abandoned in 1990 and vegetation recording started in the following year, 1991. Two sites were situated at 2.1–
2.9 m (measured from the dune slack), near to the dune top (in the followings high positioned sites U1 and U2) and two sites at the lower part of the dune slope, at 1.5 m measured from the dune slack (in the followings low positioned sites L1 and L2). Two sites were located at the eastern (U1, L1), while two sites (U2, L2) at the western part of the nature reserve. The sites were subjected to low intensity sheep and cattle grazing and spontaneous suc- cession during the study period. At each site, altogether five, 4-m2 plots were permanently marked in 1991, and the vegetation cover was recorded using a percentage scale in every year in early summer.
Traits. Altogether 15 functional plant traits were considered in the analyses. Out of the analysed traits there were seven traits related to growth, vegetative spread and competitive ability of plants (referred to as ‘vegetative’
traits in the followings) and eight regenerative traits including traits of generative reproduction, spatial dispersal and persistence (based on the classification of Purschke et al.16).
As vegetative traits we included four leaf traits (leaf area, leaf dry weight, leaf dry matter content and specific leaf area), plant height, life form and clonal spreading ability into the analyses. Leaf area (LA), leaf dry weight (LDW), leaf dry matter content (LDMC) and specific leaf area (SLA) were obtained either (i) from the LEDA trait database25, (ii) from local measurements of Lhotsky et al.26 (iii) or we used own measurements obtained by using standardised measurement protocols27. To obtain plant height and life form data we used the reference work of the Pannonian flora28. For the plant height we considered the mean of the plant height extremes provided for each species. Qualitative data for plant life form were transformed to an ordinal scale based on the potential life span of each category: (1) annuals, (2) biennials, (3) hemicryptophytes and geophytes, (4) chamaephytes. For clonal spreading ability we used the CLO-PLA database29 and classified the species into four ordinal categories based on potential distance of lateral spreading: (1) no clonal spreading, (2) < 0.01 m/year, (3) 0.01–0.25 m/year, and (4)
>0.25 m/year.
Eight traits related to generative reproduction were considered: flowering start, flowering period, the rate of wind pollination, insect pollination and self-pollination, seed weight and terminal velocity (as proxies for
seed dispersal), and seed bank type. The starting month of flowering (on an ordinal scale) and flowering period (number of months of flowering) were obtained from Király28. For pollination type (wind pollination, insect pollination and likeliness of self-pollination) we used presence/absence data from the LEDA25 and BiolFlor data- bases30 and missing data of species were completed by our own evaluations of flower morphology. As proxies of spatial seed dispersal we used datasets of seed weight and terminal velocity. Seed weights were obtained from Török et al.31,32 and from other own unpublished seed weight data of the Pannonian flora, while terminal velocity scores were obtained from the LEDA traitbase25 or the D3 database30. For seed bank types we used the ordinal classification of Thompson et al.33 with three categories: (i) transient, (ii) short-term persistent and (iii) long-term persistent. We used two sources of seed bank types: first, species data were obtained from Thompson et al.33 where longevity indices (LI) were calculated based on the published records (i.e. the proportion of non-transient records in the database). These data were transformed to an ordinal scale (i.e. transient = LI ≤ 0.33, short-term persis- tent = 0.34 ≤ LI < 0.67, and long-term persistent = 0.67 ≤ LI). We also obtained seed persistence data from data- sets of local experts who have been collecting persistent seed bank data of the Pannonian flora for more than two decades (Matus & Török unpublished data). The missing species data were completed using this latter-mentioned data source and other published seed bank records of the region34,35.
Data processing and analyses. For a limited set of low cover species we could not obtain some of the trait data; thus, we omitted these species from the analyses (Amaranthus albus, Crataegus monogyna, Hibiscus trionum, and Trifolium diffusum). Horsetail species Equisetum arvense and E. ramosissimum were not considered during the analyses of pollination and dispersal traits. We calculated community-weighted means (CWMs) and single trait variance (FDVar) for each trait, and multi-trait functional richness (FRic), functional evenness (FEve), and functional divergence (FDiv)36,37 using all traits in exception of presence/absence traits of pollination. We also calculated the multi-trait indices separately for the vegetative and regenerative trait groups. For the calculation of all the indices, we used the FDiversity program package; we used Gower distance measure using species cover scores for weighting38. To analyse the effect of total cover change on each of the functional diversity metrics, we calculated Spearman rank-correlation.
Figure 1. A typical goose farm in 1989 established in a former sand grassland stand in the study area. (photo by G. Matus).
Temporal and spatial trends in the datasets were analysed using two-way repeated measures GLM, where
‘site’ was included as fixed factor, ‘successional time (years)’ was included as repeated measure factor. Dependent variables were the followings: cover weighted CWMs and FDVar of all traits, FRic, FEve, and FDiv overall and considering the group of vegetative and regeneration traits separately. For significant site-dependent effects vali- dated by the two-way repeated measure GLMs, we used one-way repeated measure GLM and Tukey test for each date. All statistical computations were done in SPSS 20.0.
Results
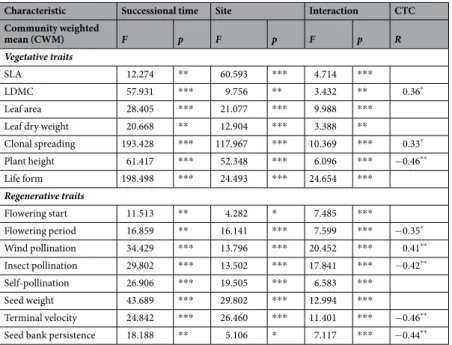
Overall temporal patterns in traits. We found marked temporal changes in the studied vegetative func- tional characteristics of the vegetation during the 12 years of secondary succession (Tables 1 and 2). We found a marked increase in community-weighted means (CWMs) of clonal spreading (Fig. 2A), life span (Fig. 2B), and LDMC (Fig. 2F). In parallel, we found a trend of decrease in the CWMs of plant height (Fig. 2C) and SLA (Fig. 2G). In the figures of leaf area (Fig. 2E) and leaf dry weight (Fig. 2D) the temporal pattern was not so obvi- ous, but higher scores were typical, especially in U1 site in the later period of succession. In all cases we detected site specific effects and also the interaction of successional time and site was significant. The total cover showed high fluctuations during succession; the change in CWMs of LDMC, and clonal spreading were positively, while the CWM of plant height was negatively affected by the change of total cover (Table 1).
All of the CWMs of regenerative traits changed with successional time (Table 1). We found an increase in the CWMs of wind pollination (Fig. 3F), and a decrease in that of flowering start (Fig. 3D) and flowering period (Fig. 3C) regardless to site, but the latter two variables were characterised with a sharp drop in scores between the first and second year. In contrast, we found a temporal decrease in the CWMs of seed bank persistence (Fig. 3A) and terminal velocity (Fig. 3E). For the CWMs of seed weight (Fig. 3B) and insect pollination (Fig. 3G), the tem- poral trends were not obvious. For all studied traits, high fluctuations in scores were typical during the course of succession and a strong site-dependent effect and significant effect of the interaction between successional time and site were validated (Table 1). The total cover correlated positively with the CWM of wind pollination but negatively with the CWMs of flowering period, insect pollination, terminal velocity and seed bank persistence (Table 1).
Effect of vertical position on functional characteristics. Almost all studied functional characteristics were affected by the site (Tables 1 and 2). From 1997–98 onwards, from the vegetative traits the CWMs of leaf area, leaf dry weight, and plant height (Fig. 2), and the FDVars of LDMC, leaf dry weight, and life form were higher at the high positioned sites (U1 and U2, Supplementary Figure S1). From the regenerative traits the CWMs of insect pollination, seed weight, and terminal velocity (Fig. 3), and the FDVars of flowering start and seed weight were higher at the high-positioned sites (U1 and U2; Supplementary Figure S2). In contrast, the CWMs of clonal spreading (Fig. 2A), wind pollination and self-pollination (Fig. 3F,H), and the FDVar of flowering period (Supplementary Figure S2J) were higher at the low-positioned sites (L1 and L2). For the other traits no such clear separation was detected along the vertical position and they were characterised by high year-to-year fluctuations.
Characteristic Successional time Site Interaction CTC
Community weighted
mean (CWM) F p F p F p R
Vegetative traits
SLA 12.274 ** 60.593 *** 4.714 ***
LDMC 57.931 *** 9.756 ** 3.432 ** 0.36*
Leaf area 28.405 *** 21.077 *** 9.988 ***
Leaf dry weight 20.668 ** 12.904 *** 3.388 **
Clonal spreading 193.428 *** 117.967 *** 10.369 *** 0.33*
Plant height 61.417 *** 52.348 *** 6.096 *** −0.46**
Life form 198.498 *** 24.493 *** 24.654 ***
Regenerative traits
Flowering start 11.513 ** 4.282 * 7.485 ***
Flowering period 16.859 ** 16.141 *** 7.599 *** −0.35*
Wind pollination 34.429 *** 13.796 *** 20.452 *** 0.41**
Insect pollination 29.802 *** 13.502 *** 17.841 *** −0.42**
Self-pollination 26.906 *** 19.505 *** 6.583 ***
Seed weight 43.689 *** 29.802 *** 12.994 ***
Terminal velocity 24.842 *** 26.460 *** 11.401 *** −0.46**
Seed bank persistence 18.188 ** 5.106 * 7.117 *** −0.44**
Table 1. Effects of site and successional time on community-weighted means (CWMs) of vegetative and regenerative traits in recovering sand grasslands. Two-way repeated measure GLM with ‘site’ as fixed and
‘successional time’ as repeated measure factor. Notations: CTC – correlation with total cover. Significance levels:
n.s. = non-significant; *0.01 ≤ p < 0.05; **0.001 ≤ p < 0.01, ***p < 0.001.
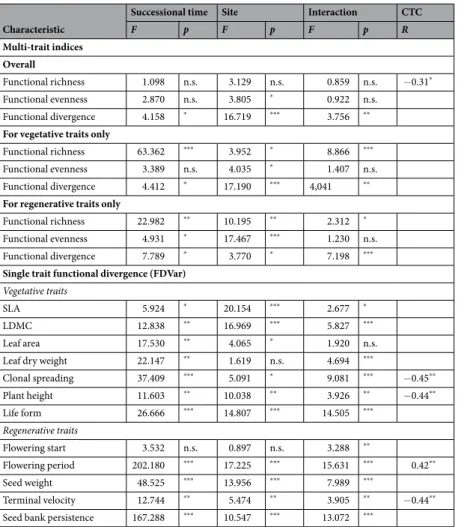
Patterns of vegetative and regenerative multi-trait functional diversity. Overall functional rich- ness and evenness were not affected by successional time (Table 2). Overall functional divergence was signifi- cantly affected by successional time, site and their interaction, but it displayed quite large fluctuations especially in the first few years. The functional richness and evenness of vegetative and regenerative traits, when analysed sep- arately, were mostly significantly affected by the successional time, site and their interaction (Table 2, Fig. 4). The functional evenness of vegetative traits was only affected by the site, while that of regenerative traits was affected both by successional time and site, but was not affected by their interaction and displayed a slightly decreasing trend with high fluctuations (Table 2). Except for the overall functional richness none of the multi-trait indices were correlated with the total cover (Table 2.).
In the early years, we found very low scores for functional richness of vegetative traits (Fig. 4A). After some years, scores for functional richness increased considerably on sites near to the dune top (U1, U2) compared to sites near to the dune slacks (L1, L2). For the functional richness of the regenerative traits, we found somewhat opposite trends, but in both cases a divergent vegetation development was also typical (Fig. 4D). For the func- tional divergence, there were some overall temporal increase in values with somewhat higher scores in lower lying sites (Fig. 4B,E). For functional evenness, a similar, but opposite, pattern was detected (Fig. 4C,F).
Discussion
Temporal patterns in traits. We hypothesised that the early vegetation development is characterised by stochastic processes displayed by high fluctuations of trait values, but later vegetation development is driven by the interaction of biotic and abiotic filtering displayed in a divergent vegetation development of low (L1 and L2) and high positioned (U1 and U2) sites. These assumptions were mostly confirmed by our results as especially in the first two to three years most traits displayed high fluctuations and no clear patterns for divergent vegetation development was found for most of the studied traits. In secondary succession, there are in general two sources of plant establishment – spatial dispersal of propagules and establishment from the local propagule banks (i.e.
in most cases from local soil seed banks39). Following grazing by domestic goose, which also causes elevated soil fertility by phosphorous and potassium accumulation, the first few years are characterised by short-lived plant
Characteristic
Successional time Site Interaction CTC
F p F p F p R
Multi-trait indices Overall
Functional richness 1.098 n.s. 3.129 n.s. 0.859 n.s. −0.31*
Functional evenness 2.870 n.s. 3.805 * 0.922 n.s.
Functional divergence 4.158 * 16.719 *** 3.756 **
For vegetative traits only
Functional richness 63.362 *** 3.952 * 8.866 ***
Functional evenness 3.389 n.s. 4.035 * 1.407 n.s.
Functional divergence 4.412 * 17.190 *** 4,041 **
For regenerative traits only
Functional richness 22.982 ** 10.195 ** 2.312 *
Functional evenness 4.931 * 17.467 *** 1.230 n.s.
Functional divergence 7.789 * 3.770 * 7.198 ***
Single trait functional divergence (FDVar) Vegetative traits
SLA 5.924 * 20.154 *** 2.677 *
LDMC 12.838 ** 16.969 *** 5.827 ***
Leaf area 17.530 ** 4.065 * 1.920 n.s.
Leaf dry weight 22.147 ** 1.619 n.s. 4.694 ***
Clonal spreading 37.409 *** 5.091 * 9.081 *** −0.45**
Plant height 11.603 ** 10.038 ** 3.926 ** −0.44**
Life form 26.666 *** 14.807 *** 14.505 ***
Regenerative traits
Flowering start 3.532 n.s. 0.897 n.s. 3.288 **
Flowering period 202.180 *** 17.225 *** 15.631 *** 0.42**
Seed weight 48.525 *** 13.956 *** 7.989 ***
Terminal velocity 12.744 ** 5.474 ** 3.905 ** −0.44**
Seed bank persistence 167.288 *** 10.547 *** 13.072 ***
Table 2. Effects of site and successional time on the functional diversity and single-trait functional divergence of recovering sand grasslands. Two-way repeated measure GLM with ‘site’ as fixed and ‘successional time’
as repeated measure factor. Notations: CTC – correlation with total cover (Spearman rank-correlation).
Significance levels: n.s. = non-significant; *0.01 ≤ p < 0.05; **0.001 ≤ p < 0.01, ***p < 0.001. For the nominal traits (pollination types) single-trait functional divergence was not calculated.
assemblages recruited both from the seed banks and spatial dispersal35. Populations of short-lived species are strongly influenced by the year-to-year fluctuations in weather (mostly by changes in precipitation) and are not able to form a stable plant community without regular propagule input and disturbance40. Thus, in the course of succession the short-lived weedy assemblages are replaced by more stress-tolerant, frequently clonally spreading perennials41. In terms of traits, this trend was also validated by our data. We found increasing rates of clonality Figure 2. Temporal change of community-weighted means (CWMs) of vegetative traits. Notations: rectangle – sites at the eastern part of the reserve; circle – sites in the western part of the reserve; blue – sites laying near to the dune top; red – sites laying near to the dune slack. Significant differences were indicated by superscript letters (Univariate GLM and Tukey test). Clonal spreading ability was based on the four ordinal categories of the CLO-PLA database29; while life form was based on qualitative data for plant life form transformed to an ordinal scale based on the potential life span of each category.
and perenniality in the studied time period of secondary succession. This shift causes a decrease in the availability of free regeneration gaps and in the species turnover, and also slowed-down vegetation succession42.
Traits and community assembly. We hypothesised that there will be different temporal patterns in the functional diversity of regenerative and vegetative traits. This assumption was only weakly supported by our Figure 3. Temporal change of community-weighted means (CWMs) of regenerative traits. Notations: rectangle – sites at the eastern part of the reserve; circle – sites in the western part of the reserve; blue – sites laying near to the dune top; red – sites laying near to the dune slack. Significant differences were indicated by superscript letters (Univariate GLM and Tukey test). Seed bank persistence was based on the ordinal classification of Thompson et al.33 with three categories; while wind pollination, insect pollination and self-pollination values are the rate of presence/absence data from LEDA25 and BiolFlor30.
results. While there were some distinct patterns found for the functional richness of vegetative and regenerative traits, for functional divergence and evenness no clear distinctive pattern was detected. However, it should be noted that an overall increase in functional divergence was detected both in vegetative and regenerative traits.
Increasing functional divergence – especially for those traits which are strongly related to competition – is gen- erally considered as a signal of increased niche differentiation and increased magnitude of competition43,44. It was stressed by Butterfield et al.14 that multi-trait indices may not be strong predictors of community change compared to single traits related to environmental gradients. This may be because multi-trait indices combine Figure 4. Temporal change of multi-trait indices of functional richness (FRich), functional divergence (FDiv) and functional evenness (FEve) for the vegetative (on the left) and regenerative traits (on the rigth). Notations:
rectangle – sites at the eastern part of the reserve; circle – sites in the western part of the reserve; blue – sites laying near to the dune top; red – sites laying near to the dune slack. Significant differences were indicated by superscript letters (Univariate GLM and Tukey test).
several single traits displaying contrasting temporal trends during succession, and it was also demonstrated by our results.
Similar temporal changes in life forms, seed bank persistence (i.e. seed longevity), LDMC and SLA were also validated by Purschke et al.16, but on a much longer time-scale in a space-for-time analysis. For LDMC and SLA the same trends were detected also by Kelemen et al.23. A decreasing trend in flowering period and flowering start was also detected by Douma et al.17. There were some traits like life-form (as a proxy of the life-span of plants), LDMC, SLA, seed bank persistence or flowering period, where strong increasing or decreasing temporal trends in their CWMs were detected, but we observed no divergent or convergent change. This may suggest that the changes in the CWMs of these traits may be rather general features of secondary succession.
In former research explaining community assembly two contrasting views are mentioned by Schleicher et al.19. First, the (trait-) neutral theory of species assembly explains the community assembly as a stochastic process (governed by priority vs. mass effects and stochastic population dynamics) which outcome is strongly influenced by the locally available species pool and site history in form of the legacy of former management and species composition (i.e. soil fertility and seed banks39,45,46). Second, the theory of functional filtering suggests that com- munity assembly is trait-driven, which phenomenon is well expressed by the divergent or convergent vegetation development significantly differing from a random assembly47. In our study we found evidence for both theories.
The vegetation of the first few years (especially the first year) was strongly influenced by the legacy of former vegetation and by local dispersal and establishment processes. For many traits we found that sites in similar topo- graphic position (i.e. sites with different vertical position in eastern and western part of the national reserve) were more similar to each other than to sites with different topographic but similar vertical position. This is clearly visible for the CWMs of clonal spreading, leaf area, SLA, seed bank persistence, or terminal velocity. Thus, the first few years’ vegetation development can be at least partly explained by the trait neutral theory of vegetation development. In most cases this effect was diminished later on, or even an effect of filtering was detected in form of convergent change in some traits like clonal spreading, plant height, leaf area, terminal velocity, or pollination types in sites with similar vertical but different topographical position.
To sum up, we found that both trait neutrality and filtering effects can be tracked in the vegetation changes during the first period of secondary grassland succession. Initially, species establishment is influenced by local abiotic conditions and is a highly stochastic process that is reflected by the high fluctuations in trait values. Later, with increasing rate of clonality and perenniality, the community became more stable and the species assembly became governed by the interaction of abiotic and biotic filtering (i.e. altered competitive ability of species under different environmental stress) expressed clearly by divergent vegetation development (i.e. divergence in CWMs and FDVars of respective traits) of sites with different vertical position. High fluctuations in some trait values, however, were typical during the whole study period, which underlines that the effect of stochastic processes was especially important also in later stages in vegetation development.
Data Availability
The authors intend to archive all data in Dryad Digital Repository upon acceptance.
References
1. Török, P. & Dengler, J. In: Grasslands of the world: diversity, management and conservation. Palaearctic grasslands in transition:
overarching patterns and future prospects. (eds Squires, V. R., Dengler, J., Feng, H. & Limin, H.) 15–26 (CRC Press, 2018).
2. Keddy, P. Assembly and response rules: two goals for predictive community ecology. J. Veg. Sci. 3, 157–164 (1992).
3. Cramer, V. A., Hobbs, R. J. & Standish, R. J. What’s new about old fields? Land abandonment and ecosystem assembly. Trends Ecol.
Evol. 23, 104–112 (2008).
4. Hubbell, S. P. The unified neutral theory of biodiversity and biogeography. (Princeton University Press, Princeton, 2001).
5. Gleason, H. A. The individualistic concept of the plant association. B. Torrey Bot. Club 53, 7–26 (1926).
6. Egler, F. Vegetation science concepts I. Initial floristic composition, a factor in old-field vegetation development. Vegetatio 4, 412–417 (1954).
7. Wilson, J. B., Gitay, H., Roxburgh, S. H., King, W. M. & Tangney, R. S. Egler’s concept of ‘Initial floristic composition’ in succession - ecologists citing it don’t agree what it means. Oikos 64, 591–593 (1992).
8. Clements, F. E. Plant succession. (Carnegie Institute, Washington, 1916).
9. Drury, W. H. & Nisbet, I. C. T. Succession. J. Arnold Arboretum 54, 331–368 (1973).
10. Connell, J. H. & Slatyer, R. O. Mechanisms of succession on natural communities and their role in community stability and organization. Amer. Natur. 111, 1119–1144 (1977).
11. Leibold, M. A. et al. The metacommunity concept: a framework for multiscale community ecology. Ecol. Lett. 7, 601–613 (2004).
12. Deák, B. et al. Micro-topographic heterogeneity supports plant diversity: fine-scale patterns and age effect. Basic Appl. Ecol. 16, 291–299 (2015).
13. Garnier, E. & Navas., M.-L. A trait-based approach to comparative functional plant ecology: concepts, methods and applications for agroecology. A review. Agron. Sustain. Dev. 32, 365–399 (2012).
14. Butterfield, B. J. & Suding, K. N. Single-trait functional indices outperform multi-trait indices in linking environmental gradients and ecosystem services in a complex landscape. J. Ecol. 101, 9–17 (2013).
15. Kahmen, S. & Poschlod, P. Plant functional trait responses to grassland succession over 25 years. J. Veg. Sci. 15, 21–32 (2004).
16. Purschke, O. et al. Contrasting changes in taxonomic, phylogenetic and functional diversity during a long-term succession: insights into assembly processes. J. Ecol. 101, 857–866 (2013).
17. Douma, J. C., de Haan, M. W. A., Aerts, R., Witte, J.-P. M. & van Bodegom, P. M. Succession-induced trait shifts across a wide range of NW European ecosystems are driven by light and modulated by initial abiotic conditions. J. Ecol. 10, 366–380 (2012).
18. Letten, A. D., Keith, D. A. & Tozer, M. G. Phylogenetic and functional dissimilarity does not increase during temporal heathland succession. Proc. R. Soc. B 281, 20142102 (2014).
19. Schleicher, A., Peppler-Lisbach, C. & Kleyer, M. Functional traits during succession: is plant community assembly trait-driven?
Preslia 83, 347–370 (2011).
20. Albert, Á.-J. et al. Secondary succession in sandy old fields: a promising example of spontaneous grassland recovery. Appl. Veg. Sci.
17, 214–224 (2014).
21. Walker, L. R., Wardle, D. A., Bardgett, R. D. & Clarkson, B. D. The use of chronosequences in studies of ecological succession and soil development. J. Ecol. 98, 725–736 (2010).
22. Latzel, V. et al. The association of dispersal and persistence traits of plants with different stages of succession in Central European man-made habitats. Folia Geobot. 46, 289–302 (2011).
23. Kelemen, A. et al. Old-field succession revisited - New aspects revealed by trait-based analyses of perennial-crop-mediated succession. Ecol. Evol. 7, 1–9 (2017).
24. Török, P., Matus, G., Papp, M. & Tóthmérész, B. Secondary succession of overgrazed Pannonian sandy grasslands. Preslia 80, 73–85 (2008).
25. Kleyer, M. et al. The LEDA Traitbase: a database of life-history traits of the Northwest European flora. J. Ecol. 96, 1266–1274 (2008).
26. Lhotsky, B. et al. Changes in assembly rules along a stress gradient from open dry grasslands to wetlands. J. Ecol. 104, 507–517 (2016).
27. Cornelissen, J. H. C. et al. A handbook of protocols for standardised and easy measurement of plant functional traits worldwide.
Aust. J. Bot. 51, 335–380 (2003).
28. Király, G. Új magyar füvészkönyv. Magyarország hajtásos növényei. New Hungarian Herbal. The Vascular Plants of Hungary.
Identification keys]. Aggtelek National Park Directorate, Jósvafő (Aggteleki Nemzeti Park Igazgatóság, 2009).
29. Klimešová, J. & de Bello, F. CLO-PLA: the database of clonal and bud bank traits of Central European flora. J. Veg. Sci. 20, 511–516 (2009).
30. Kattge, J. et al. A generic structure for plant trait databases. Methods Ecol. Evol. 2, 202–213 (2011).
31. Török, P. et al. Seed weights support social behaviour types—analysis and new thousand seed weight records of the Pannonian flora.
Acta Bot. Hung. 55, 429–472 (2013).
32. Török, P. et al. New measurements of thousand-seed weights of species in the Pannonian Flora. Acta Bot. Hung. 58, 187–198 (2016).
33. Thompson, K., Bakker, J. P. & Bekker, R. M. Soil seed banks of North West Europe: methodology, density and longevity. (Cambridge University Press, 1997).
34. Matus, G., Tóthmérész, B. & Papp, M. Restoration prospects of abandoned species-rich sandy grassland in Hungary. Appl. Veg. Sci.
6, 169–178 (2003).
35. Török, P., Matus, G., Papp, M. & Tóthmérész, B. Seed bank and vegetation development of sandy grasslands after goose breeding.
Folia Geobot. 44, 31–46 (2009).
36. Villéger, S., Mason, N. W. & Mouillot, D. New multidimensional functional diversity indices for a multifaceted framework in functional ecology. Ecology 89, 2290–2301 (2008).
37. Pla, L., Casanoves, F. & Di Rienzo, J. Quantifying Functional Biodiversity. (Springer, 2012).
38. Casanoves, F., Pla, L. E. & Di Rienzo, J. A. FDiversity: an Integrated Tool to Estimate and Analyze Functional Diversity. The Bulletin of the Ecological Society of America 92, 147–152 (2011).
39. Bossuyt, B. & Honnay, O. Can the seed bank be used for ecological restoration? An overview of seed bank characteristics in European communities. J. Veg. Sci. 19, 875–884 (2008).
40. Řehounková, K. & Prach, K. Life-history traits and habitat preferences of colonizing plant species in long-term spontaneous succession in abandoned gravel–sand pits. Basic Appl. Ecol. 11, 45–53 (2010).
41. Prach, K. & Pyšek, P. Clonal plants – What is their role in succession? Folia Geobot. 29, 307–320 (1994).
42. Lepš, J. Vegetation dynamics in early old field succession: a quantitative approach. Vegetatio 72, 95–102 (1987).
43. Mason, N. W. H., Mouillot, D., Lee, W. G. & Wilson, J. B. Functional richness, functional evenness and functional divergence: the primary components of functional diversity. Oikos 111, 112–118 (2005).
44. Grime, J. P. Trait convergence and trait divergence in herbaceous plant communities: mechanisms and consequences. J. Veg. Sci. 17, 255–260 (2006).
45. Valkó, O., Török, P., Tóthmérész, B. & Matus, G. Restoration potential in seed banks of acidic fen and dry-mesophilous meadows:
Can restoration be based on local seed banks? Rest. Ecol. 19, 9–15 (2011).
46. Török, P. et al. Recovery of native grass biodiversity by sowing on former croplands: Is weed suppression a feasible goal for grassland restoration? J. Nat. Conserv. 20, 41–48 (2012).
47. Laughlin, D. C., Joshi, C., van Bodegom, P. M., Bastow, Z. A. & Fule, P. Z. A predictive model of community assembly that incorporates intraspecific trait variation. Ecol. Lett. 15, 1291–1299 (2012).
Acknowledgements
The authors are indebted to the support of NKFIH K 119225 (PT), KH 129483 (PT), K 116639 (BT) and KH 126477 (BT) proposals during manuscript preparation. AK was funded by the MTA’s Postdoctoral Research Program.
Author Contributions
G.M. and P.T. conceived and designed the study; M.P., G.M. and P.T. carried out the field work; P.T., E.T. and A.K.
collected and analysed the data; P.T., J.S. and B.T. provided the first draft and all authors contributed critically to the drafts and gave final approval for publication.
Additional Information
Supplementary information accompanies this paper at https://doi.org/10.1038/s41598-018-32078-x.
Competing Interests: The authors declare no competing interests.
Publisher's note: Springer Nature remains neutral with regard to jurisdictional claims in published maps and institutional affiliations.
Open Access This article is licensed under a Creative Commons Attribution 4.0 International License, which permits use, sharing, adaptation, distribution and reproduction in any medium or format, as long as you give appropriate credit to the original author(s) and the source, provide a link to the Cre- ative Commons license, and indicate if changes were made. The images or other third party material in this article are included in the article’s Creative Commons license, unless indicated otherwise in a credit line to the material. If material is not included in the article’s Creative Commons license and your intended use is not per- mitted by statutory regulation or exceeds the permitted use, you will need to obtain permission directly from the copyright holder. To view a copy of this license, visit http://creativecommons.org/licenses/by/4.0/.
© The Author(s) 2018