0001-6373 © 2018 Akadémiai Kiadó, Budapest
THE VALUE OF A CHILD BORN IN THE EUROPEAN UNION*
Tamás ÁGH – Katalin GÁSPÁR – Balázs NAGY – Matthieu LEHMANN – Zoltán KALÓ
(Received: 15 August 2016; revision received: 3 November 2017;
accepted: 4 January 2018)
The objective of this study is to quantify the value of a child born in 27 EU countries and Switzer- land. The Human Capital (HC) approach was used to estimate the social benefi t arising from an additional childbirth. The value of a newborn child was calculated by summing up the discounted value of all expected future gross earnings of the individual, including an imputed value for house- hold production. The estimation takes into account life expectancy and the probability of being employed or in household production by age-groups. Input data was obtained from Eurostat and the Human Mortality Database. In 2012, the purchasing power parity adjusted present value (PV) of a newborn child was EUR 108.4 thousand in Bulgaria and EUR 803.6 thousand in Denmark. By applying the actual exchange rates, the difference between the lowest value (EUR 48.8 thousand in Bulgaria) and the highest value (EUR 1.1 million in Switzerland) was increased. The PV was highly sensitive to the discount rate. The fertility interventions are expected to gain popularities among other health priorities as a tool to counter generation ageing. However, in order to enhance fertility among other health priorities, policy-makers must take into account the full social value based on the local estimates.
Keywords: human capital approach, economic model, value of life, newborn child
JEL classifi cation indices: I18, J13, J17, J24
* This research was financially supported by Gedeon Richter Plc., Hungary. Authors gratefully acknowledge their support.
Tamás Ágh, Principal Researcher at the Syreon Research Institute, Budapest, Hungary. E-mail:
tamas.agh@syreon.eu
Katalin Gáspár, Senior Researcher at the Syreon Research Institute, Budapest, Hungary. E-mail:
gaspark2@hotmail.com
Balázs Nagy, Principal Researcher at the Syreon Research Institute, Budapest, Hungary and Senior Lecturer at Eötvös Loránd University (ELTE), Faculty of Social Sciences, Department of Health Policy and Health Economics, Budapest, Hungary. E-mail: balazs.nagy@syreon.eu
Matthieu Lehmann, Market Access Director at PregLem SA, Geneva, Switzerland.
E-mail: matthieu .lehmann@preglem.com
Zoltán Kaló, corresponding author. Professor at the Department of Health Policy and Economics , Institute of Economics, Faculty of Social Sciences, Eötvös Loránd University (ELTE) and Managing Director, Syreon Research Institute, Budapest, Hungary. E-mail: kalo@tatk.elte.hu;
zoltan.kalo@ syreon.eu.
1. INTRODUCTION
The number of births across Europe has been steadily declining since the past decades due to numerous socio-cultural, economic, educational and medical fac- tors (OECD 2014; Eurostat 2012a; Yli-Kuha 2012). Total fertility rate refers to the number of children that an average woman would have at the end of her childbearing years. In 2012, the total fertility rate was 1.58 in the European Union (EU), well below the rate 2.1 that is considered as the sufficient replacement rate for a population in order to maintain broad population stability (Eurostat 2012a;
OECD 2014).
In the EU, there is a trend that women postpone childbearing to older ages. In 2003, the mean age of women at childbirth was 29.2 years in the EU 27 countries (EU-27); however, by 2012 the mean maternal age increased to 30.2 years (Eu- rostat 2012a). Postponement of childbirth has led to a rise in the prevalence of infertility, as a woman’s ability to become pregnant and to carry a pregnancy to term is highly correlated with age (de Jong – Steenhof 2000). Furthermore, there are several diseases which may have a negative impact on the fertility of women.
Uterine fibroids are one of the most common causes of infertility (Wallach – Vlahos 2004). Among different types of interventions to cure the symptoms of fibroids, mainly severe bleeding and pain, hysterectomy is the ultimate solution.
However, it has two negative consequences. First, women may develop psycho- logical symptoms, either directly related to the loss of their uterus, or indirectly due to the loss of their fertility (WHO 2004). Second, after hysterectomy the society loses an opportunity to benefit from a child. This important social fac- tor is usually not taken into account, when evaluating the economic value of uterus preserving surgical, radiological or pharmaceutical interventions. In order to consider this important attribute, we need to know the probability of successful pregnancy after uterus preserving interventions and the value of a newborn child to the society.
There are several other medical interventions to improve fertility, such as in vitro fertilisation (Deonandan et al. 2000). The value judgment of these health technologies is similarly difficult as the uterus preserving interventions. Although the fertility policies are heavily influenced by several factors (Balbo et al. 2013), including local national norms and attitudes, the true value of any medical inter- ventions to facilitate fertility of women cannot be interpreted without understand- ing the societal value of a newborn child. In this study, the Human Capital (HC) approach was applied to quantify the social benefit of an additional childbirth in order to provide reference values to policy-makers and industry experts for set- ting health-policy objectives. This method equates the value of human life to the value of its expected lifetime productivity, which is generally calculated as the
Acta Oeconomica 68 (2018)
present value (PV) of future gross earnings plus the value of household produc- tion. In other words, the value of a medical intervention is worth the value of future expected change in one’s productivity due to the intervention (Landefeld – Seskin 1982). Despite that the HC method has been widely used to estimate the value of life in the health economic literature (Max et al. 2002; Malinowski et al.
2015; Haikonen et al. 2016), previous studies mainly presented calculations for individuals or a few arbitrarily selected countries. To our knowledge, no research has presented the comparable values for the EU countries.
The structure of the paper is as follows. Section 2 describes the data and the estimation technique. Section 3 summarises the estimation results, while Section 4 concludes.
2. DATA AND METHODOLOGY
According to the HC approach, the value of a child to society can be best evalu- ated in monetary terms by adding up the individual’s future gross earning and the value of household production. Applying the HC approach, the present value of a child (PVHC) can be derived as follows:
PVHC =
75 0
. *[ * . * . . *(1 )
( ) ]
(1 )
t
t t t t t t
t
Prob Surv FE Empl HP Dom Prod p
r
where Probt (Surv.) is the probability that the individual will survive to age t, FEt is the value of expected annual gross earnings of an individual at age t, Empl.t is the proportion of the population that is working at age t,
HPt is the average expected value of household production at age t,
Dom.Prod.t is the proportion of the population that is in domestic production at age t,
p is the expected annual labour productivity growth, and r is the expected discount rate.
The lifetime value of economic productivity was calculated for years that the individual spends in paid work or in household production from age 15. Using EU Labor Force Survey (EU-LFS) (Eurostat 2012b), the probability of being employed, self-employed or in household production at each year of life was estimated for 2012 for an average person in age-groups of 5 years adjusted to the age profile of each country. Regrettably, the EU-LFS sample beyond 75 years of age was not representative enough to evaluate productivity near the end of life.
Therefore, time-horizon of our analysis was maximised at 75 years.
The annual survival probabilities were obtained from the Human Mortality Database (2012) and from Eurostat mortality statistics (Eurostat 2012c). In the base case scenario, purchasing power parity (PPP) adjusted exchange rates were applied to convert results in local currencies to Euros. We reviewed the meth- odological guidelines for economic evaluations, and applied the country specific discount rates according to the local guidelines. In those cases, where the local guidelines were not available or the discount rate in local guidelines was not de- fined, we applied 3% rate.
2.1. Income data and the labour productivity growth
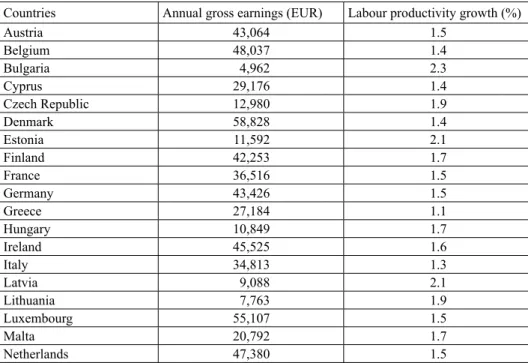
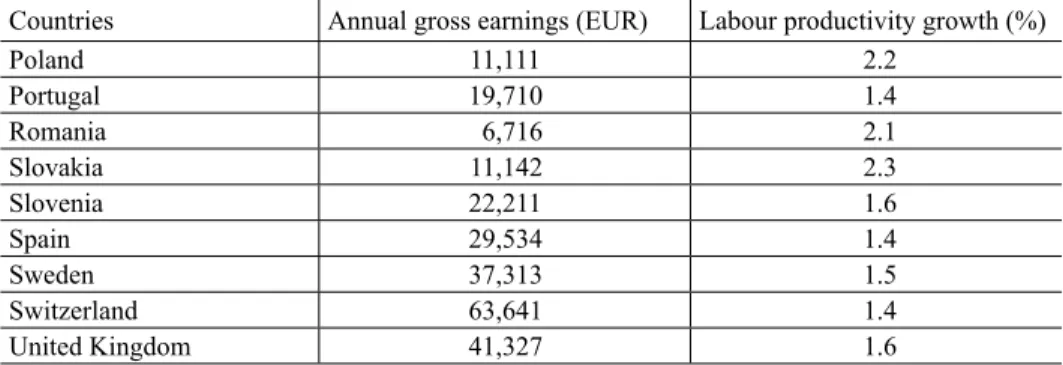
The age specific income data were taken from the Eurostat’s Structure of Earn- ings Survey (ESES) (Eurostat 2010). Annual gross earnings were used in EUR for 2010; this was indexed to 2012 using the annual consumer price index (Table 1).
From 2012, the real growth per year was assumed to follow the labour productiv- ity growth estimate presented by the European Commission for the years between 2005 and 2050 (Carone et al. 2006). It was assumed that the labour productivity growth in Switzerland will follow the Euro-zone average of 1.4%.
Table 1. Annual gross earnings and labour productivity growth, 2012
Countries Annual gross earnings (EUR) Labour productivity growth (%)
Austria 43,064 1.5
Belgium 48,037 1.4
Bulgaria 4,962 2.3
Cyprus 29,176 1.4
Czech Republic 12,980 1.9
Denmark 58,828 1.4
Estonia 11,592 2.1
Finland 42,253 1.7
France 36,516 1.5
Germany 43,426 1.5
Greece 27,184 1.1
Hungary 10,849 1.7
Ireland 45,525 1.6
Italy 34,813 1.3
Latvia 9,088 2.1
Lithuania 7,763 1.9
Luxembourg 55,107 1.5
Malta 20,792 1.7
Netherlands 47,380 1.5
Acta Oeconomica 68 (2018)
2.2. Household production
In order to appropriately estimate the “value of life” using the HC approach, the productivity of non-market work, such as household production, should be equal- ly taken into account. Traditionally, the value of household work is derived from a combination of time-diary survey results and data on the appropriate hourly wage for housekeeping activities (Dolan et al. 1980). However, due to the lack of a harmonised time-diary survey for all EU countries and data on appropriate hourly wages, the ratio of median gross hourly wage for low level of education to the median gross hourly wage for all skill-levels was calculated (Eurostat 2010).
This ratio was used to adjust average gross earnings. The household production was corrected for the probability of being in domestic production, Dom.Prod. t. According the EU-LFS (Eurostat 2012b), individuals who split their time be- tween paid and unpaid work were considered employed and thus were included in Empl.t. Therefore, our calculation conservatively takes into consideration the household production that is performed only on a full-time basis as an alternative to the paid employment.
The household production is only taken into consideration up to age 64, as in several countries retirees or other inactive individuals are incorrectly represented under this category, which would significantly skew the results upwards in these countries. Dom.Prod. t was not available for the Czech Republic, therefore an EU- 27 average was applied.
2.3. Sensitivity analyses
According to the recent guidelines, when future benefits can be valued in monetary terms, as in a cost-benefit analysis, they should be discounted at the same rate as costs, using a country-specific social discounting-rate somewhere between 0% and
Countries Annual gross earnings (EUR) Labour productivity growth (%)
Poland 11,111 2.2
Portugal 19,710 1.4
Romania 6,716 2.1
Slovakia 11,142 2.3
Slovenia 22,211 1.6
Spain 29,534 1.4
Sweden 37,313 1.5
Switzerland 63,641 1.4
United Kingdom 41,327 1.6
Sources: Eurostat 2010; Carone et al. 2006.
Table 1. cont.
5% (Gravelle – Smith 2001). Taking into consideration the long time horizon and the significance of discounting on the PVs, our paper presents sensitivity analyses using different discount rates (i.e., 0%, 1%, 3% and 5%) and the country-specific discount rates recommended in the methodological guidelines for health economic evaluations (Institue for Pharmaeconomic Research (IPF) 2006; Behmane et al.
2002; Belgian Health Care Knowledge Center 2012; Savova et al. 2015; Skoupa et al. 2014; Laakkeiden Hintalautakunta, Finland 2015; Haute Autorité de Santé, France 2012; Institute for Quality and Efficiency in Health Care, Germany 2017;
Ministry of Human Resources, Hungary 2017; Health Information and Quality Authority, Ireland 2014; Capri et al. 2001; Norwegian Medicines Agency 2012;
Zorginstituut Nederland, The Netherlands 2016; Agency for Health Technology Assessment, Poland 2009; INFRAMED 1998; Ministry of Health, Slovak Repub- lic 2011; Lopez-Bastida et al. 2010; Pharmaceutical Benefits Board, Sweden 2003;
NICE 2013). As health care payers apply the actual exchange rates for external price referencing of pharmaceuticals, we also calculated the PV by applying the actual annual exchange rates instead of the PPP adjusted exchange rates.
2.4. Limitations
The limitations of our study are similar to the general concerns related to the HC methodology, namely that the social costs associated with the rearing of a child are not taken into consideration. The marginal cost of education and healthcare (that is, building schools and hospitals) for additional children necessitates further investments. Taking these factors into consideration would moderate our results.
Only the gross earnings were considered in our calculation instead of the total labour cost, which also includes the labour related taxes levied on the employer.
As the HC approach takes into account the perspective of individuals, our esti- mates on the value of a newborn child are less than the societal benefit from the increased productivity.
In our analysis period, the age profiles were applied for deriving longitudinal conclusions. The potential changes in the population (e.g. wage, survival or mi- gration) may influence our conclusions. Finally, although we have considered the household production in our calculations, we could not fully correct for labour market imperfections.
3. RESULTS
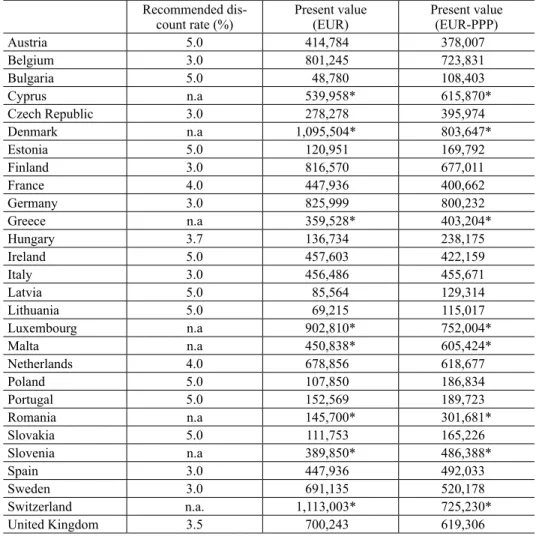
The PPP adjusted PV of a newborn child was between EUR 108.4 thousand in Bul- garia to EUR 803.6 thousand in Denmark in 2012 (Table 2). By applying the actual exchange rates, the difference between the lowest value (EUR 48.8 thousand in Bulgaria) and the highest value (EUR 1.113 million in Switzerland) was increased.
Table 2. Present values using recommended discount-rates, 2012 Recommended dis-
count rate (%) Present value
(EUR) Present value
(EUR-PPP)
Austria 5.0 414,784 378,007
Belgium 3.0 801,245 723,831
Bulgaria 5.0 48,780 108,403
Cyprus n.a 539,958* 615,870*
Czech Republic 3.0 278,278 395,974
Denmark n.a 1,095,504* 803,647*
Estonia 5.0 120,951 169,792
Finland 3.0 816,570 677,011
France 4.0 447,936 400,662
Germany 3.0 825,999 800,232
Greece n.a 359,528* 403,204*
Hungary 3.7 136,734 238,175
Ireland 5.0 457,603 422,159
Italy 3.0 456,486 455,671
Latvia 5.0 85,564 129,314
Lithuania 5.0 69,215 115,017
Luxembourg n.a 902,810* 752,004*
Malta n.a 450,838* 605,424*
Netherlands 4.0 678,856 618,677
Poland 5.0 107,850 186,834
Portugal 5.0 152,569 189,723
Romania n.a 145,700* 301,681*
Slovakia 5.0 111,753 165,226
Slovenia n.a 389,850* 486,388*
Spain 3.0 447,936 492,033
Sweden 3.0 691,135 520,178
Switzerland n.a. 1,113,003* 725,230*
United Kingdom 3.5 700,243 619,306
Sources: Institue for Pharmaeconomic Research (IPF) 2006; Behmane et al. 2002; Belgian Health Care Knowl- edge Center 2012; Savova et al. 2015; Skoupa et al. 2014; Laakkeiden Hintalautakunta, Finland 2015; Haute Autorité de Santé, France 2012; Institute for Quality and Efficiency in Health Care, Germany 2017; Ministry of Human Resources, Hungary 2017; Health Information and Quality Authority, Ireland 2014; Capri et al.
2001; Norwegian Medicines Agency 2012; Zorginstituut Nederland, The Netherlands 2016; Agency for Health Technology Assessment, Poland 2009; INFRAMED 1998; Ministry of Health, Slovak Republic 2011; Lopez- Bastida et al. 2010; Pharmaceutical Benefits Board, Sweden 2003; NICE 2013.
Notes: *assuming 3% discount rate; EUR-PPP: purchasing power parity in EUR; n.a.: not available.
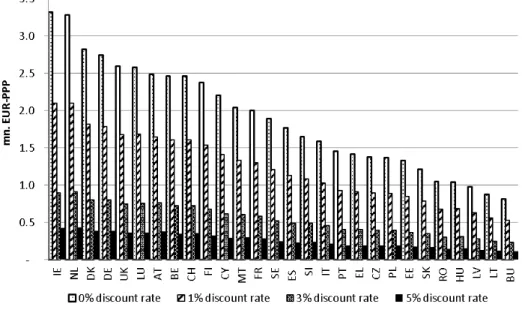
Applying different discount rates considerably altered the results, such as the PVs with 0% discount rate were 6.5-7.9 times higher than the PVs with 5% dis- count rate (Figure 1).
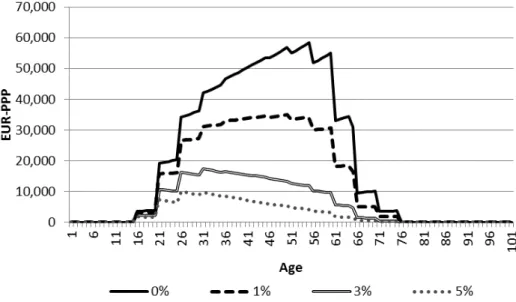
Figure 2 illustrates the average PV of earnings by age (i.e. weighted average of all countries). It increases between ages 16 and 25 as students exit educational programs and begin to work, and sharply rising between ages 20 and 26. It con- tinues to grow until 56 years and thereafter declines as the probability of employ- ment drops.
The lifetime share of household production in the expected PV was relatively small, less than 10% of the total value in most countries with the exception of Malta, Greece and Spain (Figure 3). Although average European people may spend almost equal time on household production compared to paid work, we did not take into account such activities for people who are at least partially em- ployed and above age 65. With less conservative assumptions the contribution of household economy to the PV of a newborn child would have been significantly greater.
Figure 1. Present value of a child using 0%, 1%, 3% and 5% discount-rates, EU-27 and Switzerland
Notes: EUR-PPP: Purchasing power parity in EUR, mn.: Million, AT: Austria, BE: Belgium, BU: Bulgaria, CH: Switzerland, CY: Cyprus, CZ: Czech Republic, DE: Germany, EE: Estonia, EL: Greece, ES: Spain, FI:
Finland, FR: France, DK: Denmark, HU: Hungary, IE: Ireland, IT: Italy, LT: Lithuania, LU: Luxemburg, LV:
Latvia, MT: Malta, NL: Netherlands, PL: Poland, PT: Portugal, RO: Romania, SE: Sweden, SI: Slovenia, SK:
Slovakia, UK: United Kingdom.
Acta Oeconomica 68 (2018) Figure 3. The lifetime share of household production in the expected present value using
3% discount rate, EU-27 and Switzerland Note: PV: Present value.
Figure 2. Present value of productivity by age using 0%, 1%, 3% and 5% discount-rates, weighted average of EU-27 and Switzerland
Note: EUR-PPP: Purchasing power parity in EUR.
The PV per GDP per capita varied between 6.3 (Lithuania) and 27.3 (Malta) (Table 3). These estimates are based on comparable methodology in order to pro- vide a reference for policy-makers and industry experts for setting health-policy
Table 3. Present values per GDP per capita using recommended discount rates, 2012 Recommended
discount-rate (%)
Present value
(EUR) GDP per capita (EUR)
Present value per GDP per capita
(EUR)
Austria 5.0 414,784 36,400 11.4
Belgium 3.0 801,245 34,000 23.6
Bulgaria 5.0 48,780 5,500 8.9
Cyprus n.a 539,958* 20,500 26.3
Czech Republic 3.0 278,278 14,600 19.1
Denmark n.a 1,095,504* 43,900 25.0
Estonia 5.0 120,951 13,000 9.3
Finland 3.0 816,570 35,500 23.0
France 4.0 447,936 31,100 14.4
Germany 3.0 825,999 32,600 25.3
Greece n.a 359,528* 17,400 20.7
Hungary 3.7 136,734 9,800 14.0
Ireland 5.0 457,603 35,700 12.8
Italy 3.0 456,486 25,700 17.8
Latvia 5.0 85,564 10,900 7.8
Lithuania 5.0 69,215 11,000 6.3
Luxembourg n.a 902,810* 80,700 11.2
Malta n.a 450,838* 16,500 27.3
Netherlands 4.0 678,856 35,800 19.0
Poland 5.0 107,850 9,900 10.9
Portugal 5.0 152,569 15,600 9.8
Romania n.a 145,700* 6,600 22.1
Slovakia 5.0 111,753 13,200 8.5
Slovenia n.a 389,850* 17,200 22.7
Spain 3.0 447,936 22,300 20.1
Sweden 3.0 691,135 42,800 16.1
Switzerland n.a. 1,113,003* 61,900 18.0
United Kingdom 3.5 700,243 30,200 23.2
Sources: Institue for Pharmaeconomic Research (IPF) 2006; Behmane et al. 2002; Belgian Health Care Knowl- edge Center 2012; Savova et al. 2015; Skoupa et al. 2014; Laakkeiden Hintalautakunta, Finland 2015; Haute Autorité de Santé, France 2012; Institute for Quality and Efficiency in Health Care, Germany 2017; Ministry of Human Resources, Hungary 2017; Health Information and Quality Authority, Ireland 2014; Capri et al.
2001; Norwegian Medicines Agency 2012; Zorginstituut Nederland, The Netherlands 2016; Agency for Health Technology Assessment, Poland 2009; INFRAMED 1998; Ministry of Health, Slovak Republic 2011; Lopez- Bastida et al. 2010; Pharmaceutical Benefits Board, Sweden 2003; NICE 2013; Eurostat 2012e.
Notes: *assuming 3% discount rate; n.a.: not available.
Acta Oeconomica 68 (2018) Figure 4. GDP per capita and present value using 3% discount-rate, EUR
Note: See Figure 1.
Figure 5. GDP per capita and present value using 3% discount-rate, EUR-PPP Note: See Figure 1.
objectives. Higher national income, measured by GDP per capita, was strong- ly positively correlated with average wages, and hence with the PV (Figures 4 and 5). After correcting for purchasing power, the only outlier was Luxembourg due to its larger than average GDP per capita. Further, there were some remark- able differences in the PVs among countries with similar national income, such as France and the UK (EUR 584 thousand and EUR 748 thousand in PPP using a 3% discount rate, respectively). Along with higher average annual gross earnings (around EUR 41 thousand in the UK and EUR 36 thousand in France), this can also be due to higher employment-rates and effective retirement ages in the UK compared to France (employment rates of 74.2% in the UK vs. 69.4% in France and effective retirement ages of approximately 63 years in the UK vs. 60 years in France) (OECD 2013; Eurostat 2012d).
4. CONCLUSIONS
Our study presents the social benefit arising from a child using the HC approach across the EU-27 and Switzerland. As the benefit is significant in each country, it should be an important value proposition of each pharmaceutical, medical de- vice or intervention with improved fertility and reduced infant mortality. Unfor- tunately this differential value is rarely taken into account by policy-makers at priority setting or by health-care payers in the pricing and reimbursement proc- ess of new health technologies. Current methodological guidelines of economic evaluations do not specifically address those benefits that are not directly related to the treated patient, e.g. if the mother is treated but the most important health and economic benefit is generated by the newborn child.
The second conclusion of this study is related to the fact that the PV of a new- born child is significantly different across the evaluated countries. In 2012, the PPP adjusted PV of a newborn child was EUR 108.4 thousand in Bulgaria and EUR 803.6 thousand in Denmark. By applying the actual exchange rates, the difference between the lowest value (EUR 48.8 thousand in Bulgaria) and the highest value (EUR 1.113 million in Switzerland) was increased. National GDP per capita was strongly positively correlated with average wages and the differ- ences in the PVs were highly sensitive to the country specific discount rates. This indicates that the economic value of health technologies is significantly different in EU member states, and consequently their prices should not be similar across countries. This can be easily implemented for health care interventions, such as in vitro fertilisation or uterus preserving surgical interventions. However, parallel trade and external price referencing prevents pharmaceutical manufacturers from implementing differential pricing strategy according to the economic status of
Acta Oeconomica 68 (2018)
countries for their new products. As such, taking into account the full social value of medicines is even more important in the lower income countries, where it is more difficult to justify relatively higher pharmaceutical prices compared to the local economic values.
REFERENCES
Agency for Health Technology Assessment, Poland (2009): Guidelines for Conducting Health Tech- nology Assessment. http://www.ispor.org/peguidelines/source/Poland_Guidelines-for-Conducting -HTA_English-Version.pdf
Balbo, N. – Billari, F. C. – Mills, M. (2013): Fertility in Advanced Societies: A Review of Research.
European Journal of Population, 29(1): 1–38.
Behmane, D. – Lambot, K. – Irs, A. – Steikunas, N. (2002): Baltic Guideline for Economic Evalu- ation of Pharmaceuticals (Pharmacoeconomic Analysis). Latvian Medicines Pricing and Reim- bursement Agency. http://www.zca.gov.lv/english/guidelines.html
Belgian Health Care Knowledge Centre. (2012): Belgian Guidelines for Economic Evaluations and Budget Impact Analyses: Second Edition. https://kce.fgov.be/sites/default/fi les/page_documents / KCE_183C_economic_evaluations_second_edition_0.pdf
Capri, S. – Ceci, A. – Terranova, L. – Morle, F. – Mantovani, L. (2001): Guidelines for Economic Evaluations in Italy: Recommendations from the Italian Group of Pharmacoeconomic Studies.
Drug Information Journal, 35(1): 189–201.
Carone, G. – Denis, C. – Mc Morrow, K. – Mourre, G. – Röger, W. (2006): Long-Term Labour Productivity and GDP Projections for the EU25 Member States: A Production Function Frame- work. European Economy - Economic Papers (European Commission DG ECFIN), 253: 1–92.
Deonandan, R. – Campbell, M. K. – Østbye, T. – Tummon, I. (2000): Toward a more Meaning- ful in Vitro Fertilization Success Rate. Journal of Assisted Reproduction and Genetics, 17(9):
498–503.
Dolan, T. J. – Hodgson, T. A. – Wun, W. M. (1980): Present Values of Expected Lifetime Earnings and Housekeeping Services, 1977. Hyattsville: National Center for Health Statistics, Division of Analysis.
Eurostat (2010): Structure of Earnings Survey (ESES) 2010. http://appsso.eurostat.ec.europa.eu/
nui/show.do?dataset=earn_ses_annual&lang=en
Eurostat (2012a): Fertility Statistics. http://epp.eurostat.ec.europa.eu/statistics_explained/index.
php/Fertility_statistics
Eurostat (2012b): European Union Labor Force Survey (EU-LFS) 2012.
Eurostat (2012c): Mortality Statistics. http://appsso.eurostat.ec.europa.eu/nui/show.
do?dataset=demo_mlifetable&lang=en
Eurostat (2012d): Employment Rate by Sex. http://ec.europa.eu/eurostat/tgm/table.do?tab=table&in it=1&language=en&pcode=tsdec420&plugin=1
Eurostat (2012e): Purchasing Power Parities, Price Level Indices and Real Expenditures for ESA95 Aggregates. http://appsso.eurostat.ec.europa.eu/nui/submitViewTableAction.do
Gravelle, H. – Smith, D. (2001): Discounting for Health Effects in Cost-Benefi t and Cost-Effective- ness Analysis. Health Econ, 10(7): 587–599.
Haikonen, K. – Lillsunde, P. M. – Lunetta, P. – Kokki, E. (2016): Economic Burden of Fire-Related Deaths in Finland, 2000-2010: Indirect Costs Using a Human Capital Approach. Burns, 42(1):
56–62.
Haute Autorité de Santé (2004): Choices in Methods for Economic Evaluation. https://www.
hassante .fr/portail/upload/docs/application/pdf/2012-10/choices_in_methods_for_economic_
evaluation.pdf
Health Information and Quality Authority, Ireland (2014): Guidelines for the Economic Evaluation of Health Technologies in Ireland. https://www.hiqa.ie/sites/default/fi les/2017-01/Revised_Eco- nomic_Guidelines_posted_100714.pdf
Human Mortality Database (2012): http://www.mortality.org
INFARMED (1998): Guidelines for Economic Drug Evaluation Studies. http://www.ispor.org/
peguidelines/source/PE%20guidelines%20in%20English_Portugal.pdf
Institute for Pharmaeconomic Research (IPF) (2006): Austrian Guidelines on Health Economic Evaluation, Consensus Paper. http://www.ispor.org/peguidelines/source/Guidelines_Austria.
Institute for Quality and Effi ciency in Health Care, Germany (2017): General Methods Version 5.0.
https://www.iqwig.de/download/Allgemeine-Methoden_Version-5-0.pdf
Laakkeiden Hintalautakunta, Finland (2015): Preparing a Health Economic Evaluation to Be Attached to the Application for Reimbursement Status and Wholesale Price for a Medicinal Prod- uct. http://www.hila.fi /c/document_library/get_fi le?folderId=793451&name=DLFE-9132.pdf Landefeld, J. S. – Seskin, E. P. (1982): The Economic Value of Life: Linking Theory to Practice.
American Journal of Public Health, 72(6): 555–566.
Lopez-Bastida, J. – Oliva, J. – Antonanzas, F. – Garica-Altes, A. – Gisbert, R. – Mar, J. – Puig- Junov, J. (2010): Spanish Recommendations on Economic Evaluation of Health Technologies.
European Journal of Health Economics, 11(5): 513–520.
Malinowski, K. P. – Kawalec, P. P. – Moćko, P. (2015): Indirect Costs of Absenteeism due to Rheumatoid Arthritis, Psoriasis, Multiple Sclerosis, Insulin-Dependent Diabetes Mellitus, and Ulcerative Colitis in 2012: A Study Based on Real-Life Data from the Social Insurance Institu- tion in Poland. Expert Review of Pharmacoeconomics & Outcomes Research, 16(2): 295–303.
Max, W. – Rice, D. P. – Sung, H. Y. – Martha, M. (2002): Valuing Human Life: Estimating the Present Value of Lifetime Earnings. San Francisco: Institute for Health & Aging.
Ministry of Health, Slovak Republic (2011): Guidelines for Economic Evaluation of Health Care Interventions. http://www.zakonypreludi.sk/zz/2011-422
Ministry of Human Resources, Hungary (2017): Az Emberi Erőforrások Minisztériuma szakmai irányelve az egészségügyi technológia értékelés módszertanáról és ennek keretében költ- séghatékonysági elemzések készítéséről (Professional healthcare guideline on the methodology of health technology assessment). Egészségügyi Közlöny, LXVI(3): 821–842.
NICE (2013): Guide to the Methods of Technology Appraisal 2013. http://www.nice.org.uk/article/
pmg9/resources/non-guidance-guide-to-the-methods-of-technology-appraisal-2013-pdf Norwegian Medicines Agency (2012): Guidelines on How to Conduct Pharmacoeconomic Analy-
ses. http://www.ispor.org/peguidelines/source/Norwegian_guidelines2012.pdf
OECD (2013): Statistics on Average Effective Age and Offi cial Age of Retirement in OECD Countries. http://www.oecd.org/els/public-pensions/ageingandemploymentpolicies-statisticson averageeffectiveageofretirement .htm
OECD (2014): OECD Factbook 2013: Economic, Environmental and Social Statistics. OECD Publishing. http://www.oecd-ilibrary.org/sites/factbook-2013-en/01/01/02/index.html?itemId=/
content/chapter/fact book-2013-2-en
Pharmaceutical Benefi ts Board, Sweden (2003): General Guidelines for Economic Evaluations.
http://www.ispor.org/peguidelines/source/Guidelines_in_Sweden.pdf
Acta Oeconomica 68 (2018) Savova, A. – Stoimenova, A. – Manova, M. – Zidarova, B. – Petrova, G. – Danchev, N. (2015):
Pharmacoeconomic Guideline for Positive Drug List Application Purposes Implemented in Bul- garia. Value Health, 18(7): A548.
Skoupa, J. – Annemans, L. – Hajek, P. (2014): Health Economic Data Requirements and Avail- ability in the European Union: Results of a Survey among 10 European Countries. Value Health Regional Issues, 4: 53–57.
Wallach, E. E. – Vlahos, N. F. (2004): Uterine Myomas: An Overview of Development, Clinical Features, and Management. Obstet Gynecol, 104(2): 393–406.
WHO (2004): Global Burden of Disease 2004 Update: Disability Weights for Diseases and Condi- tions. http://www.who.int/healthinfo/global_burden_disease/GBD2004_DisabilityWeights.pdf Yli-Kuha, A. N. (2012): Prevalence and Socio-Demographic Determinants of Infertility, Success of
Infertility Treatments and Health of Treated Women. Tampere: University of Tampere.
Zorginstituut Nederland, The Netherlands (2016): Guideline for Economic Evaluations in Health- care. https://www.ispor.org/PEguidelines/source/Netherlands_Guideline_for_economic_evalu- ations_in_healthcare.pdf