1 PREFERENCES OF HUNGARIAN CONSUMERS FOR
QUALITY, ACCESS AND PRICE ATTRIBUTES OF HEALTH CARE SERVICES – RESULT OF A DISCRETE CHOICE EXPERIMENT1
Petra Baji
Health Economics and Health Technology Assessment Research Centre; Corvinus University of Budapest; Hungary
Center for Public Affairs Studies Foundation, Budapest, Hungary
Department of Health Services Research; CAPHRI; Maastricht University Medical Center; Faculty of Health, Medicine and Life Sciences; Maastricht University; The Netherlands.
E-mail:petra.baji@uni-corvinus.hu
Milena Pavlova
Department of Health Services Research; CAPHRI; Maastricht University Medical Center; Faculty of Health, Medicine and Life Sciences; Maastricht University; The Netherlands.
László Gulácsi
Health Economics and Health Technology Assessment Research Centre; Corvinus University of Budapest; Hungary
Center for Public Affairs Studies Foundation, Budapest, Hungary
Wim Groot
Department of Health Services Research; CAPHRI; Maastricht University Medical Center; Faculty of Health, Medicine and Life Sciences; Maastricht University; The Netherlands.
Topinstitute Evidence-Based Education Research (TIER); Maastricht University; The Netherlands
ABSTRACT
In 2010, a household survey was carried out in Hungary among 1037 respondents to study consumer preferences and willingness to pay for health care services. In this paper, we use the data from the discrete choice experiments included in the survey, to elicit the preferences of health care consumers about the choice of health care providers. Regression analysis is used to estimate the effect of the improvement of service attributes (quality, access, and price) on patients’ choice, as well as the
1 The study is financed by the European Commission under the 7th Framework Program, Theme 8 Socio- economic Sciences and Humanities, Project ASSPRO CEE 2007 (Grant Agreement no. 217431). The content of the publication is the sole responsibility of the authors and it in no way represents the views of the Commission or its services.
2 differences among the socio-demographic groups. We also estimate the marginal willingness to pay for the improvement in attribute levels by calculating marginal rates of substitution. The results show that respondents from a village or the capital, with low education and bad health status are more driven by the changes in the price attribute when choosing between health care providers. Respondents value the good skills and reputation of the physician and the attitude of the personnel most, followed by modern equipment and maintenance of the office/hospital. Access attributes (travelling and waiting time) are less important. The method of discrete choice experiment is useful to reveal patients’
preferences, and might support the development of an evidence-based and sustainable health policy.
Keywords: discrete choice experiment, service valuation, health care, user fees, Hungary JEL codes: D12, I11
1. INTRODUCTION
Previous qualitative studies suggest that consumers are not satisfied with the quality of health care services provided by the social health insurance in Hungary (Baji et al. 2011a; Baji – Gulácsi 2010). They mostly complain about long queues, long waiting times, lack of personal attention, poor maintenance of the health care facilities and shortage of equipment. The low quality of health care services provided by the social health insurance is often explained by the financial difficulties (continuous debts) of the health insurance fund, as well as by the lack of financial and human resources in the health care facilities.
At this moment, most of the health care services covered by social health insurance are provided free of charge.2 However, those consumers who want to obtain services with better quality or access are either paying informally for health care services or use private services (Baji et al. 2011a). To maintain or improve the quality of the services provided by social health insurance and to meet consumers’ expectations, the increase of private spending on health care seems to be inevitable. The pressure on the government to control health care expenditure is already significant and an increase of public resources for health care financing is not expected in the near future (Gaál et al. 2011). However, according to the conclusion of the qualitative study mentioned above, health care consumers are not against contributing to
2 Co-payments are charged only for some service in dental care (for orthodontic treatment under the age of 18, tooth keeping and replacement above the age of 18); in in-patient care (for extra meal and accommodation in- patient care and for sanatorium treatment in-patient chronic care); in the case of a free choice of physician (excluding delivery and maternity care, patients should cover 30% of the cost max. 100,000 HUF); and when using services without referral (excluding emergency care).
3 the cost of the health care services (by paying formal user fees/co-payments) if these services are provided with good quality and access (Baji et al. 2011a; Baji – Gulácsi 2010).
The objective of this study is to examine the preferences of the health care consumers for quality, access and price attributes of health care services. In particular, we use the method of discrete-choice experiment (DCE) to study the relative importance of various service attributes to consumers, as well as the value that consumers attach to the improvements in service quality and assess. We also estimate how relative attribute importance and improvement valuation differ among the socio-demographic groups. For the analysis we use data from a national survey carried out in 2010 in Hungary among a representative sample of 1,037 respondents.
Our study is useful for Hungarian policy makers to establish the relative importance of co-payments by patients for health care. This can be a starting point to make patient charges acceptable for the public. The results are also useful for health insurance representatives to plan new products in the private health insurance market, as well as to prioritize the quality and access improvements of current products. This study also serves as an example of how the results of DCE can be used to inform health care actors and can be incorporated in policy planning.
The paper is structured as follows. First, we provide a short overview of the DCE method. Next, we present the data collection, and the design of the DCE applied in our study as well as the survey results. Finally, we discuss our results and draw conclusions for policy.
2. AN OVERVIEW OF THE DCE METHOD
Stated preference methods (e.g. DCE and contingent valuation) are used to elicit consumer preferences when consumer behavior is not observable, for example when the market for a given good/service does not exist or is still being developed. In this case, preferences can be derived from surveys where consumers are presented with hypothetical options and are asked to state their preferences for these options (Castello 2003).
Stated preference methods are frequently applied within the framework of cost-benefit analysis, mainly in the field of health, environmental and transport economics, to advise on the social desirability of providing various commodities and services using public resources (see Hanley et al. 2003; Lancsar – Louvier 2008; Ryan et al. 2001; Ryan – Gerard 2003;
Telser – Zweifel 2002; Vroomen – Zweifel 2011).
4 In this study, we focus on the DCE method. The main objective of the DCE method is to elicit the preferences of consumers for a given benefit. Respondents are faced with hypothetical choice sets (sets of profiles) of goods and services characterized by certain attributes. Each profile is a bundle of selected attributes with specific levels. The profiles differ from each other in the levels of their attributes. The respondents are asked to choose the profile that they prefer most.
It is assumed that an individual derives unique utility from each attribute level. It is also assumed that respondents evaluate the utility that they expect to derive from a product/service by combining the utility that they expect from each attribute characterizing the given product/service. Consequently, respondents choose the profile that they associate with the highest level of utility. Thus, the respondents’ preferences for a given profile contain information about the overall utility that respondents expect to derive form that profile. In this way, the results of a DCE are used to elicit the relative importance of attributes to respondents, to examine the effect of improvements of attribute levels on the respondents’
choice, and to estimate the marginal rate of substitution (MRS) between non-price and price attributes. The MRS is seen as an indicator of the marginal willingness to pay for a change in the non-price attribute, i.e. the increase in patient charges that compensates for the improvement of a non-price attribute assuming a constant utility level. We should highlight that the marginal willingness to pay derived from DCE should be used with caution and cannot be seen as actual amounts that respondents are willing to pay (e.g. Ryan – Watson, 2009). It is, usable in an ordinal perspective to set investment priorities.
The DCE method is broadly applied in the field of economic evaluation of specific health care products, procedures or programs (i.e. health technology assessment). The application of the method for the assessment of health policies is however limited. In this paper, we demonstrate how the method can be used to inform policy makers on consumers’
preferences for improvements in health care services and thus, on consumers’ willingness to accept official fees for health care.
2. METHODS 2.1. Data collection
5 We use data form a national survey, which was carried out as a part of an international research project.3 The objective of the survey was to provide quantitative data on past payments for health care services, data on preferences and willingness of the population to pay for health care services.
Data collection was carried out in July 2010 via face-to-face interviews in the respondents’ homes using a standardized questionnaire. The aim was to have 1,000 completed questionnaires in Hungary representative for the population. The respondents were identified based on a multi-staged random probability method. First, the sampling points in the country were distributed proportionally to regions. Random route method was used to identify 8-10 households per sampling point. The selection of the respondent within the selected household was done using the “last birthday” principle. It is proven by practice that the sample produced by this method does not differ significantly from the official statistical data on age, gender and other demographic parameters (Gaziano 2005; Oldendick et al. 1988). Altogether 1,376 respondents were contacted, and 330 refused to complete the questionnaire. The response rate was 76%. Finally, we have 1,037 efficient respondent in the database.
In this paper, we use the data from the two DCE experiments included in the questionnaire: the DCE focused on out-patient services (visit to a specialist) and the DCE focused on in-patient services (planned surgery).
2.2. DCE design
In each of the two DCE, the service (specialist visit or planned surgery) is presented to the respondents in the form of alternative profiles that contain combinations of attributes of health care services (see Table 1). The selection of attributes and attribute levels are based on focus group discussions, where the participants described their expectations about good quality health care services. Attributes of the services selected are referring to the quality of physical and human resources needed to provide care (i.e. health care facility, equipments, and personnel) as well as to the temporal, spatial and physiological access to services (i.e. waiting time, travelling time, staff attitude). These attributes correspond to the framework of Berki – Ashcraft (1980) on quality and access of health care services. We keep the number of attributes and their levels at a minimum to assure the feasibility of data collection.
3 ASSPRO CEE 2007. For further information see: www.assprocee2007.com.
6 Eight choice-sets for specialist services and eight choice-sets for hospital services are defined. Each choice-set contains one basic profile (that remained constant throughout all eight choice sets) and one alternative profile (see an example in Table 2). The alternative profiles are selected from all possible profiles (27 = 128), by using an orthogonal main-effect fractional factorial design (Addelman 1962). The basic profile is chosen to minimize the overlap between profiles in a choice-set and to represent a potentially realistic situation - a low-price level, as well as 1 attractive and 1 unattractive level for each of the following aspects: health care personnel (attitude and skills), conditions (maintenance and equipment) and access (travelling and waiting).
Respondents are asked to choose between the two options (basic profile and alternative profile) to indicate which specialist they would visit in the case of a major health problem with unfamiliar symptoms, and alternatively, which hospital they would choose in case of a planned surgery with not life-threatening conditions which requires 5 days stay in hospital (see Table 2). As explained in the previous section, it is expected that each individual derives unique utility from each attribute level and chooses the profile that maximizes his/her utility. For more information about the analysis of our DCE data see Appendix A.
Table 1
Attribute and attribute levels
Specialist services
Attribute Attribute levels
ATR1 Medical equipment 0 = Outdated 1 = Modern
ATR2 Reputation and skills of the physician 0 = Unknown 1 = Known to be good
ATR3 Maintenance of the office 0 = Outdated 1 = Renovated
ATR4 Attitude of the staff 0 = Impolite 1 = Polite
ATR5 Travel time to the office 60 minutes 15 minutes
ATR6 Waiting in front of the office 45 minutes 10 minutes
ATR7 Patient visit fee 10 Euro (2,850 HUF) 5 Euro (1,425 HUF)
Hospitalization
Attribute Attribute levels
ATR1 Medical equipment 0 = Outdated 1 = Modern
ATR2 Reputation and skills of the surgeon 0 = Unknown 1 = Known to be good ATR3 Maintenance of the interior 0 = Outdated 1 = Renovated
ATR4 Attitude of the staff 0 = Impolite 1 = Polite
ATR5 Travel time to the hospital 3 hours 1 hour
ATR6 Waiting time for the operation 4 months 1 month
7 ATR7 Patient hospitalization fee 100 Euro (28500 HUF) 200 Euro (57000 HUF)
Table 2 Example of choice set
2.3. Analysis
For the analysis of the DCE data, we use binary probit regression with random effects (software package LIMDEP 7.0). The choice of the profile (selection or rejection of the basic profile) is taken as a dependent variable. Initially, we include all attribute differences and all interactions (see the model in Appendix A) as independent variables (see independent variables in Table 3). Then, we reduce the model using a backward stepwise procedure where statistically insignificant independent variables are systematically removed from the model.
This way, we obtain a reduced model that contains only statistically significant independent variables (where p≤0.10).
We also calculate the MRS between non-price and price attributes, and we use the MRS as an indicator of respondents’ marginal willingness to pay and relative importance that respondents attach to a change in a given service attribute (e.g. Telser – Zweifel 2002;
Vroomen – Zweifel 2011).
3. RESULTS
CARD: Choice of a physician – major health problems
Physician A Physician B
Medical equipment Modern Outdated
Reputation and skills of the physician Unknown Known to be good
Maintenance of the office Renovated Renovated
Attitude of the staff Impolite Impolite
Travel time to the office 60 min 15 min
Waiting in front of the office 10 min 45 min
Patient visit fee 5.- Euro 5.- Euro
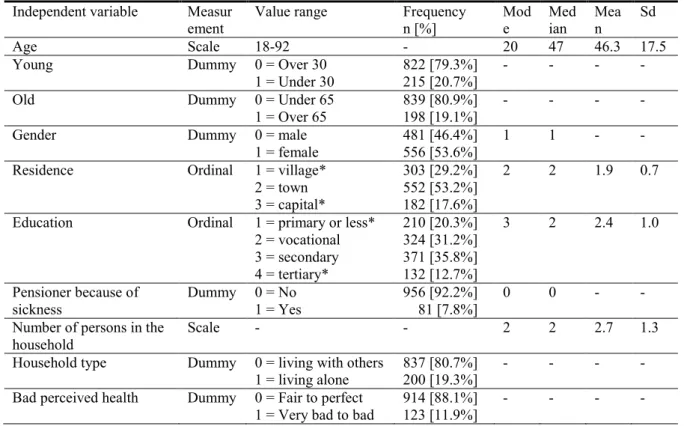
8 Descriptive statistics are presented in Table 3. The average age of the sample population is 46.3 years (SD=17.6), 46% of the respondents are men, 53.6% living in a town, 17.6% in the capital, the rest 28.8% is living in villages. Most of the respondents (67.0%) finished education at secondary level, and 49% of them are working. The average household income is 167,470 HUF (sd = 93,960 HUF). The data represents the Hungarian population well.
3.1. Socio-demographic characteristics
The results of the DCE are presented in Table 4. All main effects of the attributes are significant, except for travelling time to the hospital in the case of hospital services. This means that all attributes included in the two DCE affect the choice of service irrespective of the respondents’ socio-demographic characteristics. In general, better equipped and renovated physician office/hospitals, as well as skilled physicians and polite personnel are preferred.
Shorter waiting time in front of the physician office and shorter waiting time for the operation as well as shorter travelling time to the physician office are also preferred. Travelling time to the hospital has a significant effect on the choice only for respondents with a household income of less than 250 Euro per month.
Table 3 Descriptive statistics Independent variable Measur
ement Value range Frequency
n [%] Mod
e Med
ian Mea
n Sd
Age Scale 18-92 - 20 47 46.3 17.5
Young Dummy 0 = Over 30
1 = Under 30
822 [79.3%]
215 [20.7%]
- - - -
Old Dummy 0 = Under 65
1 = Over 65 839 [80.9%]
198 [19.1%] - - - -
Gender Dummy 0 = male
1 = female 481 [46.4%]
556 [53.6%] 1 1 - -
Residence Ordinal 1 = village*
2 = town 3 = capital*
303 [29.2%]
552 [53.2%]
182 [17.6%]
2 2 1.9 0.7
Education Ordinal 1 = primary or less*
2 = vocational 3 = secondary 4 = tertiary*
210 [20.3%]
324 [31.2%]
371 [35.8%]
132 [12.7%]
3 2 2.4 1.0
Pensioner because of sickness
Dummy 0 = No 1 = Yes
956 [92.2%]
81 [7.8%]
0 0 - -
Number of persons in the
household Scale - - 2 2 2.7 1.3
Household type Dummy 0 = living with others
1 = living alone 837 [80.7%]
200 [19.3%] - - - -
Bad perceived health Dummy 0 = Fair to perfect
1 = Very bad to bad 914 [88.1%]
123 [11.9%] - - - -
9 High net monthly
household income (rich) Dummy 0 = under 1,000 Euro
1 = over 1,000 Euro 917 [88.4%]
120 [11.6%] - - - -
Low net monthly household income (poor)
Dummy 0 = over 250 Euro 1 = under 250 Euro
950 [91.6%]
87 [8.4%]
- - - -
The coefficients of the interaction terms of socio-demographic characteristics and the coefficients of the main effects of the attributes indicate the differences in preferences across the socio-demographic groups. The same sign of the coefficient of the main effect of an attribute and the interaction terms of the socio-demographic characteristics with this attribute indicate that this attribute has relatively greater impact on the choice of services in the given socio-demographic group compared to the base socio-demographic category. In case of opposite signs, the attribute’s influence on the choice is lower in the given socio-demographic group.
Table 4
Results of the regression analysis - DCE
Specialist services Hospital services Coefficient S.E. Coefficient S.E.
Constant 0.1031 0.0508 -0.0991 0.0507
Medical equipment (ATR1) 0.4812 0.0419 0.2796 0.0358
Reputation and skills (ATR2) 0.6373 0.0459 0.5960 0.0438
Maintenance of the office /interior (ATR3) 0.4134 0.0387 0.3628 0.0444
Attitude of the staff (ATR4) 0.5455 0.0474 0.3535 0.0469
Travel time (ATR5) -0.0072 0.0009 - -
Waiting (ATR6) -0.0102 0.0012 -0.1473 0.0130
Price (ATR7) -0.0003 0.0000 -0.0000 0.0000
Medical equipment * OLD -0.2510 0.0711 - -
Medical equipment * CAPITAL 0.2125 0.0726 - -
Medical equipment * VILLAGE 0.1588 0.0819 - -
Medical equipment * TERTIARY EDUCATION - - 0.2902 0.0868
Medical equipment * PENSION DUE TO SICKNESS 0.1200 0.0687 - -
Reputation and skills * FEMALE 0.1135 0.0492 0.0799 0.0459
Reputation and skills * CAPITAL - - -0.4424 0.0750
Reputation and skills * VILLAGE 0.1609 0.0671 - -
Reputation and skills * PRIMARY EDUCATION - - -0.1815 0.0644
Reputation and skills * TERTIARY EDUCATION 0.2191 0.0748 0.4776 0.0732 Maintenance of the office /interior * PRIMARY EDUCATION - - -0.1468 0.0798
Maintenance of the office /interior * YOUNG 0.2376 0.0717 - -
Maintenance of the office /interior * CAPITAL - - -0.1838 0.0886
Maintenance of the office /interior * TERTIARY EDUCATION - - 0.2325 0.0984
Attitude of the staff * VILLAGE 0.1458 0.0641 - -
Attitude of the staff * OLD -0.1390 0.0661 - -
Attitude of the staff * FEMALE 0.1367 0.0498 0.1416 0.0546
Attitude of the staff * CAPITAL - - -0.2961 0.0833
Attitude of the staff * TERTIARY EDUCATION - - 0.2997 0.0876
Attitude of the staff * RICH -0.3425 0.0991 -0.3587 0.1000
Travel time * VILLAGE -0.0026 0.0015 - -
Travel time * POOR - - -0.1509 0.0478
Travel time * PENSION DUE TO SICKNESS -0.0038 0.0015
10
Waiting * CAPITAL -0.0050 0.0022 - -
Waiting * VILLAGE -0.0474 0.0199
Price * YOUNG 0.0002 0.0000 0.0000 0.0000
Price * OLD 0.0001 0.0001 0.0000 0.0000
Price * CAPITAL -0.0003 0.0000 - -
Price * VILLAGE -0.0002 0.0001 -0.0000 0.0000
Price * PRIMARY EDUCATION - - -0.0000 0.0000
Price * TERTIARY EDUCATION 0.0001 0.0001 - -
Price * BAD HEALTH -0.0002 0.0000 - -
Price * RICH 0.0002 0.0001 -0.0000 0.0000
Price * LIVING ALONE -0.0001 0.0000 - -
Price * PENSION DUE TO SICKNESS -0.0001 0.0000 - -
Rho 0.1841 0.0162 0.2023 0.0170
Observations 8296 8296
Respondents 1037 1037
LogLikelyhood -4792.93 -4810.75
Chi2 235.54* 262.04*
Note: all coefficients are significant, p<0.10
The “reputation and skills of the surgeon” is a more important factor for women and respondents with a tertiary education than for the rest of the sample (for both physician and hospital services). At the same time, skills and reputation of the surgeon is a less important factor for respondents with primary education or respondents from the capital. The “attitude of the personnel” is a more important factor for women and respondents from villages when using specialist services compared to other socio-demographic groups. However, it is a less important factor for respondents over 65 and with a household income higher than 1,000 Euro.
Preferences for “medical equipment” differ across socio-demographic groups in the case of specialist services, while they are rather similar (i.e. interaction terms are not significant) in the case of hospital services (except for respondents with tertiary education).
Preferences for the attribute “maintenance of the hospital interior” in case of hospital services also differ by socio-demographic groups, while we find no differences for the importance of the “maintenance of the office” in the case of specialist services.
“Travel time to the physician office” is more important for respondents from villages, and respondents living on sickness-pension than for the rest of the sample. Also, we find no significant differences concerning the importance of “waiting time in front of the office”
(except for respondents from the capital who have stronger preferences for a shorter waiting time than the rest of the sample). This is also the case for “waiting time for the operation”, which is a more important factor for respondents from villages than for other socio- demographic groups.
Regarding the price attribute, significant negative coefficients of the interactions between price and socio-demographic characteristics show that the choice of services by
11 members of vulnerable social groups is strongly affected by changes in the price attribute.
Respondents from a village or from the capital, with bad health status, as well as those who are living alone and are disabled are more strongly affected by the price when choosing between specialist services. Similarly, for hospital services respondents from a village, with low education, who are living alone and disabled are more strongly affected by the price.
We find that respondents under 30 or over 65 years are less affected by the price when choosing between services. Also, the choice of respondents with tertiary education and with a household income of more than 1,000 Euros per month is less affected by price changes in case of specialist services.
3.2. Marginal rates of substitution
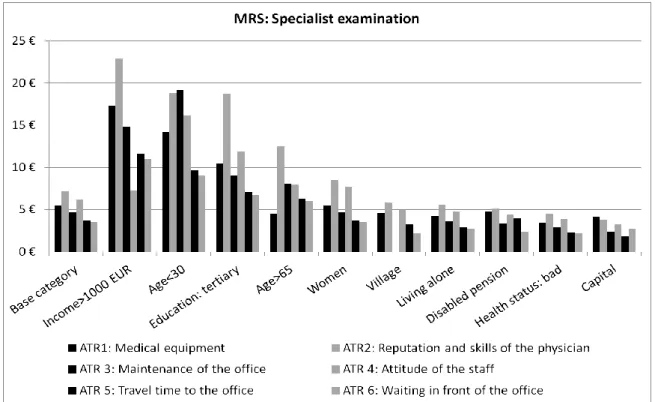
We calculated the MRS for the different non-price attributes (see Figures 1 and 2). The MRS is higher for respondents below 30, with tertiary education, and with a household income higher than 1,000 Euros. It is lower for vulnerable social groups such as disabled and those with a bad health status. The MRS is indicative for the relative importance of attributes to the respondents, when choosing between health care services.
In general, in the case of specialist services, respondents more value attributes associated with the characteristics of the health care personnel, i.e. the MRS of reputation of the physician in the base category is 7.2 Euros and the MRS of the attribute “attitude of the personnel” is 6.2 Euros. This means that if the specialist has a good reputation, health care consumers value the specialist visit higher (7.2 Euros more) compared to an unknown specialist. These attributes are followed by modern equipments and maintenance of the office (MRS = 5.5 and 4.7 Euros). Access attributes (travelling time, and waiting time in front of the office) seem to be less important attributes in the choice of consumers (MRS = 3.7 and 3.5 Euros for the change from 60 minutes to 15 minutes of travelling time and 45 to 10 minutes waiting time in front of the office).
In the case of hospital services, MRS shows that respondents value a higher skilled surgeon with a good reputation (MRS = 146.0 Euros) compared to other attributes. It is followed by the decrease of waiting time (from 3 months to 1 month) for the operation (MRS
= 108.2 Euros) and also the attitude of the personnel (MRS = 86.6 Euros). Less important attributes are the interior of the hospital ward (MRS = 88.9 Euros), and the state of medical equipments in the hospital (MRS = 68.5 Euros). Travelling time to the hospital has a
12 significant role only in the choice of respondents from the lowest income category (where household income is less than 250 Euros per month).
Figure 1. MRS in different socio-demographic groups (specialist examination)
Figure 2. MRS in different socio-demographic groups (hospitalization)
13 4. DISCUSSION OF THE RESULTS
In this paper, we have examined the preferences of the Hungarian health care consumers for health care services using DCE method. DCE method is frequently applied to examine patient’s preferences and to model the consumers’ choice at the hypothetical market. In our paper, we examine the preferences of Hungarian consumers for physician and hospital service, as well as the value that different socio-demographic groups in Hungary attach to the improvements of these services.
We find that health care consumers in Hungary highly value improvements of health care services. This is in accordance with previous findings on the attitude of health care consumers towards co-payments (Baji – Gulácsi 2010, Baji et al. 2011a).
Young and elderly consumers with tertiary education and with higher household income are willing to accept a higher price for the improvement of the quality of health care services. Previous studies have also argued that people with higher education are more likely to invest in their health (Becker 1967; Mincer – Polachek 1974; Tomini et al. 2011), while vulnerable social groups (e.g. consumers from a village, with primary education, with bad health status, those who are living alone or living on a disabled pension) are less willing to accept payments for the health care improvements. Consumers from the capital are also less willing to accept payments for improvements of the services. The explanation of this finding might be that consumers from the capital are already experiencing better quality of and access to health care services. Several studies have indicated that in Budapest, consumers have much better access to health care services than in other parts of the country (Belicza 2006; Vitray et al. 2011).
Also, health care consumers value the quality attributes connected to the health care personnel the most (i.e. the reputation of the physician, and the attitude of the health care personnel). Medical equipments and the maintenance of the health care facility are also considered as important factors. However, waiting time in front of the office and travelling time to the health care facility are less likely to affect the choice of health care consumers. It seems that 1 hour of travelling to the specialist’s office and even 3 hours of travelling time to the hospital is acceptable for consumers. In Hungary, this means that consumers do not mind to travel to the capital to be hospitalized (as the capital is accessible within 3 hours from most part of the country). This might also suggest that the quality of the provided services differ between territories and confirm that health care consumers are not against travelling if they receive better quality care. A lower importance of access compared with clinical quality is
14 also reported in several previous studies (e.g. Acharya – Cleland 2000; Harris 2002; Pavlova et al. 2003).
We also identify differences in the preferences by socio-demographic groups. Women in general value the attitude of the staff and reputation of the physician/surgeon relatively higher than men. People from the capital attach relatively lower importance to the attitude of the personnel and the reputation of the surgeon in case of hospital services, but put higher value on the state of medical equipment and a short waiting time in case of specialist services.
Travelling time to the hospital is a significant determinant of the choice only for low-income households. They might be less able to afford travel costs.
5. POLICY IMPLICATIONS AND POLICY CONCLUSIONS
The consumers’ preferences for the improvements of the quality of health care services and the current consumer dissatisfaction with the health care quality in Hungary call for additional resources in the Hungarian health care sector. Since the options to increase public funds are limited, it seems that the increase of private financing is inevitable. Our results might be useful for policy makers who consider the increase of private financing in health care to establish sustainable patient payment policies acceptable by the public. In the following we discuss the main factors which should be considered.
Need for quality measurement and monitoring
In our study, we provide evidence that health care consumers in Hungary are ready to accept higher prices if the quality and/or the access of a given service is better (i.e. they attach less importance to patient charges than to service quality and access). Thus, there is a potential to implement patient charges, however fees/charges should provide in return improvements in quality and access. To be able to involve private payment channels in the funding of health care services, it is essential to define quality standards of health care services guaranteed by the social health insurance. At the moment in Hungary, the quality standards of the health care provision are not regulated and the quality of the provided services is not measured in practice. Experiences from western European countries should be used to set up quality measurements standards. For example, the “Health Care Quality Indicator” program of the OECD started in 2002 with the aim to compare the quality of health services in different
15 member states.4 A wide range of quality indicators have been developed to measure quality, which could help in the specification of health care services, and thus, it could be used in national legislation and drafting protocols. The quality measures should include the various dimensions of health care provision- the structure, process and the outcome of health care services (Donabedian 1966; 1982; 1988). These parameters should be related to the health care facilities (e.g. the number of beds in a room, how many patients share a room/toilet/bathroom, meals given to patients), access to health care (how many minutes to travel to the provider institution, how long to wait in the health care facility, length of the waiting-list), but even to the physicians (qualification requirements, experience, patients satisfaction). These parameters should also consider the outcome of the provided health care services (e.g. the infection rate, 30-day stroke and heart attack death rate). Such indicators should be used to define services included in the basic benefit package provided by the social health insurance. In Hungary, the concept of the basic benefit package has been discussed for a long time (Boncz et al. 2007; Dózsa et al. 2006). However, the sensitivity of this issue has held back policy makers from real actions.
Human resources and informal payments for health care services
In our study, we find that health care consumers attach a higher value to the reputation of the specialist/surgeon and the attitude of the health care personnel compared to other attributes of health care services. Thus, according to consumer preferences, professional and personal skills should be remunerated. This finding indicates that priority should be given to investments in human resources. However, policies should consider that at the moment, health care consumers already express their willingness to pay and compensate health care personnel (mainly physicians) directly, by paying via informal channels (Baji et al. 2011a) These payments are widespread in the country, around 14% of the patients pay informally for specialist visits on average 35 Euros, and half of the patients pay informally in hospital care on average 58 Euros (Baji et al. 2011b). These informal payments constitute the major share of physicians’ income although they are rather unequally distributed between health care professions (Gaál et al. 2006). Policies on patient payments should consider that formal payments, if not well-implemented, might induce double financial burden of the health care consumers.
4 See: http://www.oecd.org/document/34/0,3746,en_2649_37407_37088930_1_1_1_37407,00.html
16
Equity considerations
We also find in our study that vulnerable socio-demographic groups are more reluctant to accept high payments for health care services. It has been proven that such payments lead to unequal access to health care services (i.e. drop-out visits of these people), and with this, higher morbidity, emergency care admissions and mortality (Atella et al. 2005; Austvoll- Dahlgren et al. 2008). Thus, policies on patient payments should consider the negative equity effects of increasing formal payments (charges) as these payments induce a relatively higher burden on vulnerable social-economic groups who are less able to pay for health care services. The exemption mechanisms for these groups should be carefully considered to prevent adverse effect on equity. This is an especially relevant issue in Hungary as the health status of the population is one of the worst among European countries (Gaál et al. 2011).
Patient payment policy
To be able to improve the quality of health care services provided by social health insurance in Hungary, policies should aim to provide opportunity to pay for those who are willing and able to pay for the improvement in the quality of the services, and should reinvest these resources in health care provision. At the same time, policy makers should assure that the increase of private financing does not create adverse effect on equity and access. For this, a basic benefit package should be reconsidered based on scientific evidences and health care services provided by the social health insurance. Quality standards should be clearly defined.
REFERENCES
Acharya, L.B. – Cleland, J. (2000): Maternal and Child Health Services in Rural Nepal: Does Access or Quality Matter More? Health Policy and Planning 15: 223–229.
Addelman, S. (1962): Orthogonal Main-Effect Plans for Asymmetrical Factorial Experiments.
Technometrics 4: 21-46.
Atella,V. et al. (2008): Drug Compliance, Co-Payment and Health Outcomes: Evidence from a Panel of Italian Patients. CEIS Working Paper No. 76. Accessed at: http://ssrn.com/abstract=871395 Austvoll-Dahlgren, A. et al. (2008): Pharmaceutical Policies: Effects of Cap and Co-Payment on
Rational Drug Use. Cochrane Database of Systematic Reviews 23(1): CD007017.
Baji, P. – Gulácsi, L. (2010): „Beteg Önrész” – A Lakosság Fizetési Hajlandósága az Egészségügyi
17 Szolgáltatásokért [Patient Payments – Willingness of the Hungarian Population to Pay for Health Care
Services]. Esély 4: 106-117.
Baji, P. et al. (2011b): Informal Payments for Health Care Services and Short-Term Effects of the Introduction of Visit Fee on These Payments in Hungary. International Journal of Health Planning and Management. (forthcoming, doi: 10.1002/hpm.1106).
Baji, P. et al. (2011a): User Fees for Public Health Care Services in Hungary: Expectations, Experience, and Acceptability from the Perspectives of Different Stakeholders. Health Policy 102(2-3): 255-62.
Becker, G.S. (1967): Human Capital and the Personal Distribution of Income: An Analytical Approach. Michigan: University of Michigan, Institute of Public Administration.
Belicza, É. (2006): Egyenlőtlenségek a Szolgáltatások Igénybevétele Során a Járóbeteg Szakellátásban [Inequalities in the Use of Out-Patient Health Care Services]. Informatika és Menedzsment az Egészségügyben (IME) 4(10) 9-15.
Berki, S.E. – Ashcraft M.L. (1980): HMO Enrollment: Who Joins What and Why: a Review of the Literature. The Milbank Memorial Fund Quarterly. Health and Society 58(4): 588-632.
Boncz, I. et al. (2007): Verseny az Egészségügyben Egyesült Államokbeli és Nyugat-Európai Példák [Competition on The Market of Health Care. Examples of the USA and Western Europe].
Közgazdasági Szemle LIV évf: 480-498.
Donabedian, A. (1966): Evaluating the Quality of Medical Care. Millbank Memorial Fund Quarterly 44 (2): 166-206.
Donabedian, A. (1982): Explorations in Quality Assessment and Monitoring. Vol II. The Criteria and Standards of Quality. Ann Arbor, Michigan: Health Administration Press.
Donabedian, A. (1988): The Assessment of Technology and Quality. International Journal of Technology Assessment in Health Care 4: 487-96.
Dózsa, C.S. et al. (2006): Az OEP Szolgáltatásvásárlói és Biztosítói Szerepének Erősítése, Mint a Magyar Egészségügyi Rendszer Reformjának Egyik Fontos Eszköze: 2. r. [Enhancing the Purchaser Role of the National Health Insurance Fund is One Important Elements of the Health Care Reforms. Part 2]. Informatika és Menedzsment az Egészségügyben (IME) 5(8): 5-16.
Gaál, P. et al. (2006): Informal Payment for Health Care: Evidence from Hungary. Health Policy 77(1): 86-102.
Gaál, P. et al. (2011): Majour Challenges Ahead for Hungarian Healthcare. British Medical Journal Dec 7 343: d7657.
Gaziano, C. (2005): Comparative Analysis of Within-Household Respondent Selection Techniques.
Public Opinion Quarterly 69(1): 124-157.
Hanley, N. et al. (2003): Estimating the Monetary Value of Health Care: Lessons from Environmental Economics. Health Economics 12: 3-16.
18 Harris, K.M. (2002) Can High Quality Overcome Consumer Resistance to Restricted Provider Access? Evidence from a Health Plan Choice Experiment. Health Service Research 37: 551–571.
Lancsar, E. – Louviere, J. (2008): Conducting Discrete Choice Experiments to Inform Healthcare Decision Making: A User's Guide. Pharmacoeconomics 26(8): 661-677.
Mincer, J. – Polachek, S. (1974): Family Investment in Human Capital: Earnings of Woman. Journal of Political Economy 82.2: S76-S108.
Oldendick, R.W. et al. (1988): A Comparison of the Kish and Last-birthday Methods of Respondent Selection in Telephone Surveys. Journal of Official Statistics 4 307-318.
Pavlova, M. et al. (2003): The Importance of Quality, Access and Price to Health Care Consumers in Bulgaria: A Self-explicated Approach. International Journal of Health Planning and Management 18(4): 343-361.
Ryan, M. – Gerard, K. (2003): Using Discrete Choice Experiments to Value Health Care Programmes:
Current Practice and Future Research Reflections. Applied Health Economics and Health Policy 2:
55-64.
Ryan, M. – Watson, V. (2009): Comparing Welfare Estimates from Payment card Contingent Valuation and Discrete Choice Experiments. Health Economics 2009 18(4): 389-401.
Ryan, M. et al. (2001): Eliciting Public Preferences for Healthcare: A Systematic Review of Techniques. Health Technology Assessment 5(5): 1-186.
Telser, H. – Zweifel, P. (2002): Measuring Willingness-to-Pay for Risk Reduction: An Application of Conjoint Analysis. Health Economics 11: 129-139.
Tomini, S. et al. (2011): Paying Informally in the Albanian Health Care Sector: A Two-Tiered Stochastic Frontier Model. European Journal of Health Economics (forthcoming).
Vitray, J. et al. (2011): Egészségügyi Ellátáshoz Való Hozzáférés Egyenlőtlenségei Magyarországon.
Kutatási Jelentés [Inequalities in the Access of Health Care Services in Hungary. Research Report]. Budapest: EgészségMonitor Kutató és Tanácsadó Nonprofit Közhasznú Kft.
Vroomen, J.M. – Zweifel, P. (2011): Preferences for Health Insurance and Health Status: Does It Matter Whether you are Dutch or German? European Journal of Health Economics 12(1):87-95.
Appendix A
Theoretical background of the DCE method
Consumers choose between services based on their utility level. The utility driven by the service is the following:
(1) Where
U ij utility that respondent j associates with profile i X i non-price attributes in profile i
j n n j j i p i k k i
i j
i i
ij X P S c a x a x a x a p bs b s b s
U ( , , ) 1 1 2 2 ... 1 1 2 2 ...
19 P i price attribute in profile i
S j variables respondent j c constant
a, b model coefficients
k number of non-price attributes n number of respondent variables
It is expected that each individual derives unique utility from each attribute level and chooses the profile that maximizes his/her utility. We suppose that the consumer choose the alternative profile in contrast to the basic profile, if the utility derived from the alternative profile is higher (or equal) to the utility derived from the basic profile.
(2) UAl(XAl,PAl,Sj)- UBl(XBl,PBl,Sj)=
Ba Al p Ba Al k k Ba
Al Ba
Al Ba
Al x x x p
U 1 1 2 2 ...
where υ , μ random errors within and between respondents
After the estimation of model parameters ( 1... k, p) from (2) we can calculate the marginal rate of substitution between non-price (x) and price-related (p) health care attributes, which can be interpreted as the amount of money that respondents are willing to pay for one unit change in the attribute level to stay on the same utility level.
(3)
p k k
k U U p
x U x
p
0
0 U
if profile e alternativ 1
0 U
if profile basis
Choice 0 Al Ba
Ba Al