CONVERGENCE CLUBS OF NUTS3 REGIONS OF THE V4 GROUP
Izabella Szakálné Kanó
1, Imre Lengyel
21 University of Szeged, Faculty of Economics and Business Administration, Hungary, ORCID: 0000-0002-4149-1243, kano.izabella@eco.u-szeged.hu;
2 University of Szeged, Faculty of Economics and Business Administration, Hungary, ORCID: 0000-0002-9225-5320, ilengyel@eco.u-szeged.hu.
Abstract: In this study, we analyse economic growth and structural change between 2000 and 2016 in the NUTS3 regions of the four countries forming the Visegrad Group (V4) and joining the European Union in 2004, Czechia, Poland, Hungary, and Slovakia. Our examination considers whether convergence can be observed in the case of the regions in the V4 countries over about one and a half decades, i.e., whether less developed regions catch up with more developed ones.
Whether the economic growth of the regions took place at a relatively steady pace similar to that of the countries, or if there is a divide between the groups of regions (convergence clubs), which converge to different steady states. If there are convergence clubs, are the economic structure and workforce base of the clubs similar or different. Our study has two steps; first, we divide the 115 NUTS3 regions into convergence clubs with Phillips and Sul’s 2007 logt-test method, presenting the characteristics of their economic growth. We then conducted entropy calculations to test the robustness of the clubs, which provided information on the disparities inside and between the clubs, as well as inside and between the countries. Next, we present the economic structure and urban- rural types of clubs, covering the main characteristics of their labour force base and what factors the transition from one club to another depends on. The main conclusion of our study is that the five convergence clubs are completely separate and their economic structure and labour force base are also different.
Keywords: Club convergence, Visegrad Group countries, log-t regression test, structural change.
JEL Classification: C23, O18, R11.
APA Style Citation: Szakálné Kanó, I., & Lengyel, I. (2021). Convergence Clubs of NUTS3 Regions of the V4 Group. E&M Economics and Management, 24(4), 22–38. https://doi.
org/10.15240/tul/001/2021-4-002
Introduction
The issue of whether there is convergence or divergence between regions in terms of GDP per capita has long been investigated in regional studies. According to the position of neoclassical economics, if factors can flow freely and comparative advantages prevail, the flows of labour force and capital in opposite directions result in convergence in the long term. Less developed countries and regions with accelerated growth converge toward more developed regions. This hypothesis has been tested in several studies, utilising
extensive methodology and instruments for the examination of convergence between countries and regions, e.g., absolute and conditional convergence, or beta and sigma convergence (Breinlich et al., 2014; Eurofound, 2018; Ertur
& Le Gallo, 2009; Fischer & Stumpner, 2010;
Halmai & Vásáry, 2012; Le Gallo & Fingleton, 2014; LeSage & Fischer, 2009).
The concept of club-convergence was introduced by Baumol (1986) in the study of the economic growth of national economies.
Although the levels of income converged in developed countries, planned economies and
medium-income market economies, there was no convergence within the group of low- income countries (Alexiadis, 2013). Moreover, income levels diverge among country groups, and thus Quah (1996) claimed that low-income economies could not catch up with advanced economies.
In line with Baumol’s (1986) findings, several empirical studies concluded that convergence is not present in all countries/regions but within their certain groups and clubs (Barro & Sala- i-Martin, 1995; Sala-i-Martin, 1996). Fischer and Stirböck (2006, p. 693) noted, that “club- convergence analysis provides a more realistic and detailed picture about regional income growth than traditional convergence analysis”.
The club-convergence hypothesis refers to the per capita incomes of regions with similar economic structures and initial income levels converging towards a steady state in the long term. There is convergence within each club, but there is no convergence between the clubs.
In the EU, NUTS2 regions are used on a broad scale to analyse the level of regional development (Barrios et al., 2019; Bartkowska
& Riedl, 2012; Brzáková & Kraft, 2017). The NUTS2 regions consist of overly heterogeneous areas; in our opinion, the NUTS3 regions may be considered a compromise to the demarcation of functional city-regions and the possibilities of statistical data collection.
In our paper, we examine the economic growth of the NUTS3 regions of the EU’s four Central and Eastern European post-socialist member states sharing similar historical backgrounds, the so-called Visegrad Group, between 2000 and 2016. Several previous analyses have shown convergence between the CEE countries, including the V4 countries, while there is divergence inside the countries (Kallioras & Petrakos, 2010; Lengyel &
Kotosz, 2018; Smetkowski, 2018; Smetkowski
& Wójcik, 2012; Zdražil & Applová, 2016).
We examine whether the club convergence hypothesis applies in the case of 115 NUTS3 regions based on GDP per capita, relying on Phillips and Sul’s method. Then, we investigate the characteristics of clubs based on economic structure and their labour force.
1. Theoretical Background
Many have dealt with the convergence clubs of the regions within the European Union.
Dall’Erba et al. (2008) analysed 244 NUTS2
regions with data from between 1991 and 2003, considering the 2004 EU expansion. They found four convergence clubs accounting for spatial autocorrelation between regions. Artelaris et al.
(2010) examined the regional differences for post-socialist member states joining the EU in 2004 in the case of NUTS3 regions between 1990 and 2005. They observed the emergence of convergence clubs in each country, but identified clubs with distinct characteristics by country. Monastiriotis (2014) studied the convergence of the EU’s NUTS3 regions in the period from 1990–2008, comparing the old EU15 and the new Central and Eastern European member states. He found that while there was regional convergence in the EU15, in Central and Eastern Europe the regional differences had increased since 1990, meaning that divergence occurred, but that its strength depends on the degree of development of national economies.
To separate convergence clubs, Phillips and Sul (2007) developed a regression-based convergence test called log-t-test, which is based on the cross-sectional variance rate of income per capita as a function of time. The clustering method they proposed for examining the convergence of countries and regions has been applied by many studying the European Union.
Apergis et al. (2010), examining the convergence of GDP per capita in the EU’s Central and Eastern Europe member states, found that these countries form two separate clubs, showing significant heterogeneity in the underlying factors of growth. Monfort et al. (2013) examined convergence in the EU member states based on real GDP per employee, using annual data from Western Europe between 1980 and 2009 and Eastern Europe between 1990 and 2009. Their results show that there is a substantial divergence in labour productivity within Europe. They distinguished four convergence clubs, one is formed by CEE countries, except Czechia and including Greece. The member states of the euro area can be categorised into two clubs, making it significantly harder to manage the euro area. Borsi and Metiu (2015) examined the convergence of real income per capita in the EU’s 27 member states between 1995 and 2010. Their results indicate no general income convergence, but there are observable clubs which are divided between the new and old
member states and between the countries in the south-eastern and north-western areas.
Phillips and Sul’s approach has been applied in several studies to examine the subnational regions of the European Union. Bartkowska and Riedl (2012) analysed 206 NUTS2 regions between 1990 and 2002 in two stages. First, they separated the clubs and tested the role of the initial income conditions and sectoral structural characteristics of the regions forming the clubs. They identified six convergence clubs for the division of which the key factors were human capital and initial income per capita. Von Lyncker and Thoennessen (2017) analysed 194 NUTS2 regions between 1980 and 2011 in the EU’s 15 old member states and found four clubs. They consider initial income level, economic structure and geographical location important to the development of the clubs.
There was also a division between north and south and a distinct club formed from high- income capitals.
Barrios et al. (2019) studied 180 NUTS2 regions between 2002 and 2012 based on their innovation performance, and the findings support the club-convergence hypothesis.
They defined seven innovation convergence clubs and found the initial R&D expenditure as the most important factor in the separation of clubs. Cutrini (2019) analysed the development of income differences and economic structural change in the case of 274 NUTS2 regions between 2000 and 2016 and found divergence between regions. She defined five convergence clubs based on initial income level and economic structure, among which polarisation intensified from 2009. She identified manufacturing and knowledge-intensive services as important characteristics of club development.
Phillips and Sul’s method has also been used for analysing the convergence of subnational regions in several countries outside the EU. Aksoy et al. (2019) examined 81 NUTS3 regions of Turkey between 1987 and 2017 and found no absolute or conditional convergence between Turkish regions. They separated five clubs in the first period and six in the second. These clubs were defined by initial income per capita and the quality of human capital. Convergence clubs were analysed by Hamit and Haggar (2013) in Canadian, Ghosh et al. (2013) in Indian, Zhang et al. (2019) in Chinese, and Mendoza-Velázquez et al. (2019) in Mexican regions.
2. Data and Descriptive Statistics
Our paper relies on GDP per capita chain- linked volumes, 2010 of euro data in examining the real income change of regions. We converted the Eurostat Database NUTS3 national currency GDP (nama_10r_3gdp) data according to ESA2010 to GDP volume index values based on the GDP rates of the countries’
chain-linked volumes, 2010 of the euro and national currency (nama_10_gdp). We also used the population data of the Eurostat for the values per capita (nama_10r_3popgdp).
There was dynamic economic growth in the V4 countries in the period from 2000 to 2016.
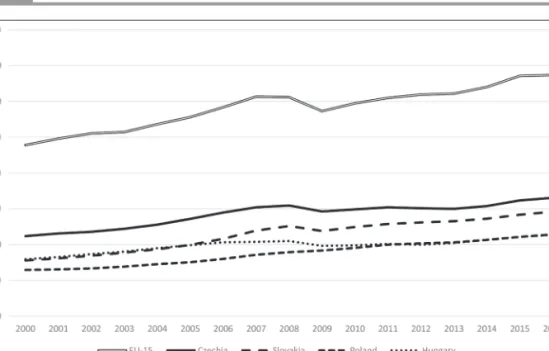
GDP per capita increased 67% on average from 7,500 to EUR 12,500 (Fig. 1). Over the entire period, growth was highest in Czechia, which Slovakia converged toward, while the Hungarian and Polish economies slightly lagged. The growth was dynamic, particularly before 2008, in Hungary only until 2006, and at a similar rate in the four countries from 2010.
Compared to the EU15 average, the total output of the four countries increased from 27% to 40%, thus the effects of the EU’s single market and its cohesion subsidies generated about 1 percentage point of convergence annually over one and a half decades.
In the four countries, there are 115 NUTS3 regions in total (Czechia 14, Hungary 20, Poland 73, and Slovakia 8). Based on the data, GDP per capita increased in each region between 2000 and 2016, although at different rates (Fig. 2). The capitals and some Polish regions stand out regarding the extent and dynamics of GDP per capita, with Budapest slightly lagging compared to the other three capital cities. 65 regions, 56% of the regions, did not reach EUR 10,000 GDP per capita in 2016, which is 30% of the EU15 average; these regions are concentrated in the lower-left corner of Fig. 2.
It can be stated, in accordance with the results of Borsekova et al. (2021, p. 1), that “the group of post-socialist regions without capital cities are significantly lagging behind the rest of the regions in Europe”.
Our research question here examines whether the economic growth of the regions took place similarly as that of the countries – at a relatively steady pace, or if there is a divide between the groups of regions (convergence clubs), which converge to different steady states.
To examine the economic structure, we used Gross Value Added (GVA) national
Fig. 1: GDP per capita by countries, chain-linked (2010) euro
Source: own based on Eurostat
Fig. 2: GDP per capita of NUTS3 regions in 2000 and 2016, chain-linked (2010) euro
Source: own based on Eurostat
currency data, also downloaded from the Eurostat database, converted to chain-linked (2010) euro with rates applied in the case of the GDP. Data were available for six section groups of NACE rev. 2 between 2000 and 2016 (Tab. 1).
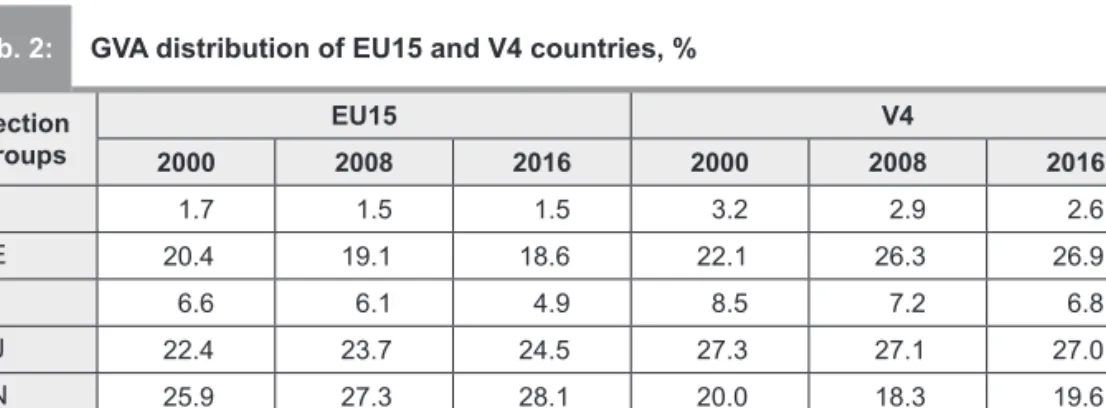
In the two studied country groups, the EU15 and V4, the structure of GVA and their temporal change are different (Tab. 2). In the EU15, the share of industry (B–E) decreased from 20.4% to 19.1%, indicating deindustrialisation, while in the V4 countries, it increased from 22.1% to 26.9%, showing reindustrialisation (Nagy et al., 2020).
In line with this, in the EU15, the proportion of services (G–U) increased from 71.6% to 75%, while in the V4, it reduced from 68.2% to 63.4%.
The economic structure of the two country groups is different, and the direction of the change differs as well. It seems that a new
division of labour emerges in the EU, with deindustrialisation taking place in the EU15 and reindustrialisation in the V4.
Our research question is here: If the convergence clubs of the regions are observed, is the economic structure of the clubs similar or different? Is reindustrialisation perceived in the V4 countries present in each club or only in some of them?
Based on the literature, we considered several indicators to examine convergence clubs, downloading them from the databases of the countries’ statistical offices. In the case of human capital, we used the tertiary educational attainment (ISCED 5–6), data calculated from the 2011 population census, and unemployment rates, which are available from 2005, calculated with an identical methodology. Population density data are from the Eurostat database.
A Agriculture, forestry and fishing
B–E Industry (except construction)
F Construction
G–J Wholesale and retail trade; transport; accommodation and food service activities;
information and communication
K–N Financial and insurance activities; real estate activities; professional, scientific and technical activities; administrative; and support service activities
O–U Public administration and defence; compulsory social security; education; human health and social work activities; arts, entertainment and recreation; repair of household goods;
and other services
Source: Eurostat
Section groups
EU15 V4
2000 2008 2016 2000 2008 2016
A 1.7 1.5 1.5 3.2 2.9 2.6
B–E 20.4 19.1 18.6 22.1 26.3 26.9
F 6.6 6.1 4.9 8.5 7.2 6.8
G–J 22.4 23.7 24.5 27.3 27.1 27.0
K–N 25.9 27.3 28.1 20.0 18.3 19.6
O–U 23.3 22.3 22.4 20.9 18.8 16.8
Total 100.0 100.0 100.0 100.0 100.0 100.0
Source: Eurostat Tab. 1: Gross Value Added section groups
Tab. 2: GVA distribution of EU15 and V4 countries, %
3. Methodologies 3.1 The Log-t-test
Our methodology is based on the approach proposed by Phillips and Sul (2007), that aims to cluster observations of a panel into clubs by testing the convergence of their relative transition paths. We use a panel variable Xit, which is the natural logarithm of the real GDP per capita.
The underlying concept is the time-varying factor representation of panel data, which is the extension of the single factor representation (1).
Panel data can be described by:
, (1)
where:
μt represents the common factor of influence;
δi the systematic characteristic factor of the observation; and
εit the error.
If one allows the systematic part to change over time and to have a random component, one can derive the time-varying factor representation (2) from (1):
, (2)
where δit now represents the above-mentioned time-varying systematic characteristic factor.
Factor δit is usually unknown, however, we can construct the relative transition coefficient hit, which describes the behaviour of δit and Xit relative to the average behaviour of all observations:
. (3)
In this way, one can eliminate the common factor μt and focus on the relative dissimilarities of individual observations from it.
If the systematic factors δit converge to a value δ, then the relative transition coefficients Xit have to converge to 1, and the cross- sectional variance of hit have to go to zero in the long run:
. (4) To test if formula (4) holds, Phillips and Sul (2007) proposed writing δit in a semiparametric form where we separate the time-invariant, idiosyncratic part δi from the time-invariant, idiosyncratic scale parameter σi, such as:
. (5)
Here εit are independent and identically distributed random variables (iid (0, 1)), L(t) is a slowly varying function ( L(at) L(t) → 1 as t→∞) and L(t)→ ∞ as t→∞, and α is the convergence parameter. The hypothesis is:
, (6)
which can be tested by the following regression formula (7):
. (7) Heret =[rT], [rT]+1, … ,T
,
with r ∈ (0,1) and L(t) is the above mentioned slowly varying function.Phillips and Sul (2007) suggest using L (t)
= log t, r = 0.3 if the number of time periods T does not exceed 50. In formula (7), b is the estimated value of 2α. Phillips and Sul (2007) recommended a one-sided t-test robust to heteroscedasticity and autocorrelation to decide if α is significantly non-negative. Their log-t-test is based on the value of the test statistic tb, where they use a 5% significance level.
3.2. Generalised Theil Index
We conducted entropy calculations to test the robustness of the clubs, which provided information on the disparities inside and between the clubs, as well as inside and between the countries. If given a per unit variable (Yi), which is obtained as a quotient of two absolute variables (Xi and Fi), the disparity in the per unit variable can be given using the generalised Theil index (E) as follows (Theil, 1967; Frenken, 2007):
, (8)
where xi and fi are the distribution coefficients formed from the absolute variables.
The base of the logarithm is optional, and we used a base 2 logarithm. The generalised Theil index measures the disparity between the observations; the closer it is to 0, the bigger the order, i.e., the equality is. Furthermore, the generalised Theil index is suitable to give an answer to what extent of the disparity derives
and
from the disparities inside and between the aggregated territorial units:
(9)
, (10)
where Gintra is the average entropy inside the aggregated territorial units; F is entropy between the aggregated territorial units; Gk is the entropy in the kth aggregated territorial unit.
In our case, we applied two methods to decompose the inter-region entropy, based on the aggregation of regions into clubs and countries:
(11) where:
Kintra is the average disparity measured inside
clubs;
Kinter is the disparity measured between clubs;
Cintra is the average disparity measured inside
countries; and
Cinter is the disparity measured between
countries based on the generalised Theil index.
4. Convergence Clubs of the V4 Regions
Based on the club convergence methodology, specifically, the log-t-test created by Phillips and Sul (2007) and described in Section 3, we concluded that the 115 NUTS3 regions do not converge to the same steady-state because the t-value for the whole sample is −24.9136 < −1.65 (Tab. 3). The incorporated Hodrick-Prescott filter of STATA was applied, with which we smoothed the logarithm of GDP per capita. Then, we applied the logtreg algorithm of Du’s (2017) psecta module on the produced trend variable.
However, we could identify five convergent core clubs and one outlier region that was not convergent: Nógrád (in Hungary). After checking possible merging, we concluded that these core clubs are the final set; the scheckmerge algorithm of the psecta module did not find mergeable core clubs; for detailed results, see Appendix 1.
The characteristics of the clubs and the results of the logtreg algorithm running on them differ (Tab. 4). The clubs were formed so that the NUTS 3 regions they involve already converge to the same steady-state, which is confirmed by their t-statistics that are higher than −1.65. We see already at the beginning of the period under review (in 2000) that the average per capita income (measured by GDP per capita) was higher in the NUTS3 regions in higher ranked Clubs than in those
Variable Coeff SE T-stat
log(t) −0.7890 0.0317 −24.9136
Source: own based on Du (2017) Stata psecta module
Clubs Number
of regions b ̂ T-statistics Standard
error GDP per capita (euro)
2000 2016
Club1 4 0.0086 0.1093 0.0786 17,550 31,810
Club2 22 0.0651 0.9536 0.0683 9,837 16,355
Club3 34 0.1526 1.8014 0.0847 6,372 10,719
Club4 46 0.0393 0.7630 0.0515 5,564 8,495
Club5 8 0.3278 1.8438 0.1778 4,903 6,844
Source: own based on Du (2017) Stata psecta module Tab. 3: Results of log-t-test for all NUTS3 regions of the V4 countries
Tab. 4: Convergence club classification
in lower-ranked ones. Club1 substantially stands out among the others: even the average GDP per capita of Club2 was only 56% of that of Club1 in 2000, and this rate decreased to 51% by 2016. In proportion, only Club3 could slightly converge to Club2 by the end of the studied period (its average per capita income increased from 65% to 66% of that of Club 2).
The difference between the neighbouring clubs increased in all other cases.
The growth path of the clubs differs significantly (Fig. 3). In the case of Club1, comprising three capitals and one Polish region (Wroclaw), there is dynamic growth throughout, and it converged to the EU15 average, reaching 94% in 2016. Fig. 3 indicates that even the crisis of 2008 could not decrease the average GDP per capita in Club1, only some loss of momentum can be seen. It is a result of Club1 containing two Polish regions where the crisis did not cause a significant shakeup. Club2 also grew dynamically, especially until 2008, but it considerably lagged behind the EU15 average, standing at 49% in 2016. The economic growth of Club3, Club4 and Club5 were moderate, and diverged from the EU15 average.
Club1 achieved the most dynamic growth:
compared to 2000, the GDP per capita increased by 81% on average in these regions, while the average increases for the other Clubs were 68, 65, 47 and 36%, respectively. The two endpoints of the period carry less information than the GDP data of the entire period. It enabled Wroclaw to be incorporated in Club1 with the three capitals. At the same time, Budapest, Kraków and Poznan were included in Club2, even though Wroclaw had lower GDP per capita in 2016 compared to these cities (see Fig. 2). H0, claiming that the four NUTS3 regions included in Club1 converge to the same steady-state, was not rejected by the log-t-test.
As we described in formula (11), the disparities between the regions can also be analysed with generalised Theil indexes based on entropy, they can be decomposed into the total of disparities inside countries and between countries, and between clubs and inside clubs (Theil, 1967; Frenken, 2007).
Initially, the dissimilarities between regions (E) in the V4 countries increased, as there was divergence until 2007, and then a process of convergence began, which halted in 2011, Fig. 3: GDP per capita of convergence clubs, chain-linked (2010) euro
Source: own
after which differences stagnated (Fig. 4). The development of the dissimilarities between regions (E) are linked mainly to the disparities inside countries (Cintra), while the differentiation is slight between countries (Cinter) until 2006, and then there is slow convergence until 2011 and stagnation from that point.
In the case of the disparities between clubs (Kinter), there was divergence until 2010, and then the differences did not change.
This process was quite like the change of the dissimilarities of the regions inside countries
(Cintra). The clubs are homogeneous in terms
of GDP per capita, and the disparities inside clubs (Kintra) slightly increased until 2006, and then convergence took place at an even pace.
The differences inside clubs (Kintra) followed a similar pattern to the ones between countries (Cinter).
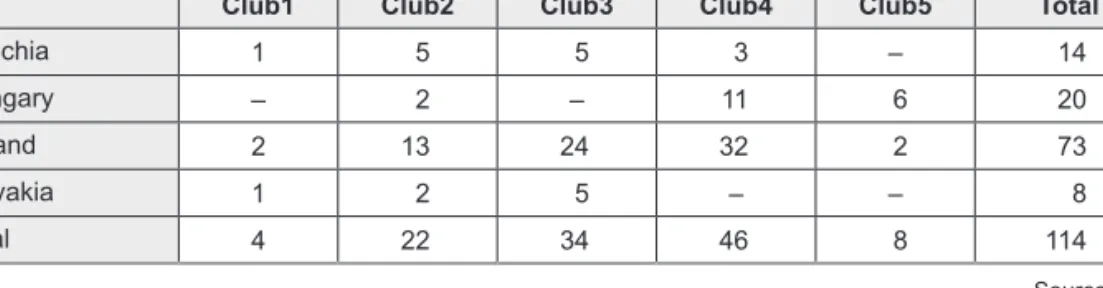
Each country is represented in a different proportion in the clubs (Tab. 5). There is no Hungarian region in Club1, but two Polish regions are found there. Most Hungarian regions are members of the lagging Club4 and Club5, except for two Club2 member regions, Budapest and Győr-Moson-Sopron, and the outlier Nógrád region. No regions from Czechia or Slovakia belong to the lowest ranked Club5, and no Slovakian regions are found in Club4.
The spatial location of convergence clubs clearly indicates the country effect and that the neighbouring regions belong to clubs located close to each other (Fig. 5). Connected areas belonging to Club4 can be seen in almost the entire area of Poland and Hungary as well;
Club5 is located in the border regions in both countries. In Czechia and Slovakia, the diversity of the distribution into clubs is a priori smaller, and these two countries are neighbours.
5. Some Characteristics of Convergence Clubs
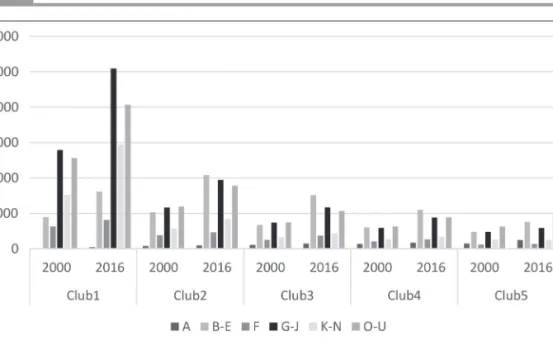
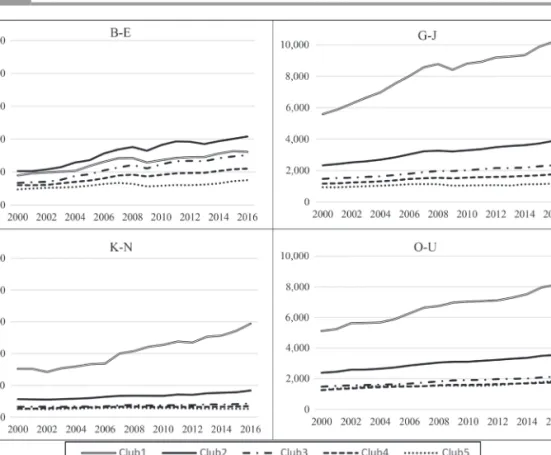
The initial economic structure calculated based on GVA per capita of the convergence clubs and the dynamic of the change of the section groups until the end of the examined period differ by club (Fig. 6). Club1 stands out, where the services (G–J, K–N, O–U) started at a high value and exhibited dynamic growth, which may be explained by the fact that services provided for the entire country (e.g., K–N business services) are concentrated in these regions (three capitals and Wroclaw region). In the case of other clubs, the importance of industry (B–E) is evident, together with G–J residential services and O–U public services. Agriculture (A) is significant only for Club5, while construction Fig. 4: Decomposition of GDP per capita by generalised Theil index
Source: own
(F) is relatively evenly distributed. Industry (B–E) increased everywhere, becoming the main section group, except for Club1, thus reindustrialisation is observable in other clubs.
Based on the distribution of GVA per capita, the economic structure of Club1 differs from that of the others, as G–J residential services and
K–N business services are high and increasing (Tab. 6). For Club2, the share of industry (B–E) is high and increasing, while the share of services barely changes, and that of public services (O–U) slightly decreases. In the case of Club3 and Club4, industry (B–E) dominates;
its share is 32.2% in Club3 and 30.2% in Club4
Club1 Club2 Club3 Club4 Club5 Total
Czechia 1 5 5 3 – 14
Hungary – 2 – 11 6 20
Poland 2 13 24 32 2 73
Slovakia 1 2 5 – – 8
Total 4 22 34 46 8 114
Source: own Tab. 5: Distribution of clubs in countries
Fig. 5: Convergence clubs of the V4 countries
Source: own
in 2016, while that of each service slightly decreases (G–J remains unchanged in Club4).
For Club5, industry (B–E) is also the most important, but the share of public services (O–U) and agriculture is also high.
The development of GVA per capita in the clubs between 2000 and 2016 shows the dominance of Club1. The per-unit value is high and dynamically increasing for all three service- providing section groups. Club1 precedes Fig. 6: GVA per capita in 2000 and 2016, chain-linked (2010) euro
Source: own
A B-E F G–J K–N O–U Total
Club1 2000 0.2 10.6 7.5 33.2 18.1 30.4 100.0
2016 0.3 11.1 5.6 35.0 20.2 27.9 100.0
Club2 2000 1.7 23.4 8.6 26.4 12.8 27.1 100.0
2016 1.3 28.9 6.4 27.0 11.6 24.7 100.0
Club3 2000 3.8 23.6 8.8 26.1 11.5 26.2 100.0
2016 3.1 32.2 7.9 24.9 9.2 22.7 100.0
Club4 2000 5.5 24.9 8.5 24.2 10.9 26.0 100.0
2016 4.7 30.2 7.2 24.2 9.4 24.3 100.0
Club5 2000 7.0 22.7 5.6 22.6 12.1 30.0 100.0
2016 8.4 25.9 4.5 20.1 8.9 32.2 100.0
Source: own Note: for the activities of section groups, see Tab. 1.
Tab. 6: Economic structure of clubs based on the distribution of GVA per capita (%)
three clubs even in the case of industry (B–E) (Fig. 7). (The distribution of agriculture and construction is relatively even, therefore we
do not incorporate them in the figure.) Club2 stands out in terms of industry, but services are also much higher compared to Clubs3–4–5.
Fig. 7: GVA per capita in clubs, chain-linked (2010) euro
Source: own Note: for the activities of section groups, see Tab. 1.
Clubs 2000 2004 2008 2012 2016 Average population
(2016)
Club1 4,078 4,087 4,166 4,193 4,250 1,063
Club2 14,801 14,692 14,816 14,906 15,070 685
Club3 20,339 20,224 20,237 20,255 20,433 601
Club4 21,050 20,813 20,814 20,652 20,739 451
Club5 4,005 3,925 3,825 3,742 3,662 458
V4 total 64,273 63,741 63,857 63,748 64,154 563
Source: own Tab. 7: Development of the population of clubs (thousand persons)
The impact of the 2008 crisis on industry is observable for each club, while the decline of residential services (G–J) is found only in Club1 and partially in Club2.
The population of the clubs changed in line with their economic growth (Tab. 7). The population of Club1 increased by 4% between 2000 and 2016, that of Club2 increased by 1.8%, that of Club3 stagnated, while that of Club4 decreased by 1.5%, and that of Club5 dropped by 8.5%. The average number of inhabitants of the clubs are in line with the 2016 club rankings. Club1 is formed by capitals (not including Budapest), and Club2 contains the further urban regions of the countries (e.g., Kraków, Lódz, Katowice, Plzeň). We note that the population of outlier Nógrád (Hungarian county) is 193,000 people.
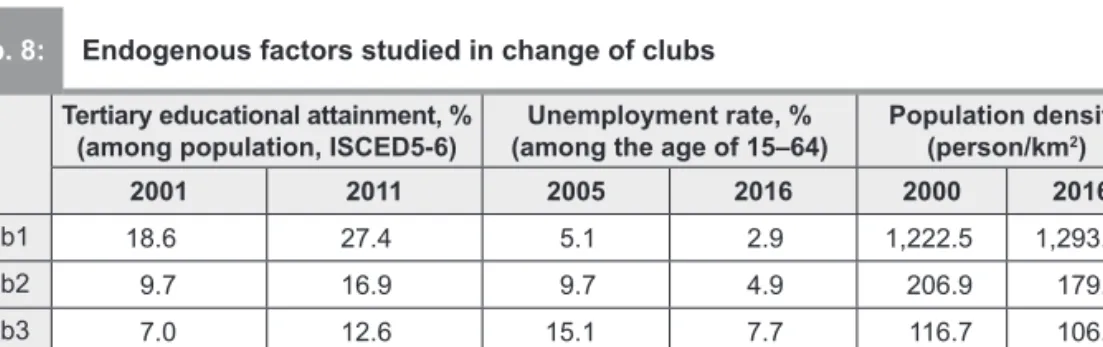
Significant differences can be observed between the clubs based on the two indicators of the labour force base (higher education and unemployment rate) and the population density measuring spatial concentration (Tab. 8).
Tertiary educational attainment follows the ranking of the clubs. In the case of Club1 and Club2, it is high and increasing, while for the other clubs, it is much lower and quite similar.
Unemployment rates increase with club ranking, but in the case of Club4, it is outstanding. The size of the population density also follows the types of clubs.
The characteristics of the clubs can be given based on the presented data, using the related findings of the literature (Lengyel, 2017):
Club1: Three capitals and Wroclaw region, with increasing population and dynamic economic growth, converging to the EU15
average, where the weight of the spatially concentrated service sectors is quite large, the labour force is well-educated, and unemployment rate is low. These centres provide the entire country with services and have some internationally competitive companies.
Club2: A heterogeneous group of regions (including Budapest as a capital), with a common characteristic of slight population increase. The leading sector is industry, they provide services only for their narrower region, the labour force is relatively educated, and the unemployment rate is below the V4-average.
Club3: A heterogeneous group of regions where industry is important, and population growth has stagnated. The service sector fulfils only local needs, the labour force is poorly educated, and the unemployment rate is relatively high.
Club4: A relatively homogeneous group with rapidly industrialising regions. Population is decreasing, the labour force is poorly educated, and unemployment is high.
Club5: Rural regions with increasing industry significance and relatively high agricultural significance. The population is decreasing rapidly, the labour force is poorly educated, and unemployment is high.
Conclusions
In this study, we presented the examination of the NUTS3 regions of V4 countries based on the convergence club hypothesis. The calculations separated five clubs with no convergence between them, while there is
Tertiary educational attainment, %
(among population, ISCED5-6) Unemployment rate, %
(among the age of 15–64) Population density (person/km2)
2001 2011 2005 2016 2000 2016
Club1 18.6 27.4 5.1 2.9 1,222.5 1,293.3
Club2 9.7 16.9 9.7 4.9 206.9 179.6
Club3 7.0 12.6 15.1 7.7 116.7 106.5
Club4 6.2 11.3 18.0 9.8 90.4 93.7
Club5 6.4 10.8 11.2 8.0 80.1 71.5
Source: own Note: unemployment rate collected by comparative methodology is available from 2005.
Tab. 8: Endogenous factors studied in change of clubs
convergence within the clubs. The clubs differ not only according to their economic growth but based on their sectoral structure, population change, and the quality of human capital.
Our examination revealed that despite substantial cohesion subsidies, there is no convergence within V4 countries in terms of NUTS3 regions, but clubs can be categorised.
About 40% of the population of V4 countries live in a NUTS3 region where there is no convergence to the EU15 average. We consider the NUTS2 regions applied in the regional policy of the EU too heterogeneous; NUTS3 regions would be more practical and reliable to calculate using supports and in elaborating convergence programmes.
In the study of convergence clubs, we started from the administrative classification of (NUTS3 level) regions based on the Eurostat database. The regions that make up the clubs have common and different characteristics.
Still, unfortunately, the size limitations of the paper do not allow a detailed analysis of the composition of the clubs. For further convergence studies, it is recommended to start with city regions that result from the amalgamation of neighbouring NUTS3 regions.
Acknowledgement: This research was supported by the project Nr. EFOP-3.6.2-16 2017-00007, titled “Aspects on the development of intelligent, sustainable and inclusive society:
social, technological, innovation networks in employment and digital economy”. The project has been supported by the European Union, co-financed by the European Social Fund and the budget of Hungary.
References
Aksoy, T., Taştan, H., & Kama, Ö. (2019).
Revisiting income convergence in Turkey: Are there convergence clubs? Growth and Change, 50(2), 1185–1217. https://doi.org/10.1111/
grow.12310
Alexiadis, S. (2013). Convergence Clubs and Spatial Externalities. Heidelberg: Springer.
https://doi.org/10.1007/978-3-642-31626-5 Apergis, N., Panopoulou, E., & Tsoumas, C. (2010). Old Wine in a New Bottle: Growth Convergence Dynamics in the EU. Atlantic Economic Journal, 38(2), 169–181. https://doi.
org/10.1007/s11293-010-9219-1
Anselin, L. (1995). Local Indicators of Spatial Association – LISA. Geographical
Analysis, 27(2), 93–115. https://doi.
org/10.1111/j.1538-4632.1995.tb00338.x Artelaris, D., Kallioras, D., & Petrakos, D.
(2010). Regional Inequalities and Convergence Clubs in the European Union New Member States. Eastern Journal of European Studies, 1(1), 113–133. https://doi.org/10.1080/1359756 6.2020.1809382
Barrios, C., Flores, E., & Martínez, M.
A. (2019). Club convergence in innovation activity across European regions. Papers in Regional Science, 98(4), 1545–1565.
https://doi.org/10.1111/pirs.12429
Barro, R. J., & Sala-i-Martin, X. (1995).
Economic Growth Theory. Boston, MA: McGraw- Hill.
Bartkowska, M., & Riedl, A. (2012). Regional convergence clubs in Europe: Identification and conditioning factors. Economic Modelling, 29(1), 22–31. https://doi.org/10.1016/j.
econmod.2011.01.013
Baumol, W. J. (1986). Productivity growth, convergence and welfare: What the long run data show? The American Economic Review, 76(5), 1072–1185.
Borsekova, K., Korony, S., & Nijkamp, P. (2021). Traces of the Iron Curtain:
A multivariate analysis of regional cohesion in Europe. Socio-Economic Planning Science (In Press). https://doi.org/10.1016/j.
seps.2021.101040
Borsi, M. T., & Metiu, M. (2015). The evolution of economic convergence in the European Union. Empirical Economics, 48, 657–681.
https://doi.org/10.1007/s00181-014-0801-2 Breinlich, H., Ottaviano, G. I., & Temple, J. R. (2014). Regional Growth and Regional Decline. In P. Aghion, & S. Durlauf (Eds.), Handbook of Economic Growth (Vol. 2A, pp.
683–779). Amsterdam: North-Holland. https://
doi.org/10.1016/b978-0-444-53540-5.00004-5 Brzáková, K., & Kraft, J. (2017). Economic Context of European Subsidies and Their Impact on Regional Economic Disparities on the Example of the Czech Republic. E&M Economics and Management, 20(2), 65–76.
https://doi.org/10.15240/tul/001/2017-2-005 Cressie, N. A. (1993). Statistics for Spatial Data. New York, NY: John Wiley & Sons.
Cutrini, E. (2019). Economic integration, structural change, and uneven development in the European Union. Structural Change and Economic Dynamics, 50, 102–113. https://doi.
org/10.1016/j.strueco.2019.06.007
Dall’Erba, S., Percoco, M., & Piras, G.
(2008). The European Regional Growth Process Revisited. Spatial Economic Analysis, 3(1), 7–25.
https://doi.org/10.1080/17421770701733399 Du, K. (2017). Econometric Convergence Test and Club Clustering Using Stata. The Stata Journal, 17(4), 882–900. https://doi.
org/10.1177/1536867X1801700407
Ertur, C., & Le Gallo, J. (2009). Regional growth and convergence: heterogeneous reaction versus interaction in spatial econometric approaches. In R. Capello, &
P. Nijkamp (Eds.), Handbook of Regional Growth and Development Theories (pp.
374–388). Cheltenham: Edward Elgar.
https://doi.org/10.4337/9781848445987.00028 Eurofound. (2018). Upward convergence in the EU: Concepts, measurements and indicators (Report). Luxembourg: Publications Office of the European Union.
Eurostat. (2018). Methodological manual on territorial typologies. Luxembourg: European Union.
Fischer, M., & Stirböck, C. (2006). Pan- European regional income growth and club- convergence. The Annals of Regional Science, 40(4), 693–721. https://doi.org/10.1007/
s00168-005-0042-6
Fischer, M., & Stumpner, M. (2010).
Income distribution dynamics and cross- region convergence in Europe. In M. Fischer,
& A. Getis (Eds.), Handbook of Applied Spatial Analysis (pp. 599–628). Heidelberg: Springer.
https://doi.org/10.1007/978-3-642-03647-7_29 Frenken, K. (2007). Entropy Statistics and Information Theory. In H. Hanusch, & A.
Pyka (Eds.), The Elgar Companion to Neo- Schumpeterian Economics (pp. 544–555).
Cheltenham: Edward Elgar. https://doi.
org/10.4337/9781847207012.00042
Ghosh, M., Ghoshray, A., & Malki, M. (2013).
Regional divergence and club convergence in India. Economic Modelling, 30, 733–742.
https://doi.org/10.1016/j.econmod.2012.10.008 Halmai, P., & Vásáry, V. (2012). Convergence crises: economic crises and convergence in the European Union. International Economics and Economic Policy, 9(3–4), 297–322. https://doi.
org/10.1007/s10368-012-0218-3
Hamit-Haggar, M. (2013). A note on convergence across Canadian provinces: New insights from the club clustering algorithm. The Annals of Regional Science, 50, 591–601.
https://doi.org/10.1007/s00168-012-0500-x
Kallioras, D., & Petrakos, D. (2010).
Industrial growth, economic integration and structural change: Evidence from the EU new member-states regions. The Annals of Regional Science, 45(3), 667–680. https://doi.
org/10.1007/s00168-009-0296-5
Le Gallo, J., & Fingleton, B. (2014). Regional Growth and Convergence Empirics. In M. Fischer,
& P. Nijkamp (Eds.), Handbook of Regional Science (pp. 291–315). Heidelberg: Springer.
https://doi.org/10.1007/978-3-642-23430-9_17 Lengyel, I. (2017). Competitive and uncompetitive regions in transition economies:
The case of the Visegrad post-socialist countries. In R. Huggins, & P. Thompson (Eds.), Handbook of Regions and Competitiveness.
Contemporary Theories and Perspectives on Economic Development (pp. 398–415).
Cheltenham: Edward Elgar. https://doi.
org/10.4337/9781783475018.00026
Lengyel, I., & Kotosz, B. (2018). The catching up processes of the regions of the Visegrad Group countries. Comparative Economic Research, 21(4), 5–24. https://doi.
org/10.2478/cer-2018-0024
LeSage, J. P., & Fischer, M. M. (2009).
Spatial Growth Regressions: Model Specification, Estimation and Interpretation.
Spatial Economic Analysis, 3(3), 275–304.
https://doi.org/10.1080/17421770802353758 Mendoza-Velázquez, A., German-Soto, V., Monfort, M., & Ordóñez, J. (2019). Club convergence and inter-regional inequality in Mexico, 1940–2015. Applied Economics, 52(6), 598–608. https://doi.org/10.1080/00036846.20 19.1659491
Monastiriotis, V. (2014). Regional Growth and National Development: Transition in Central and Eastern Europe and the Regional Kuznets Curve in the East and the West. Spatial Economic Analysis, 9(2), 142–161. https://doi.
org/10.1080/17421772.2014.891156
Monfort, M., Cuesta, J. C., & Ordónez, J.
(2013). Real convergence in Europe: A cluster analysis. Economic Modelling, 33, 689–694.
https://doi.org/10.1016/j.econmod.2013.05.015 Moran, P. A. P. (1950). Notes on Continuous Stochastic Phenomena. Biometrika, 37(1/2), 17–23. https://doi.org/10.2307/2332142
Nagy, B., Lengyel, I., & Udvari, B. (2020).
Reindustrialisation patterns in the post- socialist EU members: A comparative study between 2000 and 2017. European Journal of Comparative Economics, 17(2), 253–275.
Phillips, P., & Sul, D. (2007). Transition Modeling and Econometric Convergence Tests.
Econometrica, 75(6), 1771–1855. https://doi.
org/10.1111/j.1468-0262.2007.00811.x
Quah, D. (1996). Regional convergence clusters across Europe. European Economic Review, 40(3–5), 951–958. https://doi.
org/10.1016/0014-2921(95)00105-0
Sala-i-Martin, X. X. (1996). Regional cohesion: Evidence and theories of regional growth and convergence. European Economic Review, 40(6), 1325–1352. https://doi.
org/10.1016/0014-2921(95)00029-1
Smetkowski, M. (2018). The role of exogenous and endogenous factors in the growth of regions in Central and Eastern Europe: the metropolitan/non-metropolitan divide in the pre- and post-crisis era. European Planning Studies, 26(2), 256–278. https://doi.or g/10.1080/09654313.2017.1361585
Smetkowski, M., & Wójcik, P. (2012).
Regional Convergence in Central and Eastern European Countries? A Multidimensional
Approach. European Planning Studies, 20(6), 923–939. https://doi.org/10.1080/09654313.20 12.673560
Theil, H. (1967). Economics and Information Theory. Amsterdam: North-Holland. https://doi.
org/10.2307/2230396
von Lyncker, K., & Thoennessen, R.
(2017). Regional club convergence in the EU:
Evidence from a panel data analysis. Empirical Economics, 52(2), 525–553. https://doi.
org/10.1007/s00181-016-1096-2
Zdražil, P., & Applová, P. (2016). Growth Disparities among Regions of the Visegrad Group Countries: An Evidence of Their Extent and Nature. E&M Economics and Management, 19(2), 37–54. https://doi.org/10.15240/
tul/001/2016-2-003
Zhang, W., Xu, W., & Wang, X. (2019).
Regional convergence clubs in China:
identification and conditioning factors. The Annals of Regional Science, 62(1), 327–350.
https://doi.org/10.1007/s00168-019-00898-y
Club1: (4)
| Bratislavský | City of Warszawa | City of Wroclaw | Prague | Club2: (22)
| Budapest | City of Krakow | City of Lódz | City of Poznan | City of Szczecin | Gliwicki | Győr-Moson- Sopron | Jihomoravský | Katowicki | Královéhradecký | Legnicko-glogowski | Plocki | Plzeňský | Poznanski | Střední Čechy | Trnavský | Trójmiejski | Tyski | Warszawski zachodni | Wroclawski
| Žilinský | Zlínský | Club3: (34)
| Banskobystrický | Bialostocki | Bielski | Bydgosko-torunski | Czestochowski | Gdanski | Jeleniogórski
| Jihočeský | Kaliski | Košický | Krakowski | Leszczynski | Lubelski | Lódzki | Moravskoslezský | Nitrianský | Olomoucký | Olsztynski | Opolski | Ostrolecki | Pardubický | Piotrkowski | Prešovský
| Rybnicki | Rzeszowski | Siedlecki | Sosnowiecki | Starogardzki | Swiecki | Trenčianský | Vysočina | Warszawski wschodni | Zielonogórski | Zyrardowski |
Club4: (46)
| Bialski | Bytomski | Bács-Kiskun | Chojnicki | Ciechanowski | Csongrád | Elblaski | Elcki | Fejér | Gorzowski | Grudziadzki | Hajdú-Bihar | Heves | Inowroclawski | Karlovarský | Kielecki | Komárom- Esztergom | Koninski | Koszalinski | Krosnienski | Liberecký | Lomzynski | Nowosadecki
| Nowotarski | Nyski | Oswiecimski | Pest | Pilski | Pulawski | Radomski | Sandomiersko- jedrzejowski | Sieradzki | Skierniewicki | Slupski | Suwalski | Szczecinecko-pyrzyki | Szczecinski
| Tarnobrzeski | Tarnowski | Tolna | Vas | Veszprém | Walbrzyski | Wloclawski | Zala | Ústecký | Club5: (8)
| Baranya | Borsod-Abaúj-Zemplén | Békés | Chelmsko-zamojski | Jász-Nagykun-Szolnok | Przemyski | Somogy | Szabolcs-Szatmár-Bereg |
Not convergent Group:(1)
| Nógrád |
Appendix 1: Members of the clubs