Journal Pre-proof
Long-term systemic administration of kynurenic acid brain region specifically elevates the abundance of functional CB1 receptors in rats
Ferenc Zádor, Gábor Nagy-Grócz, Szabolcs Dvorácskó, Zsuzsanna Bohár, Edina Katalin Cseh, Dénes Zádori, Árpád Párdutz, Edina Szűcs, Csaba Tömböly, Anna Borsodi, Sándor Benyhe, László Vécsei
PII: S0197-0186(20)30143-1
DOI: https://doi.org/10.1016/j.neuint.2020.104752 Reference: NCI 104752
To appear in: Neurochemistry International Received Date: 10 April 2020
Revised Date: 7 May 2020 Accepted Date: 8 May 2020
Please cite this article as: Zádor, F., Nagy-Grócz, G., Dvorácskó, S., Bohár, Z., Cseh, E.K., Zádori, D., Párdutz, Á., Szűcs, E., Tömböly, C., Borsodi, A., Benyhe, S., Vécsei, L., Long-term systemic administration of kynurenic acid brain region specifically elevates the abundance of functional CB1 receptors in rats, Neurochemistry International, https://doi.org/10.1016/j.neuint.2020.104752.
This is a PDF file of an article that has undergone enhancements after acceptance, such as the addition of a cover page and metadata, and formatting for readability, but it is not yet the definitive version of record. This version will undergo additional copyediting, typesetting and review before it is published in its final form, but we are providing this version to give early visibility of the article. Please note that, during the production process, errors may be discovered which could affect the content, and all legal disclaimers that apply to the journal pertain.
© 2020 The Author(s). Published by Elsevier Ltd.
Author Statement
Ferenc Zádor: Conceptualization, Methodology, Validation, Formal Analysis, Investigation, Writing-Original Draft, Visualization, Supervision, Project administration. Gábor Nagy- Grócz: Conceptualization, Methodology, Validation, Investigation, Resources, Writing - Review & Editing, Project administration. Szabolcs Dvorácskó: Conceptualization, Methodology, Validation, Investigation, Resources, Writing - Review & Editing. Zsuzsanna Bohár: Methodology, Validation, Investigation, Resources, Writing - Review & Editing.
Edina Katalin Cseh: Methodology, Validation, Formal Analysis, Investigation, Writing - Review & Editing. Dénes Zádori: Writing - Review & Editing, Supervision, Funding acquisition. Árpád Párdutz: Conceptualization, Writing - Review & Editing. Edina Szűcs:
Resources, Writing - Review & Editing. Csaba Tömböly: Writing - Review & Editing, Supervision, Funding acquisition. Anna Borsodi: Conceptualization, Writing - Review &
Editing. Sándor Benyhe: Writing - Review & Editing, Supervision, Funding acquisition.
László Vécsei: Writing - Review & Editing, Supervision,Funding acquisition.
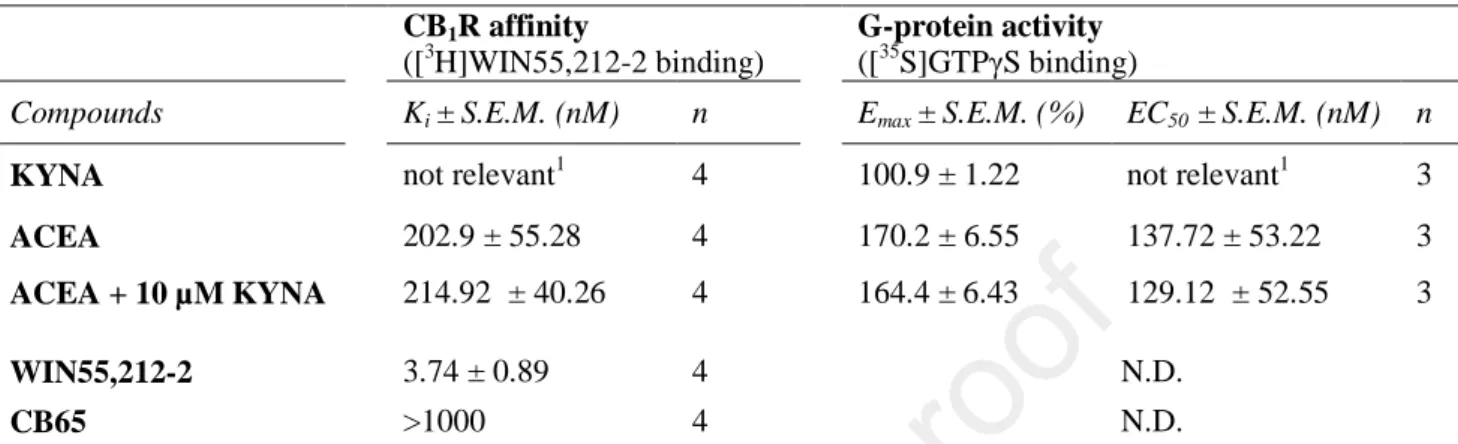
Table 1. CB1R affinity (Ki) and CB1R-mediated G-protein efficacy (Emax) and ligand potency (EC50) values of KYNA and the CB1R selective ACEA alone and in combination with KYNA. Ki values of the non-selective CBR ligand WIN55,212-2 and the CB2R selective CB65 ligand is also indicated for control and for comparison. The indicated parameters were calculated from the concentration-effect curves presented in Figure 2A (Ki) and B (Emax, EC50) and were statistically analyzed as discussed in section ERROR!REFERENCE SOURCE NOT FOUND..
CB1R affinity
([3H]WIN55,212-2 binding)
G-protein activity ([35S]GTPγS binding)
Compounds Ki ± S.E.M. (nM) n Emax ± S.E.M. (%) EC50 ± S.E.M. (nM) n
KYNA not relevant1 4 100.9 ± 1.22 not relevant1 3
ACEA 202.9 ± 55.28 4 170.2 ± 6.55 137.72 ± 53.22 3
ACEA + 10 µM KYNA 214.92 ± 40.26 4 164.4 ± 6.43 129.12 ± 52.55 3
WIN55,212-2 3.74 ± 0.89 4 N.D.
CB65 >1000 4 N.D.
1: Total specific binding (100%) was not altered significantly (one-sample t test with 100 % theoretical value), thus Ki value calculation is not relevant
2: [3H]WIN55,212-2 binding was only reduced to 62 %.
N.D.: not determined.
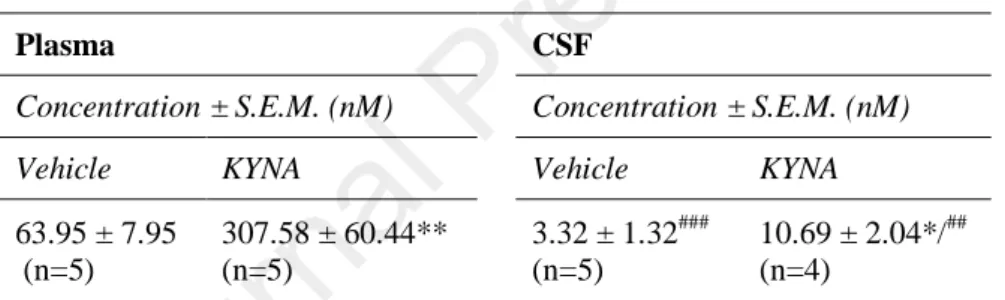
Table 2. KYNA concentration levels in plasma and CSF following systemic KYNA chronic treatment (i.p., 9 days, 128 mg/kg/day). Experiments were analyzed and performed as described in section ERROR! REFERENCE SOURCE NOT FOUND. and ERROR! REFERENCE SOURCE NOT FOUND., respectively.
Plasma CSF
Concentration ± S.E.M. (nM) Concentration ± S.E.M. (nM)
Vehicle KYNA Vehicle KYNA
63.95 ± 7.95 (n=5)
307.58 ± 60.44**
(n=5)
3.32 ± 1.32###
(n=5)
10.69 ± 2.04*/##
(n=4)
*: indicates the significant difference compared to vehicle (unpaired t test, two- tailed P value).
#: indicates the significant difference compared to their corresponding group measured in the plasma (unpaired t test, two-tailed P value).
Table 3. The effect of long-term systemic KYNA treatment (i.p., 9 days, 128 mg/kg/day) compared to vehicle on CB1R-coupled G-protein activity in rat brain membranes described by the indicated parameters obtained from [35S]GTPγS binding assays. CB1R was stimulated by the highly CB1R selective agonist ACEA and inverse agonist rimonabant. The table highlights the non-specific binding (NS), basal activity (Basal) and maximum efficacy (Emax) levels of CB1R-coupled G-protein activity upon receptor stimulation given in specifically bound [35S]GTPγS of protein content. Emax levels and ligand potency (EC50) values were also calculated when data were normalized to basal activity levels (100 %) to see the overall performance of the ligands. Data were obtained from concentration-effect curves shown in Fig. 3 and statistically analyzed based on section ERROR! REFERENCE SOURCE NOT FOUND..
Normalized to protein content Normalized to basal activity
Compounds Treatment (n)
NS ± S.E.M.
(fmol/mg)
Basal ± S.E.M.
(fmol/mg)
Emax ± S.E.M.
(fmol/mg)
Emax ± S.E.M.
(%)
EC50 ± S.E.M.
(nM)
ACEA Vehicle (5) 19.89 ± 1.89 40.43 ± 8.52 61.76 ± 14.57 153.3 ± 6.99 1059.25 ± 626.93 KYNA (8) 23.77 ± 1.39 85.18 ± 13.12* 124 ± 15.95* 152.6 ± 5.6 1713.96 ± 902.28 Rimonabant Vehicle (7) 20.6 ± 1.13 50.56 ± 2.85 12.1 ± 3.78 14.8 ± 6.86 1870.68 ± 601.76 KYNA (7) 22.92 ± 1.55 81.73 ± 2.74*** 26.6 ± 4.41* 27.91 ± 4.74 2004.47 ± 478.91
*: significant difference compared to vehicle treated (unpaired t test, two-tailed P value; *: P < 0.05; ***: P < 0.001 NS: non-specific binding
Table 4. The effect of long-term systemic KYNA treatment (i.p., 9 days, 128 mg/kg/day) on CB1R maximum binding capacity (Bmax) and binding affinity (dissociation constant; Kd) in saturation binding assays using [3H]WIN55,212-2 radioligand to detect CB1Rs in rat brain membranes. Data were obtained and analyzed from concentration-effect curves presented in Fig. 4 as described in section ERROR!REFERENCE SOURCE NOT FOUND..
[3H]WIN55,212-2 saturation binding Treatment (n) Bmax ± S.E.M. (fmol/mg) Kd ± S.E.M. (nM) Vehicle (4) 1339.25 ± 54.79 9.17 ± 1.04 KYNA (4) 1879.09 ± 54.44*** 11.69 ± 0.91
*: significant difference compared to vehicle treated (unpaired t test, two-tailed P value; ***: P < 0.001)
Table 5. The effect of long-term systemic KYNA treatment (i.p., 9 days, 128 mg/kg/day) compared to vehicle on CB1R-coupled G-protein activity in rat cortex, hippocampus and brainstem described by the indicated parameters obtained from [35S]GTPγS binding assays. CB1R was stimulated by the highly CB1R selective agonist ACEA in increasing concentrations. The table highlights the non-specific binding (NS), basal activity (Basal) and maximum efficacy (Emax) levels of CB1R-coupled G-protein activity upon receptor stimulation given in specifically bound [35S]GTPγS of protein content. Emax
levels and ligand potency (EC50) values were also calculated when data were normalized to basal activity levels (100 %) to see the overall performance of the ligand. Data were obtained from concentration-effect curves shown in Fig. 5 and statistically analyzed based on section ERROR! REFERENCE SOURCE NOT FOUND..
Normalized to protein content Normalized to basal activity Brain region Treatment (n)
NS ± S.E.M.
(fmol/mg)
Basal ± S.E.M.
(fmol/mg)
Emax ± S.E.M.
(fmol/mg)
Emax ± S.E.M.
(%)
EC50 ± S.E.M.
(nM)
Cortex Vehicle (3) 5.53 ± 0.18 60.09 ± 6.28 96.03 ± 12.69 159.8 ± 5.92 189.23 ± 74.34 KYNA (3) 5.47 ± 0.03 61.28 ± 3.39 97.96 ± 7.19 160.2 ± 6.4 243.22 ± 97.66 Hippocampus Vehicle (6) 6.49 ± 0.44 84.7 ± 6.45 161.7 ± 8.71 193.1 ± 4.56 130.32 ± 24.69 KYNA (5) 7.42 ± 0.25 119.5 ± 4.46** 217.3 ± 11.93** 186.7 ± 6.28 161.81 ± 38.66 Brainstem Vehicle (6) 9.91 ± 3.02 26.34 ± 2.84 36.39 ± 4.17 129.8 ± 1.92 91.41 ± 20.23
KYNA (4) 9.91 ± 4.49 26.52 ± 6.73 33.18 ± 9.55 130.3 ± 1.92 96.16 ± 22.88
*: significant difference compared to vehicle treated (unpaired t test, two-tailed P value; **: P < 0.01)
Table 6. The effect of long-term systemic KYNA treatment (i.p., 9 days, 128 mg/kg/day) in rat hippocampus on CB1R maximum binding capacity (Bmax) and binding affinity (dissociation constant;
Kd) in saturation binding assays using [3H]WIN55,212-2 radioligand to detect CB1Rs. Data were obtained and analyzed from concentration-effect curves presented in Fig. 6 as described in section ERROR!REFERENCE SOURCE NOT FOUND..
[3H]WIN55,212-2 specific binding
Treatment (n) Bmax ± S.E.M. (fmol/mg) Kd ± S.E.M. (nM) Vehicle (4) 1069.16 ± 96.83 13.39 ± 2.98 KYNA (4) 1403.23 ± 75.36* 16.74 ± 2.07
*: significant difference compared to vehicle treated (unpaired t test, two-tailed P value)
HIGHLIGHTS:
• Kynurenic acid (KYNA) does not interact directly with CB1Rs.
• Chronic, systemic KYNA treatment elevates KYNA CSF and plasma levels.
• The same treatment increases the amount of functional CB1Rs in the whole brain.
• The treatment does not affect the binding and the activity of the receptor.
• Such results also apply to the hippocampus, but not to the cortex or brainstem.
1
Long-term systemic administration of kynurenic acid brain region specifically elevates the abundance of functional CB
1receptors in rats
Ferenc Zádora;1;*;†, Gábor Nagy-Gróczb;c;*, Szabolcs Dvorácskóa,d, Zsuzsanna Bohárc;e, Edina Katalin Csehc, Dénes Zádoric, Árpád Párdutzc, Edina Szűcsa;f, Csaba Tömbölya, Anna Borsodia, Sándor Benyhea, László Vécseic;e
a: Institute of Biochemistry, Biological Research Centre, Szeged, Temesvári krt. 62., H-6726, Hungary
b: Faculty of Health Sciences and Social Studies, University of Szeged, Szeged, Temesvári krt. 31., H- 6726, Hungary
c: Department of Neurology, Interdisciplinary Excellence Center, Faculty of Medicine, Albert Szent- Györgyi Clinical Center, University of Szeged, Szeged, Semmelweis u. 6., H-6725, Hungary
d: Department of Medical Chemistry University of Szeged, Szeged, Dóm tér 8., H-6720, Hungary
e: MTA-SZTE Neuroscience Research Group, University of Szeged, H-6725 Szeged, Hungary
f: Doctoral School of Theoretical Medicine, Faculty of Medicine, University of Szeged, Dóm tér 10., H- 6720 Szeged, Hungary
1: Present address: Department of Pharmacology and Pharmacotherapy, Faculty of Medicine, Semmelweis University, Nagyvárad tér 4, P.O. Box 370, H-1445 Budapest, Hungary
*: These authors contributed equally to the work
†: Corresponding author:
Email address: zador.ferenc@gmail.com Phone: +36-1-210-4405
This work is dedicated to the late Prof. Maria Wollemann
2 ABSTRACT
Kynurenic acid (KYNA) is one of the most significant metabolite of the kynurenine pathway both in terms of functional and potential therapeutic value. It is an N-methyl-D-aspartate (NMDA) receptor antagonist, but it can also activate the G-protein coupled receptor 35 (GPR35), which shares several structural and functional properties with cannabinoid receptors. Previously our group demonstrated that systemic chronic KYNA treatment altered opioid receptor G-protein activity. Opioid receptors also overlap in many features with cannabinoid receptors. Thus, our aim was to examine the direct in vitro and systemic, chronic in vivo effect of KYNA on type 1 cannabinoid receptor (CB1R) binding and G-protein activity.
Based on competition and [35S]GTPγS G-protein binding assays in rat brain, KYNA alone did not show significant binding towards the CB1R, nor did it alter CB1R ligand binding and agonist activity in vitro. When rats were chronically treated with KYNA (single daily, i.p., 128 mg/kg for 9 days), the KYNA plasma and cerebrospinal fluid levels significantly increased compared to vehicle treated group. Furthermore, in G-protein binding assays, in the whole brain the amount of G-proteins in basal and in maximum activity coupled to the CB1R also increased due to the treatment. At the same time, the overall stimulatory properties of the receptor remained unaltered in vehicle and KYNA treated samples. Similar observations were made in rat hippocampus, but not in the cortex and brainstem. In saturation binding assays the density of CB1Rs in rat whole brain and hippocampus were also significantly enhanced after the same treatment, without significantly affecting ligand binding affinity.
Thus, KYNA indirectly and brain region specifically increases the abundance of functional CB1Rs, without modifying the overall binding and activity of the receptor. Supposedly, this can be a compensatory mechanism on the part of the endocannabinoid system induced by the long- term KYNA exposure.
Keywords: type 1 cannabinoid receptor; kynurenic acid; G-protein; [35S]GTPγS binding;
radioligand binding; hippocampus
3 ABBREVIATIONS:
[35S]GTPγS, guanosine-5’-O-(3-[35S]thio)triphosphate ACEA, arachidonyl-2'-chloroethylamide
BBB, blood-brain-barrier Bmax, maximum binding capacity CB1R, type 1 cannabinoid receptor CNS, central nervous system CSF, cerebrospinal fluid
EC50, 50 % effective concentration ECS, endocannabinoid system EGTA, ethyleneglycol-tetraacetate Emax, maximum efficacy
GDP, guanosine 5’-diphosphate GPCR, G-protein coupled receptor GPR35, G-protein coupled receptor 35 GTP, guanosin 5’-triphosphate
GTPγS, Guanosine-5’-O-[γ-thio] triphosphate HPLC, high-performance liquid chromatography Kd, dissociation constant
Ki, inhibitory constant KP, kynurenine pathway KYNA, kynurenic acid L-KYN, L-kynurenine
NMDAR, N-methyl-D-aspartate receptor
Tris-HCl, tris-(hydroxymethyl)-aminomethanehydrochloride
4 1 INTRODUCTION
The endocannabinoid system (ECS) is comprised of the lipid-like endogenous cannabinoids (endocannabinoids), their synthetizing and metabolizing enzymes and the G-protein coupled cannabinoid receptors (CB1R and CB2R), which mediates their effects (Rodríguez de Fonseca et al., 2005). The ECS is a major neuromodulator system maintaining the tones of several physiological processes (Rodríguez de Fonseca et al., 2005). The CB1R is the most abundant G- protein coupled receptor (GPCR) in the central nervous system (CNS), its density is comparable to that of the glutamate, γ-aminobutyric acid (GABA) and dopamine receptors (Herkenham et al., 1990; Matsuda et al., 1990; Piomelli, 2003). It can also be found in the periphery such as in adipose tissues, cardiovascular and gastrointestinal system (Maccarrone et al., 2015; Pagotto et al., 2006). CB1Rs belong to the class A GPCR superfamily and they mostly couple to the Gi/o
type inhibitory G-protein. Thus, their activation inhibits cyclic adenosine monophosphate (cAMP) production and L-type Ca2+ channel activity as well as stimulates K+ channels (Howlett et al., 2002). Overall these signal transductions will eventually inhibit the release of several types of neurotransmitters, such as acetylcholine, GABA, noradrenaline or dopamine (Howlett et al., 2002). These induced changes allow the CB1Rs to be involved for instance in the regulation of mood, energy balance and endocrine functions (Maccarrone et al., 2015; Pagotto et al., 2006;
Pertwee, 2009).
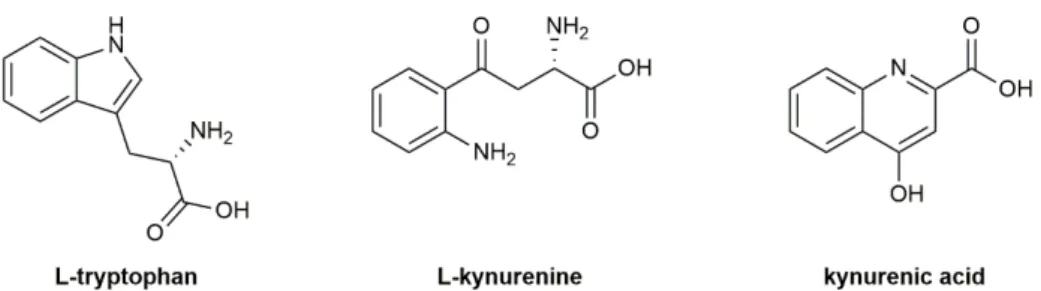
The kynurenine pathway (KP) is the main route of tryptophan (Fig. 1) catabolism and kynurenic acid (KYNA; Fig. 1) - a side product of L-kynurenine (L-KYN; Fig. 1) - is recognized as a potent neuroprotective molecule in several experimental models (Carrillo-Mora et al., 2010;
Chen et al., 2011; Knyihar-Csillik et al., 2008; Lee et al., 2008; Oláh et al., 2013; Silva-Adaya et al., 2011). It has been also well documented that the level of KYNA concentration in the brain is relevant in multiple neurological diseases (Bortz et al., 2017; Vécsei et al., 2013). KYNA is an endogenous ligand for multiple receptors, such as the N-methyl-D-aspartate receptor (NMDAR) and other ionotropic glutamate receptors (Birch et al., 1988; Perkins and Stone, 1985), and the G- protein coupled receptor 35 (GPR35) (Wang et al., 2006).
5
Figure 1. Chemical structure of L-tryptophan, L-kynurenine and kynurenic acid.
Previously we demonstrated that chronic KYNA treatment significantly altered opioid receptor G-protein activity depending on receptor type and brain region, without binding directly to the opioid receptors (Zádor et al., 2014b). This effect also appeared after acute treatments, and the involvement of the NMDAR was also demonstrated (Samavati et al., 2017). In addition, opioid peptides incorporating L-KYN and KYNA have been synthesized and characterized recently, which compounds displayed significant opioid receptor binding, agonist activity and antinociceptive effect (Szűcs et al., 2020). Opioid receptors share similar structural and functional properties with cannabinoid receptors (Viganò et al., 2005), moreover their heterodimerization can be exploited with opioid-cannabinoid bivalent compounds for the development of safer analgesics (Dvorácskó et al., 2019; Fernández-Fernández et al., 2014; Le Naour et al., 2013;
Mollica et al., 2017). More importantly, cannabinoid receptors also resemble to the KYNA activated GPR35 in G-protein signaling, structure, distribution and function (Shore and Reggio, 2015; Wang et al., 2006). Furthermore, exogenous cannabinoids are known to alter the activity of certain enzymes of the KP in a cannabinoid receptor-dependent manner in peripheral blood mononuclear cells (Jenny et al., 2009). Also, acute tetrahydrocannabinol (THC) treatment has been shown to reduce extracellular levels of KYNA through the CB1R in brain reward processing areas (Secci et al., 2018). Thus, a potential cross-talk might be present between the members of KP (enzymes, metabolites) and the ECS. This is supported by overlapping functions in certain mechanisms such as dopamine, glutamate or GABA neurotransmission regulation (Beggiato et al., 2014; Fernández-Ruiz et al., 2010; Javitt et al., 2011; Stone et al., 2007) or immune regulation (Maccarrone et al., 2015; Mándi and Vécsei, 2012). Finally, Beggiato and co-workers recently demonstrated that long-term prenatal THC exposure significantly increases KYNA levels in the prefrontal cortex of adult rats (Beggiato et al., 2020). In the same study they also showed that after a low dose, acute and systemic KYN treatment in adulthood, the increase of
6
KYNA levels in the prefrontal cortex was more pronounced in prenatally THC-exposed rats (Beggiato et al., 2020).
Considering the above mentioned data we designed a set of experiments to investigate for the first time the direct binding/interaction of KYNA to the CB1R in receptor binding and G- protein activity measurements. The CB1R was chosen because it is the most widely studied cannabinoid receptor of the ECS. Additionally, the effect of a long-term KYNA treatment was examined on G-protein activity and CB1R binding, using the same treatment protocol as applied for opioid receptors previously (Zádor et al., 2014b). In these experiments, initially whole brain membranes were investigated after the treatment. The cortex, the hippocampus and the brainstem was further analyzed the same way, since these regions are rich in CB1Rs (Herkenham et al., 1990) and/or mediate important cellular functions.
7 2 MATERIALS AND METHODS
2.1 Chemicals
Tris-HCl, ethylene glycol-bis(β-aminoethyl ether)-N,N,N′,N′-tetraacetic acid (EGTA), NaCl, MgCl2 x 6H2O, guanosine diphosphate (GDP), the guanosine triphosphate (GTP) analogue GTPγS and kynurenic acid (KYNA) were purchased from Sigma-Aldrich (St. Louis, MO, USA).
Fatty acid free bovine serum albumin (BSA) was purchased from Serva (Heidelberg, Germany).
The CB1R specific agonist and inverse agonist arachidonyl-2'-chloroethylamide (ACEA) and rimonabant, respectively and the non-selective cannabinoid receptor agonist WIN55,212-2 were purchased from Tocris Bioscience (Budapest, Hungary). The radiolabeled GTP analogue, [35S]GTPγS (specific activity: 37 TBq/mmol; 1000 Ci/mmol) was obtained from Hartmann Analytic (Braunschweig, Germany). The tritiated WIN55,212-2 ([3H]WIN55,212-2) was radiolabeled in the Laboratory of Chemical Biology (Biological Research Centre, Szeged, Hungary; specific activity: 485 GBq/mmol) (Szűcs et al., 2016). The UltimaGoldTM MV aqueous scintillation cocktail was purchased from PerkinElmer (Per-form kft, Budapest, Hungary).
KYNA for receptor assays was dissolved in highly pure distilled water, while cannabinoid compounds were dissolved in dimethyl sulfoxide. All compounds were stored in 1 mM stock solution at -20 ˚C. All chemicals and reagents used for the high-performance liquid chromatography (HPLC) measurements were of analytical or HPLC grade, and they were acquired from Sigma-Aldrich (St. Louis, MO, USA). The internal standard used for the fluorescent detector, was synthesized at the Department of Pharmaceutical Chemistry, University of Szeged, as detailed elsewhere (Cseh et al., 2019).
2.2 Animals, treatments and sample extraction
Throughout the study, 47 male Sprague-Dawley rats were used; the animals were 8-10 weeks of age, with an average body weight of 250-350 g. For HPLC measurements 6, for whole brain and brain region specific receptor binding assays 8 and 7 animals per group were used, respectively. In KYNA affinity and G-protein activity measurements overall 5 animals were sacrificed. The animals were bred and maintained under standard laboratory conditions on a 12-h dark 12-h light cycle at 22-24 °C and ~55% relative humiditywith free access to water and food pellets. All experimental procedures were carried out in accordance with the European Communities Council Directive (2010/63/EU), and the Hungarian Act for the Protection of
8
Animals in Research (XXVIII.tv. 32.§). We did the best effort to minimize the number of animals and their suffering.
KYNA was dissolved in saline and the pH of the solutions was adjusted to 7.4 with 1 N NaOH. Rats were divided into two groups, KYNA and vehicle treated. KYNA was administered intraperitoneal (i.p.) in a dose of 128 mg/kg/day in a volume of 1 ml to each animal. The animals received the injections once a day in the morning, at the same time for 9 consecutive days based on our previous study (Zádor et al., 2014b). The control group received vehicle, which was 0.9 % saline. The treatments were well tolerated by the animals.
Four hours after the last injection, on the 9th day, rats were deeply anesthetized with chloral-hydrate (Sigma-Aldrich, Budapest, Hungary). Prior to perfusion, the cerebrospinal fluid (CSF) was taken quickly from the suboccipital cistern of rats with 23G needle to Eppendorf tubes (rats were placed to the stereotaxic setup in order to fix their head). Venous blood was collected from the left of the heart chamber to a tube containing EDTA as anticoagulant. Transcardial perfusion was performed with PBS (100 ml, 0.1 M, pH 7.4). The perfused brains were removed rapidly and in case of vehicle and KYNA treated samples the cerebellum was dissected, and the remaining brain area was stored or the cortex, hippocampus and brainstem were excised. For characterizing CB1R binding and activity in vitro in the presence of KYNA, untreated perfused whole brain samples were used. Samples were stored at -80 °C until preparation for the in vitro experiments.
2.3 Receptor binding assays 2.3.1 Membrane preparation
The tissue samples were handled for membrane preparation according to Benyhe and co- workers (Benyhe et al., 1997). The membrane homogenates were used both for [35S]GTPγS binding assays and for saturation binding studies according to Zádor and co-workers (Zádor et al., 2014a). In brief, the samples from the same treatment group and brain region were pooled together and were homogenized, centrifuged in ice-cold TEM buffer (50 mM Tris-HCl, 1 mM EGTA, 3 mM MgCl2, 100 mM NaCl, pH 7.4) and then incubated at 37 oC for 30 min in a shaking water-bath. After incubation, the centrifugation was repeated and the final pellet was again suspended in TEM buffer (pH 7.4). From hippocampus samples membrane fractions were not prepared; they were only homogenized. This was to limit the number of sacrificed animals. Due
9
to the small size of the rat hippocampus, unnecessary number of animals would have been sacrificed for the assays to obtain membrane fractions with adequate protein content. Protein concentrations of the samples were measured by the Bradford method and samples were diluted to obtain the appropriate amount for the assay as described below. Samples were stored -80 oC for further use.
2.3.2 Radioligand competition binding assays
In competition binding assays the specific binding of a receptor selective radioligand is measured in the presence of increasing concentrations of an unlabeled compound (Frey and Albin, 2001). The concentration dependent decrease of radioligand specific binding provides information of the binding affinity of the unlabeled compound by determining the concentration range of 50 % inhibition and the inhibitory constant (IC50, Ki).
Whole brain membrane homogenates containing 0.5 mg/ml of protein were incubated in the presence of 50 mM Tris-HCl, 2.5 mM EGTA, 5 mM MgCl2 and 0.5 mg/ml fatty acid-free BSA (pH 7.4) together with increasing concentrations (0.1 nM-10 µM) of KYNA, ACEA (in the absence or presence of 10 µM KYNA), WIN55,212-2 and CB65, with ~ 1-3 nM concentrations of [3H]WIN55,212-2. The non-specific and total binding was determined in the presence of 10 µM unlabeled WIN55,212-2 and in the absence of unlabeled compounds, respectively. Following a 60 min incubation at 30 oC, the reaction was terminated by rapid filtration under vacuum (Brandel M24R Cell Harvester), and washed three times with ice-cold 50 mM Tris-HCl, 2.5 mM EGTA, 5 mM MgCl2 and 0.5 mg/ml fatty acid-free BSA (pH 7.4) through Whatman GF/B glass fiber filters (GE Healthcare Life Sciences through Izinta Kft., Budapest, Hungary). The radioactivity of the filters was counted in UltimaGoldTM MV aqueous scintillation cocktail with Packard Tricarb 2300TR liquid scintillation analyzer.
2.3.3 Functional [35S]GTPγS binding assays
In [35S]GTPγS binding experiments the GDP→GTP exchange of the Gα protein is monitored in the presence of a given compound in increasing concentrations to measure ligand potency (EC50) and the maximal effect (efficacy; Emax) of receptor G-protein (Strange, 2010). The nucleotide exchange is monitored by a radioactive, non-hydrolysable GTP analog, [35S]GTPγS.
10
The functional [35S]GTPγS binding experiments were performed as previously described (Selley et al., 1997; Traynor and Nahorski, 1995), with modifications. Briefly, the brain samples containing 30 µg/ml protein were incubated at 30 ˚C for 60 min in Tris-EGTA buffer (pH 7.4) composed of 50 mM Tris-HCl, 1 mM EGTA, 3 mM MgCl2, 100 mM NaCl contained 0.05 nM [35S]GTPγS and increasing concentrations (0.1 nM-10 µM) of KYNA, ACEA (in the presence or absence of 10 µM KYNA) or rimonabant and excess GDP (30 µM) in a final volume of 1 ml.
Such assay protocol has been shown to be optimized for monitoring Gi/o-type G-proteins (DeLapp et al., 2004). Total binding was measured in the absence of ligands, while non-specific binding was determined in the presence of 10 µM unlabeled GTPγS. The bound and unbound [35S]GTPγS were separated by rapid filtration under vacuum (Brandel M24R Cell Harvester) through Whatmann GF/B glass fibers and washed three times with ice-cold 50 mM Tris-HCl (pH 7.4). The radioactivity of the filters was measured as described in section 2.3.2.
2.3.4 Saturation binding assays
With saturation binding experiments we can determine the maximum binding capacity of a receptor (Bmax), which also indicates the density of the given receptor in the examined tissue sample (Frey and Albin, 2001). This is done by saturating the receptor with a radioligand specific to that receptor protein applying it in increasing concentrations. Additionally, the affinity of the radioligand can also be determined with the dissociation constant (Kd).
In saturation binding assays membrane preparations containing 0.4 mg/ml of protein were incubated in the presence of 50 mM Tris-HCl, 2.5 mM EGTA, 5 mM MgCl2 and 0.5 mg/ml fatty acid-free BSA (pH 7.4), together with increasing concentrations of [3H]WIN55,212-2 (0.13–65 nM) in the absence (total binding) or presence (non-specific binding) of 10 µM WIN55,212-2.
Following incubation (60 min, 30 ˚C), the bound and unbound [3H]WIN55,212-2 were separated and the radioactivity of the samples were measured as described in section 2.3.2.
11 2.4 HPLC measurements
Validated HPLC methods were performed by an Agilent 1100 HPLC system (Santa Clara, CA, USA), coupled with UV detector (UVD) and fluorescence detector (FLD). The chromatographic separation, and the validation process was described elsewhere (Cseh et al., 2019). Briefly, the brain regions were homogenized in 0.5 M perchloric acid (PCA), at 1:5 w/v containing the internal standards (ISs) 3-nitro-L-tyrosine (3-NLT) and 4-hydroxyquinazoline-2- carboxylic acid (HCA) at a final concentration of 2 µM and 100 nM, respectively. The precipitate was separated by centrifugation for 10 min at 12000 rpm at 4 °C. As for the plasma and CSF samples, both were deproteinized with 0.5 M PCA solution, 1:1 v/v and 5:6 v/v respectively, then the above-mentioned centrifugation process was applied. Afterwards, the chromatographic separations were performed on a reversed-phase C18 column (Kinetex, 150×4.6mm I.D., 5 μm particle size; Phenomenex Inc., Torrance, CA, USA) with a mobile phase composition of 200 mM zinc acetate, at final pH of 5.8 for brain tissue samples and 6.2 for plasma and CSF samples, with a final concentration of 5 % of acetonitrile in each case.Blinded HPLC measurements were conducted to eliminate experimental biases.
2.5 Data analysis
In receptor binding assays, the specific binding of the given radiolabeled compound ([3H]WIN55,212-2, [35S]GTPγS) was calculated by subtracting the non-specific binding from the total binding. Data were normalized either to total specific binding or either to protein content presented in fmol/mg. Total specific binding was set 100 %, which represented the basal activity level of G-protein in the case of [35S]GTPγS measurements. The means ± S.E.M. (standard error of mean) of data sets were plotted in the function of the applied ligand concentration in logarithmic scale (except for saturation binding) and were fitted with GraphPad Prism 7.0 (GraphPad Prism Software Inc., San Diego, CA), by non-linear regression. For competition binding assays the ‘One-site competition’ equation was used to determine the IC50 value (unlabeled ligand affinity) and to calculate the inhibitory constant (Ki) value according to the Cheng-Prusoff equation (Cheng and Prusoff, 1973). Experimental data of [35S]GTPγS binding assays were fitted with the ‘Sigmoid dose-response’ equation to obtain maximum efficacy (Emax) and ligand potency (EC50) values. Saturation binding data were fitted with ‘One-site - specific binding’ equation to visualize maximum binding capacity (Bmax) and dissociation constant (Kd)
12
values. Additionally, in these assays non-specific binding was also plotted with linear regression to compare slopes.
In the HPLC analysis, the relative peak area responses (analyte/internal standard) were plotted against the corresponding concentration, and the linear regression computations were carried out by the least square method with the R software 3.5.3 (R Core Team, 2014).
For two data sets unpaired t test with two-tailed P value, for more than two data sets two- way ANOVA with uncorrected Fisher’s LSD was used. One sample t-test with a hypothetical value of 100 % was applied when given specific binding values were compared to total specific binding (100 %) in receptor binding assays. Statistical analysis was performed with GraphPad Prism 7.0 program; significance was accepted at P < 0.05 level.
13 3 RESULTS
3.1 KYNA does not show direct binding to the CB1R, does not induce G-protein activation nor does it alter CB1R ligand binding or CB1R-mediated G-protein stimulation
To study the binding affinity of KYNA to CB1Rs, competition binding experiments were performed in rat whole brain membranes using [3H]WIN55,212-2, a non-selective cannabinoid radioligand. [3H]WIN55,212-2 showed adequate binding properties on the applied membrane homogenates, reaching a 3.3 nM Ki value in homologous displacement (Table 1, Fig. 2A).
[3H]WIN55,212-2 in the brain preferably binds to CB1Rs, which is supported by our results where the CB2R selective agonist CB65 reduced the total specific binding of [3H]WIN55,212-2 significantly less effectively compared to the CB1R selective ACEA (Table 1, Fig. 2A). For comparison 10 µM CB65 reduced total specific binding of the radioligand to 60 %, whereas in the presence of ACEA total specific binding reached the non-specific binding level (0 %, Table 1, Fig. 2A).
KYNA on its own did not alter significantly the specific binding of the radioligand, indicating the lack of specific affinity towards the CB1R. When KYNA was added in 10 µM to ACEA, no horizontal shifts were observed in the concentration curves of the compound, indicating the lack of allosteric modulation.
G-protein activity measurements were achieved using [35S]GTPγS binding assays also in rat whole brain membranes. In the presence of KYNA in the applied concentration range, [35S]GTPγS specific binding was unaltered, remaining in the basal activity level (Fig. 2B, Table 1.). For comparison the CB1R full agonist ACEA concentration dependently increased [35S]GTPγS specific binding with a maximum effectivity (Emax) of 170.2 % and a potency (EC50) of 137.8 nM (Table 1, Fig. 2B). Additionally, these parameters were not altered in the presence of 10 µM KYNA (Table 1, Fig. 2B).
14
Table 1. CB1R affinity (Ki) and CB1R-mediated G-protein efficacy (Emax) and ligand potency (EC50) values of KYNA and the CB1R selective ACEA alone and in combination with KYNA. Ki values of the non-selective CBR ligand WIN55,212-2 and the CB2R selective CB65 ligand is also indicated for control and for comparison. The indicated parameters were calculated from the concentration-effect curves presented in Figure 2A (Ki) and B (Emax, EC50) and were statistically analyzed as discussed in section 2.5.
CB1R affinity
([3H]WIN55,212-2 binding)
G-protein activity ([35S]GTPγS binding)
Compounds Ki ± S.E.M. (nM) n Emax ± S.E.M. (%) EC50 ± S.E.M. (nM) n
KYNA not relevant1 4 100.9 ± 1.22 not relevant1 3
ACEA 202.9 ± 55.28 4 170.2 ± 6.55 137.72 ± 53.22 3
ACEA + 10 µM KYNA 214.92 ± 40.26 4 164.4 ± 6.43 129.12 ± 52.55 3
WIN55,212-2 3.74 ± 0.89 4 N.D.
CB65 >1000 4 N.D.
1: Total specific binding (100%) was not altered significantly (one-sample t test with 100 % theoretical value), thus Ki
value calculation is not relevant
2: [3H]WIN55,212-2 binding was only reduced to 62 %.
N.D.: not determined.
Figure 2. CB1R binding affinity (A) and G-protein activity (B) of KYNA and the CB1R selective ACEA in the presence or absence of KYNA in concentration-response binding curves of [3H]WIN55,212-2 competition and functional [35S]GTPγS binding assays. Assays were performed in rat brain membrane homogenates. Figures represent the specific binding of [3H]WIN55,212-2 or [35S]GTPγS in percentage (means ± S.E.M.) normalized to total specific binding (100 %, which equals to basal activity in case of G- protein activity) in the presence of increasing concentrations of KYNA (0.1 nM - 10 µM), ACEA (A: 0.1 nM - 10 µM; B: 0.1 nM - 1 µM), WIN55,212-2 or CB65 (0.1 nM - 10 µM). ACEA binding and G-protein activity was also measured in the presence of 10 µM KYNA. Total specific binding was measured in the absence of the indicated compounds. Dotted lines represent total specific binding (A) or basal activity level (B). Curve parameters (A: Ki; B: Emax, EC50) are indicated in Table 1. Curves were fitted as described in section 2.5, binding assays were performed according to section 2.3.2 and 2.3.3.
15
3.2 Chronic systemic KYNA treatment increases the KYNA CSF and plasma levels
In order to investigate whether our applied treatment condition allows the KYNA to enter the CNS, we measured the KYNA concentration in the CSF and also in the plasma for comparison. The plasma KYNA levels significantly increased as expected (Table 2). More interestingly, KYNA CSF levels also increased following the treatment (Table 2), although the concentration levels in both groups were significantly lower as compared to the plasma levels (Table 2). This indicates the limited BBB penetration of KYNA. For reference, plasma and CSF concentrations of other metabolites of the KP were also measured, namely L-KYN and tryptophan. Neither of them showed significant difference following the treatment (Table S1).
Table 2. KYNA concentration levels in plasma and CSF following systemic KYNA chronic treatment (i.p., 9 days, 128 mg/kg/day). Experiments were analyzed and performed as described in section 2.5 and 2.4, respectively.
Plasma CSF
Concentration ± S.E.M. (nM) Concentration ± S.E.M. (nM)
Vehicle KYNA Vehicle KYNA
63.95 ± 7.95 (n=5)
307.58 ± 60.44**
(n=5)
3.32 ± 1.32###
(n=5)
10.69 ± 2.04*/##
(n=4)
*: indicates the significant difference compared to vehicle (unpaired t test, two- tailed P value).
#: indicates the significant difference compared to their corresponding group measured in the plasma (unpaired t test, two-tailed P value).
16
3.3 Chronic systemic KYNA treatment significantly increases the amount of CB1R-coupled G-proteins in rat whole brain, without affecting the efficacy and the potency of the receptor and selective ligands, respectively
In our further experiments the long-term effect of systemic KYNA treatment on CB1R- mediated G-protein activity was investigated in [35S]GTPγS binding assays in rat whole brain membranes (excluding the cerebellum). CB1R was initially stimulated by the CB1R selective agonist ACEA in increasing concentrations (Fig. 3). In the vehicle treated group, as expected ACEA concentration dependently increased the level of [35S]GTPγS specifically bound to CB1R- coupled G-protein as compared to total specifically bound [35S]GTPγS or to basal activity level (Table 3, Fig. 3A). The same tendency was observed in the KYNA treated group, however, the basal activity level significantly increased in these samples, as well as the amount of [35S]GTPγS specifically bound to CB1R-coupled G-protein in the individual concentration points (Fig. 3A, Table 3). The amount of maximally stimulated (Emax) CB1R-coupled G-proteins also significantly increased compared to the vehicle (Table 3). Importantly, the non-specific binding level of [35S]GTPγS did not change significantly between the two groups, which confirms their unaltered overall protein content (Table 3).
To examine whether the overall performance of ACEA was also changed significantly after the treatment, data was normalized to basal activity levels of G-proteins (100 %, Fig. 3B).
The maximum efficacy and the ligand potency (EC50) of the agonist ACEA was significantly not different (Table 3, Fig. 3B), indicating that although the amount of available CB1R-coupled G- proteins increased in the brain, the overall performance of the ligand and the activity of CB1R- coupled G-proteins remained the same.
To support our results, we applied another CB1R selective ligand, namely the highly selective inverse agonist rimonabant. As expected, rimonabant concentration dependently decreased the specifically bound [35S]GTPγS to CB1R-coupled G-protein compared to basal activity. With rimonabant, we obtained the same results as with ACEA, namely the amount of G- proteins and CB1R-coupled G-proteins in both basal activity and maximal efficacy, respectively, significantly increased due to the KYNA treatment. These changes did not alter significantly the overall performance of the ligand similar to ACEA (Table 3, Fig. 3B). As expected, the basal activity and non-specific binding levels in vehicle and KYNA treated groups did not differ
17
significantly between rimonabant and ACEA (Table 3), which also validated the experimental set up.
Table 3. The effect of long-term systemic KYNA treatment (i.p., 9 days, 128 mg/kg/day) compared to vehicle on CB1R-coupled G-protein activity in rat brain membranes described by the indicated parameters obtained from [35S]GTPγS binding assays. CB1R was stimulated by the highly CB1R selective agonist ACEA and inverse agonist rimonabant. The table highlights the non-specific binding (NS), basal activity (Basal) and maximum efficacy (Emax) levels of CB1R-coupled G-protein activity upon receptor stimulation given in specifically bound [35S]GTPγS of protein content. Emax levels and ligand potency (EC50) values were also calculated when data were normalized to basal activity levels (100 %) to see the overall performance of the ligands. Data were obtained from concentration-effect curves shown in Fig. 3 and statistically analyzed based on section 2.5.
Normalized to protein content Normalized to basal activity
Compounds Treatment (n)
NS ± S.E.M.
(fmol/mg)
Basal ± S.E.M.
(fmol/mg)
Emax ± S.E.M.
(fmol/mg)
Emax ± S.E.M.
(%)
EC50 ± S.E.M.
(nM)
ACEA Vehicle (5) 19.89 ± 1.89 40.43 ± 8.52 61.76 ± 14.57 153.3 ± 6.99 1059.25 ± 626.93 KYNA (8) 23.77 ± 1.39 85.18 ± 13.12* 124 ± 15.95* 152.6 ± 5.6 1713.96 ± 902.28 Rimonabant Vehicle (7) 20.6 ± 1.13 50.56 ± 2.85 12.1 ± 3.78 14.8 ± 6.86 1870.68 ± 601.76 KYNA (7) 22.92 ± 1.55 81.73 ± 2.74*** 26.6 ± 4.41* 27.91 ± 4.74 2004.47 ± 478.91
*: significant difference compared to vehicle treated (unpaired t test, two-tailed P value; *: P < 0.05; ***: P < 0.001 NS: non-specific binding
Figure 3. The effect of long-term systemic KYNA treatment (i.p., 9 days, 128 mg/kg/day) on CB1R- coupled G-protein activity compared to vehicle in rat brain membranes depicted in concentration-effect curves of [35S]GTPγS binding assays. CB1R was stimulated by the highly CB1R selective agonist ACEA and inverse agonist rimonabant (Rim.). Figures represent the specifically bound [35S]GTPγS of protein in fmol/mg (A) or in percentage normalized to basal activity levels (100 %) (B) in the presence of increasing concentrations (0.1 nM-10µM) of ACEA or rimonabant. Data are presented as means ± S.E.M. Basal activity levels were determined in the absence of the indicated ligands. Dotted line indicates basal activity levels. * indicates the significant difference of individual concentration points between vehicle and KYNA
18
treated samples (two-way ANOVA, uncorrected Fisher’s LSD; *: P < 0.05; **: P < 0.01; ***: P < 0.001).
Data were fitted as described under section 2.5, assays were performed as discussed in section 2.3.3.
3.4 Chronic systemic KYNA treatment enhances the CB1R maximum binding capacity in rat whole brain without altering the binding affinity of the receptor
In the next step, we examined whether the number of CB1R binding sites also increased apart from the amount of CB1Rs coupled to the G-protein in rat whole brain following chronic systemic KYNA treatment. Saturation binding experiments were conducted using [3H]WIN55,212-2 radioligand to detect CB1R binding sites by applying the radioligand in increasing concentration to saturate the binding sites of the receptors. In vehicle treated samples the amount of [3H]WIN55,212-2 specifically bound to CB1Rs concentration dependently increased and reached saturation, which renders the maximum binding capacity (Bmax) or the density of the receptor (Fig. 4, Table 4). The KYNA treatment significantly increased the amount of specifically bound radioligand to the receptor protein from 4.17 nM compared to vehicle treatment (Fig. 4). As a result, in the KYNA treated group the plateau value of the saturation curve significantly increased, compared to vehicle group, which indicated a significantly higher Bmax value and thus higher receptor density (Fig. 4, Table 4). However, the affinity of the radioligand (equilibrium dissociation constant, Kd), did not change significantly (Table 4). In both samples, the non-specific binding level of the radioligand concentration dependently and linearly increased, as expected (inset of Fig. 4). Additionally, the slope of the linear regression quantifying the non-specific binding level did not change significantly (vehicle: 27.84 ± 1.07 vs.
KYNA: 28.53 ± 0.83), which also validates the equivalent protein content of the two sample groups.
These data, together with the G-protein activity measurements, indicates that the amount of CB1Rs binding sites and CB1Rs coupled to the G-protein increased as a result of chronic KYNA treatment, without affecting the stimulatory or ligand binding of the receptor.
19
Table 4. The effect of long-term systemic KYNA treatment (i.p., 9 days, 128 mg/kg/day) on CB1R maximum binding capacity (Bmax) and binding affinity (dissociation constant; Kd) in saturation binding assays using [3H]WIN55,212-2 radioligand to detect CB1Rs in rat brain membranes. Data were obtained and analyzed from concentration-effect curves presented in Fig. 4 as described in section 2.5.
[3H]WIN55,212-2 saturation binding Treatment (n) Bmax ± S.E.M. (fmol/mg) Kd ± S.E.M. (nM) Vehicle (4) 1339.25 ± 54.79 9.17 ± 1.04 KYNA (4) 1879.09 ± 54.44*** 11.69 ± 0.91
*: significant difference compared to vehicle treated (unpaired t test, two-tailed P value; ***: P < 0.001)
Figure 4. The effect of long-term systemic KYNA treatment (i.p., 9 days, 128 mg/kg/day) on CB1R binding capacity and affinity compared to vehicle in rat brain membranes depicted in concentration-effect curves of [3H]WIN55,212-2 saturation binding assays. Figure represents the specific binding (inset figure:
total and non-specific binding; indicated as ‘Total’ and ‘NS’) of the radioligand in the presence of increasing concentration (0.13 - 65 nM) of the applied radioligand in vehicle and KYNA treated groups. * indicates the significant difference of individual concentration points between vehicle and KYNA treated samples (two-way ANOVA, uncorrected Fisher’s LSD; *: P < 0.05; ***: P < 0.001). Data are presented as means ± S.E.M. and were fitted as described in section 2.5. Saturation binding assays were performed as discussed in section 2.3.4.
20
3.5 Chronic systemic KYNA treatment significantly increases the amount of CB1R-coupled G-proteins in rat hippocampus, but not in the cortex and brainstem In the following experiments, we further investigated the brain region specificity of the obtained G-protein activity results from whole brain. Three main regions relevant to CB1R expression and function were chosen: cortex, hippocampus and brainstem. To detect CB1Rs only the agonist ACEA was used. It was found that compared to the vehicle group only the hippocampus displayed elevated levels of G-protein coupled CB1Rs, whereas in the cortex and brainstem its abundance remained unaltered (Fig. 5, Table 5). Similarly to the whole brain, the basal activity, the levels of ACEA-induced specifically bound [35S]GTPγS and the amount of maximum ACEA-stimulated G-protein coupled CB1Rs in the hippocampus was significantly enhanced as compared to the vehicle treated group (Fig. 5B, Table 5). The potency of the agonist ligand, as well as the maximum efficacy of the stimulated G-protein did not change significantly in the KYNA and vehicle treated groups (Fig. 5E, Table 5). Similar findings were observed in the cortex and brainstem too (Fig 5B and F, Table 5). The non-specific binding levels remained unaltered following the treatment in all three brain regions (Table 5).
21
Table 5. The effect of long-term systemic KYNA treatment (i.p., 9 days, 128 mg/kg/day) compared to vehicle on CB1R-coupled G-protein activity in rat cortex, hippocampus and brainstem described by the indicated parameters obtained from [35S]GTPγS binding assays. CB1R was stimulated by the highly CB1R selective agonist ACEA in increasing concentrations. The table highlights the non-specific binding (NS), basal activity (Basal) and maximum efficacy (Emax) levels of CB1R-coupled G-protein activity upon receptor stimulation given in specifically bound [35S]GTPγS of protein content. Emax levels and ligand potency (EC50) values were also calculated when data were normalized to basal activity levels (100 %) to see the overall performance of the ligand. Data were obtained from concentration-effect curves shown in Fig. 5 and statistically analyzed based on section 2.5.
Normalized to protein content Normalized to basal activity Brain region Treatment (n)
NS ± S.E.M.
(fmol/mg)
Basal ± S.E.M.
(fmol/mg)
Emax ± S.E.M.
(fmol/mg)
Emax ± S.E.M.
(%)
EC50 ± S.E.M.
(nM)
Cortex Vehicle (3) 5.53 ± 0.18 60.09 ± 6.28 96.03 ± 12.69 159.8 ± 5.92 189.23 ± 74.34 KYNA (3) 5.47 ± 0.03 61.28 ± 3.39 97.96 ± 7.19 160.2 ± 6.4 243.22 ± 97.66 Hippocampus Vehicle (6) 6.49 ± 0.44 84.7 ± 6.45 161.7 ± 8.71 193.1 ± 4.56 130.32 ± 24.69 KYNA (5) 7.42 ± 0.25 119.5 ± 4.46** 217.3 ± 11.93** 186.7 ± 6.28 161.81 ± 38.66 Brainstem Vehicle (6) 9.91 ± 3.02 26.34 ± 2.84 36.39 ± 4.17 129.8 ± 1.92 91.41 ± 20.23
KYNA (4) 9.91 ± 4.49 26.52 ± 6.73 33.18 ± 9.55 130.3 ± 1.92 96.16 ± 22.88
*: significant difference compared to vehicle treated (unpaired t test, two-tailed P value; **: P < 0.01)
22
Figure 5. The effect of long-term systemic KYNA treatment (i.p., 9 days, 128 mg/kg/day) on CB1R- coupled G-protein activity compared to vehicle in rat cortex (A and D), hippocampus (B and E) and in brainstem (C and F) depicted in concentration-effect curves of [35S]GTPγS binding assays. CB1R was stimulated by the highly CB1R selective agonist ACEA. Figures represents the specifically bound [35S]GTPγS of protein in fmol/mg (A-C) or in percentage normalized to basal activity levels (100%) (D- F) in the presence of increasing concentrations (0.1 nM - 10 µM) of ACEA. Data are presented as means ± S.E.M. Basal activity levels were determined in the absence of the indicated ligands. Dotted line represents basal activity levels. * indicates the significant difference of individual concentration points between vehicle and KYNA treated samples (two-way ANOVA, uncorrected Fisher’s LSD; **: P < 0.01;
***: P < 0.001). Data were fitted as described under section 2.5, assays were performed as discussed in section 2.3.3.
23
3.6 Chronic systemic KYNA treatment enhances the CB1R maximum binding capacity in rat hippocampus without altering the binding affinity of the receptor
To support our G-protein activity measurements in the hippocampus, we performed saturation binding assays in order to examine the maximum binding capacity of CB1Rs in this brain region. The experimental setup was the same as described in section 3.4.
It was found that the KYNA treatment - as similarly seen in the whole brain - significantly increased the maximum binding capacity of the CB1Rs in the hippocampus, indicating a higher number of CB1R binding sites in this brain region of this group (Table 6. and Fig. 6). The Kd
value of the radioligand did not change significantly, as well as the non-specific binding level, indicated by the significantly unaltered slope (Vehicle: 50.10 ± 1.25 vs. 52.34 ± 0.84; inset Fig.
6).
24
Table 6. The effect of long-term systemic KYNA treatment (i.p., 9 days, 128 mg/kg/day) in rat hippocampus on CB1R maximum binding capacity (Bmax) and binding affinity (dissociation constant; Kd) in saturation binding assays using [3H]WIN55,212-2 radioligand to detect CB1Rs. Data were obtained and analyzed from concentration-effect curves presented in Fig. 6 as described in section 2.5.
[3H]WIN55,212-2 specific binding Treatment (n) Bmax ± S.E.M. (fmol/mg) Kd ± S.E.M. (nM) Vehicle (4) 1069.16 ± 96.83 13.39 ± 2.98 KYNA (4) 1403.23 ± 75.36* 16.74 ± 2.07
*: significant difference compared to vehicle treated (unpaired t test, two-tailed P value)
Figure 6. The effect of long-term systemic KYNA treatment (i.p., 9 days, 128 mg/kg/day) in rat hippocampus on CB1R binding capacity and affinity compared to vehicle depicted in concentration-effect curves of [3H]WIN55,212-2 saturation binding assays. Figures represent the specific binding (inset figure:
total and non-specific binding; indicated as ‘Total’ and ‘NS’) of the radioligand in the presence of increasing concentration (0.59 - 64.5 nM) of the applied radioligand in vehicle or KYNA treated groups. * indicates the significant difference of individual concentration points between vehicle and KYNA treated samples (two-way ANOVA, uncorrected Fisher’s LSD; *: P < 0.05; **: P < 0.01). Data are presented as means ± S.E.M. and were fitted as described in section 2.5. Saturation binding assays were performed as discussed in section 2.3.4.
25 4 DISCUSSION
A special attention has been given recently to the overlapping elements of the KP and the ECS and this field has been reviewed by our group and by others previously (Colín-González et al., 2016; Nagy-Grócz et al., 2017; Zádor et al., 2019). Our study focuses on two significant components of the KP and the ECS, the KYNA and the CB1R, respectively. Both elements are widely present throughout the body, however, the brain is where they have prominent roles and are most studied. In this work, we found for the first time, that enhanced CSF KYNA levels induced by systemic long-term KYNA treatment increased the abundance of functional CB1Rs in whole brain, which is also manifested in the hippocampus. Importantly, this effect was indirect, as KYNA did not show affinity towards the CB1R.
One of the key initial points of our current work was the well-known fact that KYNA is an endogenous agonist ligand for GPCR35, which similarly to the CB1R belong to the GPCR family and activates Gi/o-mediated signaling (Demuth and Molleman, 2006; Guo et al., 2007; Ohshiro et al., 2008; Wang et al., 2006). Thus, it was intriguing to examine the binding and receptor activation capabilities of KYNA to the CB1R. Based on our binding studies KYNA did not bind directly to the CB1R, furthermore it did not alter the affinity of the CB1R specific ligand, ACEA.
To examine the receptor activation (agonist, inverse agonist or antagonist) properties of KYNA on the receptor, we applied [35S]GTPγS binding assays. As mentioned in section 2.3.3, our experimental protocol is optimized for monitoring Gi/o-type G-proteins (DeLapp et al., 2004), which G-protein type is also stimulated by KYNA via GPR35 (Milligan, 2011; Wang et al., 2006). Accordingly, agonist-stimulated CB1R coupled G-protein activity was unaltered in the presence of KYNA and the monitored G-proteins were not stimulated when only KYNA was present. These data, together with our receptor binding affinity results confirms that KYNA does not interact directly with the CB1R. Worthy of note, G-protein activity was measured in rat brain, where GPR35 receptors are sparsely expressed (Taniguchi et al., 2006), which is why we did not observe KYNA-stimulated GPR35 coupled G-protein activation in our samples. Additionally, the difference in the amino acid residues that form the binding pocket and that are responsible for agonist binding of CB1R and GPR35 (Krishna Kumar et al., 2019; Milligan, 2011; Zhao et al., 2014) may explain why KYNA did not bind to the CB1R. Similar to other class A GPCRs, the binding pocket of CB1R and GPR35 is formed by almost the same transmembrane helix domains (3; 6 and 7) (Krishna Kumar et al., 2019; Milligan, 2011; Venkatakrishnan et al., 2013; Zhao et
![Table 3. The effect of long-term systemic KYNA treatment (i.p., 9 days, 128 mg/kg/day) compared to vehicle on CB 1 R-coupled G-protein activity in rat brain membranes described by the indicated parameters obtained from [ 35 S]GTPγS bindin](https://thumb-eu.123doks.com/thumbv2/9dokorg/972305.58185/6.892.12.862.319.518/systemic-treatment-compared-activity-membranes-described-indicated-parameters.webp)
![Table 4. The effect of long-term systemic KYNA treatment (i.p., 9 days, 128 mg/kg/day) on CB 1 R maximum binding capacity (B max ) and binding affinity (dissociation constant; K d ) in saturation binding assays using [ 3 H]WIN55,212-2 r](https://thumb-eu.123doks.com/thumbv2/9dokorg/972305.58185/7.892.242.653.384.802/systemic-treatment-maximum-capacity-affinity-dissociation-constant-saturation.webp)
![Table 5. The effect of long-term systemic KYNA treatment (i.p., 9 days, 128 mg/kg/day) compared to vehicle on CB 1 R-coupled G-protein activity in rat cortex, hippocampus and brainstem described by the indicated parameters obtained from [ 35 S]GTPγS](https://thumb-eu.123doks.com/thumbv2/9dokorg/972305.58185/8.892.29.865.341.603/systemic-treatment-compared-hippocampus-brainstem-described-indicated-parameters.webp)

![Figure 3. The effect of long-term systemic KYNA treatment (i.p., 9 days, 128 mg/kg/day) on CB 1 R- R-coupled G-protein activity compared to vehicle in rat brain membranes depicted in concentration-effect curves of [ 35 S]GTPγS b](https://thumb-eu.123doks.com/thumbv2/9dokorg/972305.58185/33.892.96.787.612.930/figure-systemic-treatment-activity-compared-membranes-depicted-concentration.webp)
![Table 4. The effect of long-term systemic KYNA treatment (i.p., 9 days, 128 mg/kg/day) on CB 1 R maximum binding capacity (B max ) and binding affinity (dissociation constant; K d ) in saturation binding assays using [ 3 H]WIN5](https://thumb-eu.123doks.com/thumbv2/9dokorg/972305.58185/35.892.206.682.234.784/systemic-treatment-maximum-capacity-affinity-dissociation-constant-saturation.webp)

