Smoking
C . L. C U T T I N G1
Humber Laboratory, Hull, England
I . Introduction 5 5 I I . T h e o r e t i c a l A s p e c t s 58
A. T h e Physics of W o o d S m o k e
B y W . W . F o s t e r 58 B . T h e C h e m i s t r y of W o o d S m o k e
B y Τ . H . S i m p s o n 69 C . F a c t o r s Affecting the D r y i n g of F i s h d u r i n g S m o k i n g
B y A. C . J a s o n 73 I I I . Practical A s p e c t s 8 0
A. T y p e s of P r o d u c t 8 0 B . T h e P r e p a r a t i o n of F i s h for S m o k e - C u r i n g 8 1
C . S m o k i n g 9 0 D . P o s t - S m o k i n g T r e a t m e n t 9 9
References 100
I. Introduction
Smoking, or smoke-curing as applied to fish, is a method of preser
vation effected by a combination of drying and the deposition of naturally produced chemicals resulting from the thermal breakdown of wood. In the course of time certain of the types of products developed have attained a special acceptability of their own, and the smoky flavor in particular has become an attraction in the manner of a condiment.
Table I summarizes the most recent statistics ( F o o d and Agriculture Organization of the United Nations, 1957) for smoked fish production of the major countries, which indicate that the U.S.S.R., Germany, and the United Kingdom are by far the largest producers and consumers, while in the diet of the United States and Canada it is of relatively minor importance (Anderson and Pedersen, 1951). However, many areas in which it is known that fish is smoked for home consumption, such as British West Africa (e.g., Steven, 1944), are excluded from the estimated world total production of some 250,000 tons. Smoking was formerly associated with heavy salting in producing a long-keeping commodity (e.g., "red" herring, see Table I V ) , and this type of product is still not without the possibilities of further development, in countries where
1 Present a d d r e s s : British F o o d M a n u f a c t u r e r s ' Industrial R e s e a r c h Association, Surrey, E n g l a n d .
55
56 C. L . CUTTING
the early state of industrial development, including communications, limits the rapid distribution of fresh fish (Nicholson, 1909; Graham, 1929; Cutting, 1949; Jarvis, 1954). Among most industrialized nations, the market for such "hard" cures began to decline when the railway networks, established in the middle of the nineteenth century, permitted for the first time the widespread distribution of fish in the fresh, iced
T A B L E I
E S T I M A T E D P R O D U C T I O N O F S M O K E D F I S H I N C E R T A I N C O U N T R I E S T o t a l
p r o d u c t i o n
( t h o u s a n d s Principal species
C o u n t r y Year of t o n s ) ( t h o u s a n d s of t o n s ) U . S . S . R . 1 9 5 6 6 7 . 8 S t u r g e o n
G e r m a n y ( F e d .
R e p . ) 1956 3 8 . 1 8 5 - 9 0 % Herring; eels, m a c k e r e l
U n i t e d K i n g d o m j f 1 9 5 6
^ 1 9 5 3
16.7 2 4 . 4
Herring, mostly k i p p e r s C o d a n d h a d d o c k
Union of South 1956 2 2 . 2 18.1 H a k e , 3.6 snoek
Africa
N e t h e r l a n d s 1 9 5 6 15.9 11.0 H e r r i n g
U n i t e d States of 1 9 5 3 11.9 5.4 S a l m o n , 2.9 fresh-water fish,
A m e r i c a 1.6 sablefish, 0.6 herring
Poland 1 9 5 6 10.8 —
Philippines 1 9 5 6 9.7 —
T h a i l a n d 1 9 5 6 8.1 —
C a n a d a 1 9 5 6 5.8 4 . 5 Herring, 0.8 h a d d o c k , 0.3 cod, etc.
N o r w a y 1956 4.0 H e r r i n g a n d sprats
D e n m a r k 1 9 5 6 3.6 1.8 Herring, 1.2 mackerel, 0.6 eel
B e l g i u m 1 9 5 5 2.4 2 . 1 H e r r i n g a n d sprats
S w e d e n 1 9 5 5 1.6 1.0 H e r r i n g
J a p a n 1 9 5 6 1.2
—
C h i l e 1 9 5 6 0.2
—
N e w f o u n d l a n d 1 9 5 6 0.2 C o d fillets
Ireland 1 9 5 6 0.1 H e r r i n g
Argentine 1 9 5 3 0.1 —
T a i w a n 1 9 5 3 0.1 —
E s t i m a t e d g r a n d total 2 5 2 . 0
state and of mildly cured, blander, and more perishable products which had been subjected to a less severe smoking treatment (Cutting, 1955;
and see Volume II, Chapter 1 for further details of the history of this change). This evolutionary process is still continuing in the direction of ever more lightly processed products, and the trend has been accelerated in recent years by the growth of freezing in consumer packs, in which the preservation is taken care of by the low temperature.
In addition to the dichotomy between "hard" and "mild" cures, there is a further division into the type of process, namely hot-smoking and cold-smoking, depending on whether the product emerges from the
"kiln" cooked or raw. Britain has, with minor exceptions, remained a cold-smoking country, whereas the mainland of Europe has to a much larger extent favored hot-smoking, so that the United States has, from its mixed national origins, adopted a variety of both processes adapted to their own conditions (Stevenson, 1899; Jarvis, 1933, 1950).
Throughout Asia, Africa, and South America, where conditions, although varied, are generally more primitive and the climate severe, such combinations of smoking, drying, and cooking as "barbecuing,"
are regularly practiced, and although the products are acceptable because preserved, these are not usually such as would commend themselves to sophisticated palates of more highly developed countries (Deraniyagala, 1933; Martin, 1934; Agricultural Adviser to the Government of India, 1941; Avery, 1950).
However, the methods of smoking in general use, even in Britain, are still little removed from those of medieval times, nor even in any essential respect, excepting scale, from those used by primitive tribes, although the products, of course, present considerable differences. As far as Britain is concerned, only relatively recently has the mechanization of the process been considered, although perhaps associated with this it is already possible to detect the beginnings of an outlook more in keeping with the requirements of a food industry as regards quality control and hygiene. This change of attitude may perhaps b e not un
related to the marked decline in the consumption of smoked products in the post-1945 period, for which various reasons can be adduced, such as more plentiful supply of other foodstuffs, but it is becoming in
creasingly realized that a radical change in production methods and ideas is called for if smoked fish is to compete and survive.
Nor are other countries, generally speaking, greatly in advance of Britain. Possibly the smoking of fish is a declining, if not actually a dying, industry. It may be that the taste for smoke on foods is dis
appearing except for a minority which continues to acquire liking for this sort of flavor. Nevertheless, a considerable amount of research and development effort is being devoted in Britain (Cutting, 1942; Shewan, 1954; Food Investigation Board, 1957) and elsewhere (e.g., L e Gall, 1938; Dieuzeide and Mercier, 1941; Linton and French, 1945; Tilgner, 1957) to obtaining the scientific and technical information that would enable quality to b e controlled at an attractive level.
The results of scientific interest that have so far emerged from an attack on the problems of fish smoking, under the auspices of the United Kingdom Government Department of Scientific and Industrial Research,
5 8 C. L . CUTTING
will first b e discussed in Section II before considering more practical aspects in Section III.
II. Theoretical A s p e c t s
A. T H E PHYSICS OF W O O D S M O K E
By W. W. Foster, Torry Research Station, Aberdeen, Scotland 1. Physical Properties of Smoke
Although very little has been published about the physical properties of wood smoke, a recent study has m a d e it possible for a picture to be built up (Foster, 1 9 5 7 ) .
When wood is heated and undergoes destructive distillation, it gives off gases and vapors, some of which condense on nuclei in the cool zone above the fire to form a stable aerosol, composed of minute tarry droplets ("particles"), which constitutes the visible smoke. Under a given set of conditions, the mass concentration of the particle phase bears a fixed ratio to that of the vapors. The chemical composition of both phases is similar, but the particles contain a greater proportion of components of high molecular weight (see Section II, Β ) . The partition of mass concentration between particles and vapors, as well as their chemical composition, depends on the nature of the sawdust and the conditions of combustion. The quantity of smoke deposited is a complex function of the composition and concentration of the smoke, the environmental conditions and the nature of the surface.
a. PARTICLE S I Z E
The average size and size distribution of any aerosol is dependent on the conditions under which the vapors are produced and cooled (Whytlaw-Gray and Patterson, 1 9 3 2 ) . When the gases and vapors resulting from the destructive distillation of wood are diluted rapidly by air passing over the sawdust bed, as in the Torry mechanical kiln
(Cutting, 1 9 5 0 ) , the consequent rapid cooling gives rise to very small particles of about 0 . 1 μ radius. Although the smoke cloud as a whole might b e stationary, the individual particles have considerable Brownian motion, as a result of which they come into contact with each other and coagulate. T h e average particle radius, therefore, tends to increase.
Using a theoretical equation of coagulation (Smoluchowski, 1 9 1 7 ) , calculations can b e m a d e ( T a b l e I I ) of the approximate time in which the number of wood smoke particles decreases to one-half the initial number, assuming negligible losses to the walls of the containing vessel. In the most simple case, each pair of particles becomes one particle of radius 3 / 2 times the initial radius.
The theoretical rate of coagulation of wood smoke, whose particles are about 0.1 μ radius, is rapid for mass concentrations greater than about 0.1 mg./liter. Wood smokes are usually more concentrated than this.
The actual rate of coagulation of wood smoke appears to b e greater than the theoretical rate (Foster, 1957). Other factors, such as turbulence and gravitational settling, can also give rise to coagulation (Langstroth and Gillespie, 1947). Since wood smoke aerosols are transient in this way, particle size analysis by sampling and microscopic examination is
T A B L E I I
T I M E I N S E C O N D S I N W H I C H N U M B E R O F P A R T I C L E S D E C R E A S E S τ ο H A L F T H E I N I T I A L N U M B E R
M a s s
concentration Initial radius ( μ )
( m g . / l i t e r ) 0.05 0.10 0.15 0.20
0.01 1 2 5 1,000 3 , 3 7 5 8 , 0 0 0
0.05 2 5 2 0 0 6 7 5 1,600
0.10 12.5 1 0 0 3 3 8 8 0 0
0.20 6.3 5 0 1 6 9 4 0 0
0.30 4.2 3 3 1 1 3 2 6 7
0.40 3 . 1 2 5 8 5 2 0 0
0.50 2 . 5 2 0 6 8 1 6 0
1.00 1.3 10 3 4 8 0
prone to error. Foster (1957) found that sampling by impaction and gravitational settling led to spuriously high values of average radius and that electrical deposition yielded a truer figure. After sampling, the particles were shadow cast with aluminum under vacuum. This technique was used since wood smoke particles lose at most only about 20% of their weight by evaporation. The particles were then examined under oil immersion. It was clear that the particles were spherical before deposition and were composed of very viscous liquid. However, as the particles were near to the limit of resolution of the light microscope, the average size could not b e measured accurately and two indirect methods had to be used, one of which was developed during the course of the work.
The optical density of the smoke from a miniature "fluidizer" (Nicol, 1957) measured by means of a meter (Section II, A, 4, b ) , was controlled by means of the mechanism which fed sawdust to the "fluidizer." This smoke was then passed through a short, earthed cylinder containing a fine axial corona wire at a high voltage. Although some of the particles were precipitated in this charger, most of the smoke passed through the tube. As is the case for other smokes produced by low-temperature distillation, a small proportion of the particles of normal wood smoke are charged, but the number of charges on each particle is never more
60 C. L . CUTTING
than a few electron units. Furthermore, there appear to be equal proportions of positive and negative charges and the smoke as a whole is, therefore, electrically neutral. When the corona charging field was intense enough (e.g., a voltage greater than 6 kv. on a 36 swg. wire in a tube of diameter 2.5 cm.), the particles emerging from the charger were electrically charged with the same sign as the corona wire. The charged smoke was then passed through a long tube consisting of short cylindrical sections which could be weighed. No external field was applied to the charged smoke inside the tube but it deposited copiously on the inside walls of the tube as a result of mutual repulsion of the charged particles.
Residual smoke leaving the long tube was collected by a final electrical precipitator. By determining the distribution of weight of the smoke deposited in the tube and by measuring the total charge given up by the particles, the average particle radius was calculated to b e about 0.10 μ, which agreed fairly well with that which was calculated from measure
ments of the optical density and the mass concentration of the particle phase (about 0.14 μ ) , and with the direct observation that wood smoke particles were near to the limit of visual resolution.
b. R A T E OF DEPOSITION
Uncharged aerosol particles deposit on surfaces under the influence of forces of gravity, turbulence, diffusion (Brownian motion), and a force arising from the effects of any temperature gradient, known as the radiometer force (Epstein, 1929; Rosenblatt and LaMer, 1946;
Saxton and Ranz, 1952). Fresh smoke (of the order 0.1 μ radius) deposits mainly under the influence of diffusion and radiometer forces and old smoke (which can b e of the order 0.5 μ radius) deposits mainly under the influence of gravitational and turbulence forces. However, the rate of deposition of wood smoke particles on dry metal surfaces is only of the order micrograms/cm.2/hour.
2. Electrostatic Deposition
To enhance the rate of deposition of the particle phase of wood smoke, electrical methods of precipitation may be used. In the most common method as applied to food processing, the smoke particles are charged and deposited in the electrical field which is applied between fine wires at a high voltage and the earthed flesh ( H a m m and Rust, 1947; Hanley et al, 1955; Sikorski, 1956; Anonymous, 1954). The main disadvantages of this method are that the high voltage electrodes must be near to the flesh, so giving rise to safety and arcing problems, and that existing plants cannot be easily adapted to electrostatic smoking. Further
more, it is not possible to treat large quantities of fish simultaneously.
To overcome some of these disadvantages, the particles were charged and then allowed to disperse among fish mainly under the action of forces of mutual repulsion (Foster and Jason, 1954; Foster, 1956). In this way, large quantities of fish could be processed batch-wise. The possibility of danger to personnel was reduced; arcing could not occur between the high voltage electrodes and the fish, and existing kilns could be converted for a small capital cost. A Torry kiln was converted to the new process by placing at the inlet plenum of the kiln a charging unit which consisted of alternate wires (36 swg.) at a high voltage (about 10 kv.) and 2.5 cm.-diameter earthed rods, the rods being about 6.3 cm. center to center. For lightness, tubes of the same outside diameter (2.5 cm.) could be substituted for the rods. After passing through the charging unit, the charged smoke dispersed among the fish in the kiln.
With this arrangement it was found that kippers could b e smoked in about half the normal time, but that it was necessary to dry to the normal weight loss of about 15% to obtain a flavor almost indistinguish
able from that of an ordinary kipper.
3. Rehtive Importance of Particles and Vapors
In view of the fact that the rate of deposition of smoke on dry surfaces was considerably enhanced by the electrical charging of the smoke, it was difficult to see why the kippering time was only cut to one-half of the normal value. Further experiments showed that the process of deposition of smoke on wet surfaces (such as water, white fish, and herrings) is completely different from that on dry surfaces. In the former case, the vapors contribute much more to the total deposit than the particles. In studying the relative contributions of the particle and vapor phases, some water surfaces were smoked with the vapors and the particles together and others were smoked with the vapors alone, after clearing the smoke of particles by means of electrical precipitation. E a c h sample of smoked water was then freeze-dried and the weighed residue taken as an index of the total amount of smoke deposited initially on the water. The residues were dark brown, viscous, and relatively involatile, thus resembling the particle phase. It was found that the rates of deposition of smoke on water were between about five and twenty times greater than the rates of deposition of smoke on dry surfaces. The rate of deposition of smoke increased as the rate of evaporation of water during smoking increased. Furthermore, this re
lationship was the same whether the particles were present or not. It was concluded that the particle phase of wood smoke played an insignificant role in the process. These experiments were repeated in less detail using pieces of cod, when visual examination showed that
62 C. L . CUTTING
the rate of deposition of smoke again increased as the rate of drying of the fish increased.
The deposition of smoke on fish, therefore, appears to be a process similar to that occurring in gas-scrubbing columns.
4. Optical Properties
a. G E N E R A L
In spite of the fact that the visible smoke particles are not deposited significantly on fish during smoking, experiments have shown that for any particular type of smoke, the quantity deposited on fish is, in fact, related to the "optical density," D, defined by the ratio:
where J 0 is the initial intensity of a beam of light and 1% the intensity after it has passed through smoke for a path length I. (Thus, a smoke density of 1.0 corresponds to 90% absorption and 10% transmission of light.)
The Beer-Lambert L a w :
I, = I o X l O - *t o ( 2 )
where c is the mass concentration of the smoke and k is a constant (the
"extinction coefficient") dependent on the nature and size distribution of the smoke particles, and the spectral distribution of the light used, has been found by Foster (1957) to apply to wood smoke.
However, the relative mass concentrations of the particle and vapor phases vary with the method of generation, so that smoke in, say, traditional kilns, mechanical kilns, and "fluidizers," having the same optical density may not be deposited at the same rate on wet surfaces.
Furthermore, the optical density of the particle phase is very markedly dependent on particle size (Mie, 1908; Barnes and LaMer, 1946).
The color of the smoke depends on the particle size. The theory of the scattering of light is rather complex. Thus, at 0.1 μ diameter particle size, the smoke is red by transmitted light, while at 0.5 μ the absorption is the same for the same mass concentration, but the smoke appears blue.
In both cases it is blue as a result of scattering when viewed at right angles to the direction of the incident light.
b. T H E M E A S U R E M E N T OF S M O K E
By A. C. Jason, Torry Research Station, Aberdeen, Scotland
No single characteristic of smoke or its effects is independent of the type of sawdust and conditions of production and deposition. Conse-
quently, no absolute measure of intensity of smoking can b e devised.
Nevertheless, a rough index is desirable and the optical properties have been the basis of many attempts (see reviews by Locklin and Parmelee, 1950; Tasker, 1951), particularly the scattering (Anonymous, 1932) or the attenuation of light by smoke particles. The scattering method is suitable only for the measurement of smokes of very low density owing to the effects of multiple scattering which becomes serious when the particles are very close. Methods based on the attenuation of light do not suffer so severely from this disadvantage, and, in general, they are simpler.
Subjective methods have been used, such as the visibility of a number of equally spaced objects placed in the smoke in line with the observer, the number of objects just visible being a measure of the density of the smoke; or the distance at which an object, a letter, a number, or a self-luminous source can just b e distinguished.
Ringelmann (see Donkin, 1898) devised a series of numbered charts on each of which was inscribed a black rectangular grille on a white background; the thicknesses of the lines of the grille were varied from chart to chart so that when viewed at a distance they appeared as graduated shades of grey, varying from white to black in five steps.
The number of the chart which most closely matched the smoke was called the "Ringelmann number." The accuracy of the method (which is still in u s e ) , and of all such methods, suffers from the effects of the intensity, direction, and type of lighting, the extension of the smoke, the distance of the observer, and his judgment.
When photoelectric cells became available, various objective methods of measuring the optical density of smoke were devised. The simplest of these is the measurement of the attenuation of light passing through the smoke by means of a barrier layer photoelectric cell. The arrangement consists simply of a lamp and lens which project a parallel beam of light through the smoke onto the cell, the output from which is measured by a meter. The current through the meter, therefore, becomes a measure of the light attenuated by the smoke.
It is evident from E q . 1 that the attenuation of the light ( 70 — sometimes expressed as "percentage obscuration" (i.e., 100 ( I0 — Z ) / I0) , is not proportional to the optical density of the smoke and is, therefore, not a satisfactory index of this quantity. In general, commercially available smokemeters indicate "smoke density" either as "percentage obscuration" or as a "Ringelmann number" or as an arbitrary number, and there is often no direct way of relating the measurements of one indication to those of another.
64 C. L . CUTTING
Combining E q s . 1 and 2 we have
D = klc ( 3 ) Hence: = kc = S
l ( 4 )
Thus for a given smoke and a given light source the quantity S, the optical density per unit length, may therefore b e used to define the density of the smoke since it gives a direct method of estimating the actual mass of smoke particles present in a given volume.
A barrier-layer photoelectric cell provides an output current propor
tional to the intensity of the light falling on its surface provided that the external load is less than a few hundred ohms. This is the basis of operation of most industrial smokemeters. The "percentage obscuration"
is derived simply from a suitably graduated meter scale on which "zero obscuration" corresponds to the position of the pointer when no smoke is present and "100% obscuration" to its position when no light is transmitted. Although linear in "percentage obscuration," this method of presentation becomes increasingly insensitive as smoke density in
creases. Additional, more serious, disadvantages inherent in this simple form of smokemeter are: ( a ) aging of lamp; ( b ) sagging of lamp filament; ( c ) fluctuation of lamp intensity with mains supply variations;
( d ) short- and long-term fatigue of photoelectric cell; ( e ) temperature sensitivity of photoelectric cell characteristics; ( f ) deposition of smoke on end windows defining light path in smoke.
Errors arising from variations in the characteristics of the detector, but not of the source may be considerably reduced by the double-beam method first proposed by Darwin (1906). Numerous photoelectric densitometers have been designed to reduce or to eliminate one or more of these sources of error but mostly for the measurement of the densities of photographic images.
More recently a recording smokemeter has been devised, in connection with research on domestic solid fuel appliances (Littlewood, 1956) in which the effects of mains supply variations, temperature sensitivity, and smoke deposition on end windows have been considerably reduced.
This instrument is notable for the introduction of a neutral density optical wedge in a double-beam null-balancing system using two lamp and photo
electric cell units, one in the flue and the other in the recorder itself.
The optical wedge is m a d e to vary the output from the photoelectric cell in the recorder to correspond with that in the flue unit and its position then serves to indicate the optical density of the smoke.
Difficulties arising from the differential aging of the lamps and photo
electric cells are, however, still present.
The problem has been completely resolved in its application to the measurement of smoke in chimneys by a double-beam method null- balancing system (Bredl and Marsdon, 1950).
Several difficulties peculiar to the application of these instruments to the measurement of smoke in fish kilns arise from the nature and function of these kilns. In general the dimensions of a kiln are such that a beam of light traversing its width is too severely attenuated for convenient measurements of its intensity. Often a number of kilns are grouped together side-by-side in smokehouses wThere it is not possible to mount a source and detector externally with respect to each smoke
house. Smoking times of several hours are common and kilns are frequently not completely cleared of smoke for several days so that zero adjustment of an instrument is, therefore, not convenient. Further
more, the precautions normally taken to prevent smoke deposition on the surfaces of the end windows of industrial smokemeters (such as allowing clean air from outside the chimney to b e drawn by convection over the windows) are not practicable under the conditions obtaining.
A smokemeter for use in such kilns must b e reliable, stable, robust, and inexpensive.
Two instruments have been designed at the Torry Research Station, one sacrificing some stability for cheapness and the other gaining stability at the expense of simplicity.
The simpler of these (Storey, 1957) consists essentially of a stabi
lized source of parallel light (Fig. 1) which passes through a fixed length of smoke onto a detector. The whole arrangement is supported on a short frame which is suspended entirely within the kiln. Sufficiently good stabilization of the source is provided by energizing a slightly underrun lamp with a constant voltage transformer fed from the mains supply. The detector consists of a barrier-layer photoelectric cell which is coupled to a meter in series with a variable resistance. When the total external resistance in the cell circuit is sufficiently high the output current i is approximately represented by the relationship
i = constant X l o g i0I ( 5 )
Thus, combining E q s . ( 1 ) , ( 4 ) , and ( 5 )
i =
T
C» - « ( 6 )
where C is a constant and i0 is the cell current corresponding to zero smoke density. The meter may, therefore, b e engraved with a scale linear in smoke density.
The instrument is calibrated initially and checked subsequently by
66 C. L . CUTTING
means of neutral density filters inserted in the light beam, the required output of the photoelectric cell to give the desired meter reading being obtained by alternately adjusting the brightness of the lamp by means of the variable resistance VR1 and the resistance VR2 in series with the meter. Calibration normally extends over the range 0-0.5 optical
AC
VR3 200η
VR2 CALIBRATION ADJUSTMENT TO SUIT PHOTOELECTRIC CELL
( b )
F I G . 1 . S i m p l e smokemeter, ( a ) D e t e c t o r unit; ( b ) indicator unit circuit d i a g r a m .
density per foot, sufficient to measure the densities of most smokes encountered in fish-curing kilns.
In this instrument short-term fatigue of the photoelectric cell is effectively overcome by short-circuiting it for 5 to 10 min. while it is fully illuminated, by means of the switch shown in Fig. 1. Subsequent short-circuiting is normally not necessary, except to check the calibration or after the lamp has been extinguished. The effect of temperature drift on the cell characteristics is obviated by thermostatically controlling the temperature of the photocell compartment.
Obscuration of the ports defining the light path due to the deposition of smoke is prevented by heating the windows with an electric current passing through a transparent conducting layer of stannous oxide deposited on their surfaces.
The second instrument is a recording smokemeter (Jason, 1956) based on a variant of the double beam method. The schematic arrangement is shown in Fig. 2.
In this arrangement light which passes through the smoke is also absorbed by a narrow portion of an annular optical wedge which moves in front of an aperture. As the smoke density varies, the position
F I G . 2. S c h e m a t i c a r r a n g e m e n t of r e c o r d i n g smokemeter.
of the optical wedge is continuously adjusted automatically in such a manner as to maintain constant attenuation of light along the beam. This is achieved by comparing the intensity of the transmitted light with that which passes through a sealed-off reference column, using a split barrier- layer photoelectric cell. The potential difference between the two sections of the cell connected in opposition is fed into an amplifier controlling the speed and direction of rotation of a servo-motor. The servo-motor rotates the annular optical wedge in such a direction as to reduce the potential difference to zero and thus to maintain constant attenuation of light in the smoke path. The servo-motor is also coupled to a pen-arm which carries a stylus across a moving chart and thus provides a record of the smoke density. Since the optical density at any point along the annulus of the optical wedge is a linear function of the angular displacement of the radial line through the point, and the movement of the pen-arm is constructed to b e proportional to the rotation
00 Rear Front FIG. 3. Front and rear views of recording smokemeter.
ρ ο
of the optical wedge, the indication may be made to coincide with a printed scale on the chart.
Again the compartment containing the photoelectric cell is thermo
statically controlled and the end windows are electrically heated.
Figure 3 shows general views of the front and rear of the instrument, the measuring head being inserted through a hole in the side of the kiln.
B. T H E C H E M I S T R Y OF W O O D S M O K E
By Τ. H. Simpson, Torry Research Station, Aberdeen, Scotland The combination of combustion and destructive distillation which occurs when smoke is produced from smoldering wood results in a complex mixture of aliphatic and aromatic compounds in addition to water and carbon dioxide (the end products of complete combustion), and traces of hydrogen and carbon monoxide. The relative quantities of individual constituents of wood smoke are highly variable and are determined by the contributions m a d e by individual chemical reactions to the over-all process; these reactions are, in turn, controlled by the conditions of smoke production.
Pettet and L a n e (1940) effected a separation of smoke into various chemical groups, viz., aldehydes, ketones, acids, phenols, hydrocarbons, and tars, and showed that the composition was dependent on the air speed over the fire.
T A B L E I I I
A L I P H A T I C C O M P O U N D S P R O D U C E D B Y T H E P O L Y O S E S O F W O O D
Methanol F o r m a l d e h y d e A c e t o n e F o r m i c a c i d
E t h a n o l A c e t a l d e h y d e D i a c e t a l Acetic a c i d
Propanol P r o p i o n a l d e h y d e Propionic a c i d
A c r y l a l d e h y d e F u r f u r a l d e h y d e 5 - M e t h y l f u r f u r a l d e h y d e
Recently, at Torry Reseach Station, Simpson (1958) has been study
ing the chemistry of wood smoke and smoked fish, paying particular attention to the deposition of phenolic constituents. The evidence so far collected can be summarized as follows.
Wood consists of two main fractions, viz., polyoses (including pento
sans) which take the part of the "flesh" of the tree, and lignins, which supply the structure. "Soft woods," e.g., conifers, frequently contain, in addition, resin, which is essentially turpentine, a mixture of terpenes, with dissolved rosin, a mixture of hydrophenanthrene derivatives.
Under the conditions of smoke production, the polyose fraction undergoes degradation and yields the compounds listed in Table III.
B u g g e (1927) lists 69 aliphatic compounds isolated from the products
70 C. L . CUTTING
of distillation of nonresinous wood at room temperature, which probably also derive from the polyose portions of wood. Many of these compounds are almost certainly to b e found in wood smoke.
The structures of the lignins which comprise about one-third of the solid matter of wood have not yet been fully elucidated (Brauns, 1952;
Smith, 1956). It is, however, generally agreed that they may b e re
presented (see Fig. 4 ) as being formed from two main building stones, a guaiacyl propane ( I ) and a syringyl propane ( I I ) ; a third building stone, a p-hydroxyphenyl propane has been recognized in the lignins of grasses. The states of oxidation of the propane side chains and the natures
n I I e z :
OH
2VO.CH, CHp
OH j>H
V ^ V O C H , r ^ ^ ^ r O H HO OH
- c --c-
- c - - c -
F I G . 4. Production of phenols b y d e g r a d a t i o n of lignin.
of the linkages between one building stone and the next have yet to be established, though it seems likely that at least some of the side chains are condensed with the next units at position 6.
Under the conditions of smoke production, the lignins of wood are, in part at least, broken down, giving a complex mixture of phenols. E a c h individual phenolic compound may, however, b e considered as being formed from the building stones by relatively simple reactions, viz., reduction, partial or complete side chain elimination, hydrolytic cleavage, or combinations of these. Thus, among the phenolic constituents of wood smoke the following have been detected: guaiacol, its 4-methyl ethyl and propyl homologs and its 6-alkyl homologs, catechol ( I I I ) and its 4-methyl derivative, pyrogallol ( I V ) , its l-o-methyl and its l,3-o-o- dimethyl ethers and their homologs, hydroquinone (possibly formed by hydrolytic fission of the side chain) phenol and p-cresol. The major phenolic constituents are the guaiacol, 1,3-dimethylpyrogallol and cate
chol groups. These groups are present, though in greatly different relative concentrations in both the particle and in the vapor phases of wood smoke, the vapor being, as expected, much richer in volatile
phenols, e.g., guaiacol and its homologs, and poorer in less volatile compounds, e.g., pyrogallol, hydroquinone, and catechol, than the parti
cle phase. Foster and Simpson (1958) have used these observations to demonstrate the importance of the vapor phase in the smoking process, fish "smoked" in total smoke and in vapors alone showing identical phenol distribution patterns. Since small contributions from the particle phase were readily detectable, their conclusion that vapors are pre
eminently important to the smoking process seems to b e inescapable.
The British Empire Cancer Campaign (1941) reported that poly- cyclic aromatic compounds could not b e detected in wood smoke and that there was no evidence of wood smoke having carcinogenic activity.
It is now commonly believed that the pyrolysis of many organic natural products gives rise to traces of 3,4-benzpyrene and related compounds and it seemed likely that the use of the refined chromatographic tech
niques now available would establish the presence of microscopic traces of these compounds in wood smoke (Tilgner and Müller, 1957). How
ever, it seems likely that these compounds, if present, would tend to be concentrated in the particle phase and would not, therefore, b e absorbed by the fish (see, however, Dobes et al.9 1954).
The various roles which individual constituents play in the preser
vation and flavoring of smoked fish have not yet been fully elucidated.
Shewan (1945) has suggested that the color formation of smoked fish is related to the deposition and subsequent oxidation of phenols, the oxidation being, as is well known, accelerated under alkaline conditions.
Dauphinee (1925) has in fact suggested the addition of sodium bi
carbonate to brines, and Taylor (1930) has suggested the addition of ammonia to the smoke itself as a means of intensifying the natural coloration of smoked fish. Later workers (Linton and French, 1945) have concluded that, while the intensity of color is roughly proportional to the quantities of phenols deposited on the fish, phenols are not them
selves directly involved in color formation.
Wood smoke is known to be an effective antioxidant, providing useful protection against autoxidation to fatty fish and fish meal (Banks, 1952) and fish oils (Nikkilä and Linko, 1951). In a recent investigation Banks and Simpson (1958) separated smoke by countercurrent distribution and examined the fractions for activity in the model system, hematin catalyzed autoxidation of methyl linoleate in aqueous emulsions. In normal smoking, guaiacol and its homologs and to a lesser extent 1,3-a-o-dimethylpyrogallol, absorbed from the vapor phase, were found to account for the greater part of the antioxidant activity. "Electrostatic"
smoking imparted to fish a greater degree of protection than does normal smoking, the increase being found to b e due to the additional deposition
72 C. L . CUTTING
of the highly active antioxidants catechol, 4-methylcatechol and pyro- gallol l-o-methyl ether from the particle phase.
Formaldehyde, acids, and phenols are familiar preservatives and have long been regarded as being responsible for the biological stability of smoked fish. Opinion about the nature of the effective bactericides has, however, been divided, Hess (1929) believing formaldehyde and Metz- ner (1933) and Griffiths and Lemon (1934) considering the tar constituents to be the active agents. Shewan (1949) has tabulated material from various sources (principally McCulloch, 1936; Rao et al., 1932) which shows that wood tar phenols are the most active inhibitors of Eberthella typhi and Staphylococcus aureus, and Simpson (1958) has shown that the inhibition of a typical marine achromobacter is due principally to guaiacol and pyrogallol ethers and their homologs. How
ever, since fish has a bacterial population, initial and introduced in handling, that is variable and since the compounds which kill the greater part of the original flora may well be different from those which restrict the growth of smoke-resistant organisms it seems reasonable that the antiseptic compounds of smoke should only be defined in terms of the bacterial population and the nature of the smoked product.
Under present commercial conditions, adequacy of smoking is usually gauged by the color of the smoked fish, though this criterion is rendered less sensitive by the widespread use of dyes. Various analytical proce
dures have been tried in an attempt to find some reliable objective index of the extent of smoke deposition. Formaldehyde has been estimated in smoked fish by Griffiths and Lemon (1934), by Callow (1927), Linton and French (1945), and Shewan (1945). Since the last author has shown that unsmoked fish can give relatively high "blank" values, depending on its staleness, formaldehyde content cannot b e regarded as providing a reliable criterion of smoking. Volatile acids have been estimated by Linton and French (1945) but once again, high and irreproducible blank values are given by unsmoked fish. Acetone de
terminations have also been made by Linton and French, but they consider them to b e less reliable than phenol estimations. "Phenols" in smoked fish have been determined by Shewan (1945), Linton and French (1945) and Simpson (1958), aqueous extracts, steam distillates, or ethereal extracts being estimated colorimetrically with Gibbs's (1927) or Folin and Ciocalteu's (1927) reagents or with 4-aminoantipyrene (Gottlieb and Marsh, 1946). The results are usually expressed in terms of quantity per 100 g. of fish (calculated as phenol) or better, in terms of quantity (or optical density of color as measured by absorptiometer) per unit area of fish surface. Although these methods are accurate and sensitive, caution is necessary in using them as criteria of smoking. They
provide information about the deposition of a relatively small proportion of the total composition of wood smoke and should only b e used as a smoke index when it is known that the conditions of smoke production (and possibly the physical characteristics of the kiln) are the same.
One example of the need for care in interpreting the results of phenol determinations is provided by the observation that fish smoked in a traditional chimney kiln show approximately twice the phenol value for a given degree of smoky flavor ( a s assessed by a taste panel) as fish smoked in a mechanical kiln. When smoking conditions are the same, phenol determinations are useful; thus, Simpson and Storey (1958) have used them to show that the rate of deposition of smoke is roughly proportional to the optical density of the smoke, that the rate of deposition increases with increasing humidity and that predried fish absorbs smoke more slowly than wet fish. The use of two procedures, steam distillation and ether extraction, and two reagents, Folin and Ciocalteu's and 4-aminoantipyrene, and the measurement of phenol residues after steam distillation, provides determinations in different regions of the phenol distribution pattern and is useful in comparing different smoking procedures. It is, however, too time-consuming for routine purposes.
Phenol estimations by Shewan (1949) and Linton and French (1945) suggest that smoke constituents are concentrated in the surface pellicle, the phenol values falling from 60 mg. per 100 g. to as little as 2 mg. per 100 g. at the center of the fish. However, Jason (1958a) has shown by examination of the ultraviolet fluorescence, and Burgess (1958) by histochemical means, that diffusion from the surface to the flesh continues for several days after smoking.
C. FACTORS A F F E C T I N G T H E D R Y I N G OF F I S H DURING SMOKING
By A. C. Jason, Torry Research Station, Aberdeen, Scotland 1. Introduction
Drying is an essential, indissociable part of the smoking process. In most types of mildly smoked product the evaporation that occurs simultaneously with smoke deposition is mostly well within the range 5-25% of the initial weight, although traditional cures, such as red herring, are much more dehydrated and are combined usually with heavy salting; and some tropical smoked products undergo almost complete desiccation.
An experimental study of the drying of geometrically shaped pieces of fish in air is still in progress, but certain of the results of investigations so far reported (Jason, 1958b) are applicable to the evaporation of
74 C. L . CUTTING
moisture during the smoking process. The picture at present seems substantially as follows.
2. Constant-Rate Period
There is a succession of phases during the drying process which can be grouped into the constant-rate period, during which evaporation of so-called "free moisture" occurs from the surface, after which drying enters the falling-rate period. During the constant-rate period, the rate of evaporation depends on the air velocity, the partial pressures of water
lOOr
F I G. 5. Initial drying b e h a v i o r of c o d fillet p i e c e 10 X 5 X 1.5 c m . e x p o s e d to air stream of velocity 3 0 c m . / s e c . parallel to 1 0 cm. e d g e s . D r y - b u l b t e m p e r a t u r e 3 0 ° C ; w e t - b u l b t e m p e r a t u r e 1 8 ° C . C u r v e A : w e i g h t as a function of time; curve B : rate of drying as a function of time.
vapor at the surface (ps) and in the air (pa), the shape and surface area of the fish and the direction of the air stream. A careful and detailed study of the drying process has, however, revealed that the initial period in such nonoily fish as cod consists, not of a single constant-rate period, but of a succession of several short but distinct periods in each of which the gradient dW/dt of the curve of weight W plotted against time t is constant ( F i g . 5 ) . The existence of the separate periods is a consequence of differing local rates of evaporation resulting from geometrical effects.
Under practical conditions, however, the constant-rate period may be regarded as being one in which there is a uniform rate of evapora
tion. It is a sufficiently good approximation to state that this rate
of evaporation is proportional to the surface area A, to the wet-bulb depression θα — 0W ( F i g . 6 ) , and to the 0.77th power of the air velocity u.
This relationship is expressed in the equation dW
= 1.65 χ Ι Ο "8 Α (θα — ew)u0-™ ( 7 ) dt
where θα is the air temperature, θυ) is the wet bulb temperature, and all quantities are expressed in c.g.s. units.
3 5 0 p
F I G . 6. Effect of w e t - b u l b depression on rate of drying p e r unit a r e a of c o d fillet pieces e x p o s e d to air s t r e a m of velocity 3 6 6 c m . / s e c . at various d r y - b u l b t e m p e r a t u r e s . S y m b o l s : Ο 2 0 ° C ; X 2 5 ° C ; · 3 0 ° C ; + 4 0 ° C ; Δ 5 0 ° C ; Θ 6 0 ° C ; Θ 7 0 ° C ;
® 8 0 ° C ; Q 9 0 ° C ; V 1 0 0 ° C .
The duration of the constant-rate period tc is related to the rate of evaporation per unit area and to the effective diffusion constant D, the thickness 2c, the initial concentration C0 and equilibrium concentration Ce of water in the fish muscle, by the expression
D ( C0 — C , )
/j
1 dW dt
Dtr
+ Σ exp c2 ) ( 8 )
It will be observed that the rate of evaporation per unit area is independent of the air temperature and that the duration of the constant-
76 C. L . CUTTING
rate period depends upon the temperature only insofar as it affects the diffusion constant ( F i g . 7 ) .
For practical shapes of whole fish, split fish, or fish fillets, the duration of the constant-rate period may be roughly assessed by measuring the
F I G . 7. Relationship b e t w e e n duration of constant-rate p e r i o d a n d rate of evaporation p e r unit area at s u r f a c e t e m p e r a t u r e s θ8 of 0 ° , 5 0 ° , 1 0 0 ° C . for c o d m u s c l e slabs of half-thickness c = 0 . 1 , 0.2, 0.5, 1.0 cm.
thicknesses 2d at r equally spaced points in the plane of the sagittal section, finding the average value of the effective thickness 2ceff, thus,
ι ( ι " ι
V
Ceii l C2i J
\ i = 1 I ( 9 )
and substituting in equation ( 8 ) .
For nonfatty white fish fillets, a typical value of tc for an air tempera
ture of 3 0 ° C , a relative humidity of 50% and an air velocity of 1.5 m./sec. is 5 hr. In the case of fairly fat herrings split for kippering, the value of D is considerably less than that for white fish and leads to a
much lower value for tc; for example, under the above conditions tc might be as little as half an hour.
3. Falling-Rate Period
The termination of the constant-rate period is followed by a rapid decline in the drying rate which becomes negligibly small as the moisture content of the fish approaches an equilibrium corresponding to the particular relative humidity in the air. If, for the moment, the constant- rate period is considered to be very short in duration, it is possible to calculate the weight of a given piece of fish at any time. It may be shown that if the rate of flow of water at any point within the fish muscle is proportional to the product of the diffusion constant and the concen
tration gradient, then the form of the falling-rate curve is expressed by the equation
Wt — We I 8 γ ( 1 1 -)
w ^ T w T = (-*) Γ'/ τ + Τ e-9 t / T + I F e ~ 2 5 t / T+ } < 1 0 >
where Wt is the weight at any time t, W0 is the initial weight, We is the equilibrium weight and τ is the drying time-constant, which for a rectangular slab of dimensions 2a, 2b, 2c is,
τ = 4/π2Ό(α~2 + b~2 + c~2) (11)
where τ has the dimension of time.
For times greater than 0.2 τ, the use of only the first term in the series on the right-hand side of E q . 10 introduces an error of less than 2%, so that the expression for the unaccomplished change in weight becomes
Wt — We= (Wo —We) e-('-'c)/r (12)
A plot of In (Wt — We) against t will, therefore, give a straight line of slope l / τ for t ^ 0.2 τ.
In practice it is observed that the drying curve plotted in this way consists of two straight lines, the transition from one line to the other occurring at a moisture concentration of about 0.1 g. water per gram nonaqueous material ( F i g . 8 ) . There are, therefore, two drying time- constants τ ι and Tu associated with each of these phases of the falling- rate period and corresponding to two diffusion constants Dt and Dü, D i being several times as large as Dn in the range of temperatures normally obtaining. The transition between the two phases, which can be associated with the uncovering of the unimolecular layer of water covering the protein molecules, does not enter normally into most
78 C. L . CUTTING
smoking processes, which fall within the bounds of the constant-rate period and the first phase of the falling-rate period.
Air velocity and relative humidity have no influence on the rate of diffusion of water in fish muscle, and, therefore, on the rate of drying during the falling-rate period, except insofar as they affect the tempera
ture of the muscle. Relative humidity will, however, affect the equi
librium water content.
\rfl ι ι I I I ι 1
I U0 I O 2 0 30 4 0 50 6O 7 0 t ( h r )
F I G . 8. U n a c c o m p l i s h e d c h a n g e in w e i g h t of w a t e r r e m a i n i n g in c o d fillet p i e c e 1 0 X 5 X 0.6 cm. as function of time. D r y - b u l b t e m p e r a t u r e 3 5 ° C ; w e t - b u l b temperature 2 0 . 3 ° C ; air velocity 3 6 6 c m . / s e c .
Temperature has a considerable influence on the rate of drying because the diffusion coefficient depends on the thermal energy of the water molecules. The variation of both Όχ and Du with absolute temperature Τ is of the form
D = D0e x p (—E/RT) (13)
where D0 is a constant, Ε is the energy of activation for diffusion, and R is the gas constant. For cod muscle the value of D0 and Ε for the first phase are 0.54 cm.2/sec. and 7200 cal./mole, and for the second phase the corresponding values are approximately 0.7 cm.2/sec. and 8500 cal./
mole. The energies of activation differ significantly, but the D0 values do not.
Values of D i are approximately the same for all species of nonfatty fish; for fatty fish, the diffusion constant decreases with increasing fat content. Similar observations apply to D ü values, which are in general approximately one-fifth of the D i values irrespective of fat content.
Brining does not affect the initial drying characteristics appreciably, but the transition to the second phase of the falling-rate period occurs at a higher water content than in unbrined fish.
4. Practical Calculations
The calculation of the weight of a piece of fish at any given time is carried out in the following manner.
The total area, A, of the piece is first estimated (this will b e approximately twice the projected area for a fillet) and then the effective thickness 2Ceii is obtained as indicated in E q . 9. T h e rate of evaporation per unit area for the appropriate drying conditions is calculated from E q . 8, and this enables the duration of the constant-rate period to b e derived graphically from curves similar to those shown in Fig. 7. Thus the weight Wtß at the end of the falling-rate period and the
"unaccomplished weight loss," Wtß — We (i.e., the water which can still be removed) m a y b e obtained if We is known from water relations curves. Putting τ = 4CETT2/K2D, the weight Wt at any time during the falling-rate period is obtained from the expression
Wt — We=(Wtc-We) exp {—(t — t0)/x) ( 1 4 ) Equation 14 is a modified form of E q . 10 and applies when tc ^ 0.2 τ. If
t < < 0.2 τ E q . 10 applies, of course.
The following is a worked example for a cod fillet piece 10 X 5 X 1.46 cm. dried at 3 0 ° C . in an air stream of velocity 150 cm./sec. and wet bulb depression 1 2 ° C . Initial weight of piece = 73.1 g.; equilibrium weight
= 14.4 g.
During the constant-rate period 1 dW
— -τ- = 1.65 χ Ι Ο -8 (θα—θκ) X 3600 A dt
= 33.6 χ 1 0 -3 g./hr.
.'. tc = 3 . 6 hr. (experimental value 3.5 hr.) dW
= 33.6 X 1 0 -3 χ 144 dt
= 4.84 g./hr. (experimental value 4.7 g./hr.) Now (Wtc — We) = (73.1 — 3 . 6 X 4 . 8 4 ) — 1 4 . 4
= 41.3 g.
and τ = 15.9 hr. (experimental value 16.9 hr.)
80 C. L . CUTTING
so that at the values of t — tc given in the tabulation below, Wt may be calculated and compared with observed values.
( h r . )
C a l c u l a t e d
weight, Wt
( g . )
O b s e r v e d
weight, Wt
( g . )
0 55.7 57.6
2 5 0 . 9 5 1 . 8
4 4 6 . 1 4 6 . 2
6 4 2 . 8 4 2 . 3
8 39.4 3 9 . 4
10 3 6 . 4 3 6 . 7
1 5 3 0 . 5 3 0 . 2
2 0 2 6 . 1 2 6 . 4
2 5 2 3 . 0 2 3 . 4
3 0 2 0 . 7 2 1 . 1
III. Practical Aspects
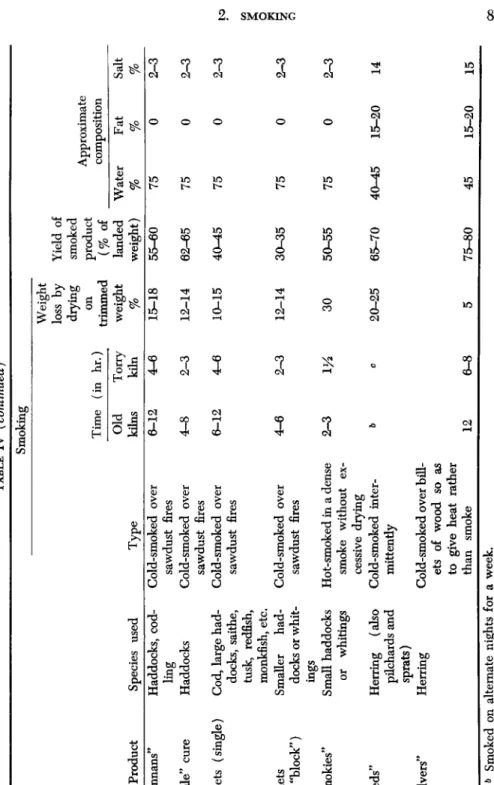
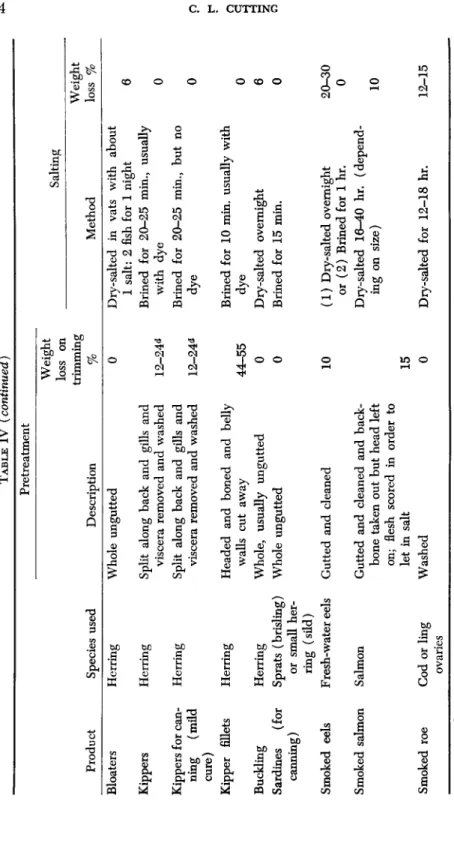
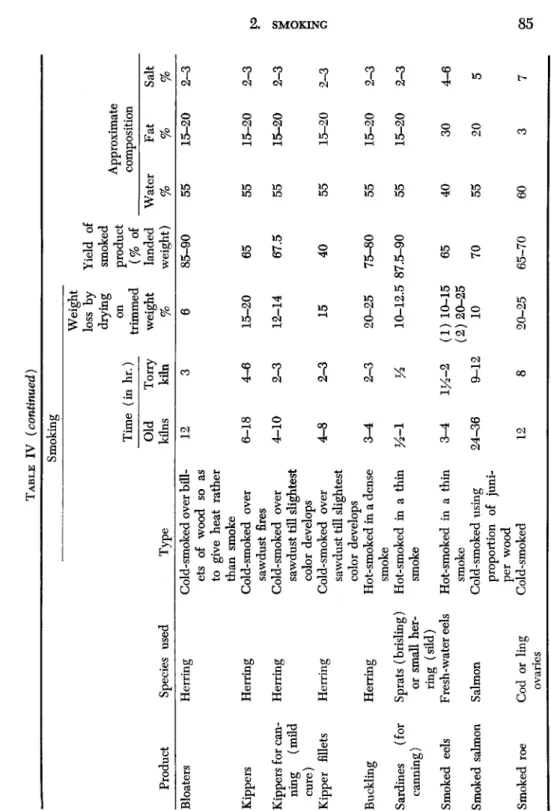
A. T Y P E S OF PRODUCT
The degrees of salting, smoking, and drying, combined with the pre- treatment, trimming, cleaning, etc., which characterize various classes of smoked fish, all influence in various measure the keeping quality of the products. The main features of the principal types of smoked fish current in Britain are listed in Table IV (Cutting, 1951). Smoked products vary greatly from country to country according to the types of fish available, climatic conditions, etc. Even in a single country or district local preferences differ, and the origin of many British cured products was very localized, as evidenced by the Newcastle kippered herring, Yarmouth bloater, and "Eyemouths," "Moray Firths," and "Fin
nans" for increasing intensity of cure of haddocks, Arbroath "smokies,"
etc. It would b e an impossible task to catalog all the types of smoked products m a d e throughout the world. Therefore, the main features of the processes involved in making the products eaten in Britain, which are largely representative of those of western Europe and North America, will first be described as illustrative of the principal procedures that can be adopted, although every particular species of fish will, of course, present its own individual peculiarities. Thus, on the Pacific coast of the United States such fish as sablefish (or black cod) and in the South Atlantic and Gulf coast mullet, kingfish, and Spanish mackerel are treated in essentially the same way as Europe treats cod and herring, while, to European tastes, more exotic products such as smoked shrimps, clams, and oysters also appear, according to local supplies and tastes (Jarvis, 1944, 1950). Furthermore, various attempts have been made to adapt these processes to warm climates (e.g., Jarvis, 1932, 1933) and