Introduction
Agriculture is one of the most dominant European land-use sectors, accounting for approximately half of the European Union (EU-28) area (EC, 2015; Schmidt, 2019).
The European Environmental Agency (EEA) explains that the sector not only contributes to, but is also influenced by, climate change (EEA, 2020). The complexity of the sec- tor has resulted in overemphasis during the past decade on mitigation as compared to adaptation (Garnett et al., 2013;
Ignaciuk and Croz, 2019; Moore et al., 2017). Despite these controversies, the sector holds high potential for adaptation to climate change. At the EU level, the necessity for the accelerated sectoral adaptation to climate change is evident from the prioritisation of adaptation to the level of an objec- tive in the new CAP (EEA, 2020; Lankoski et al., 2018).
The European Commission (EC) acknowledges that sus- tainable food production, coupled with climate change, calls for a multi-stakeholder approach in order to ensure that farm- ers build strong adaptive capacity (a climate-proof future) to withstand the rapidly changing environmental conditions.
The sector’s adaptation to climate change has the potential to build strong resilience while increasing its competitiveness in food production and environmental conservation terms at both a regional and a global level (EEA, 2020).
In the pursuit of a climate-proof future, the EU, through the CAP, has established itself as a global leader in manag- ing the effects of climate change. The EU has been in the front line, globally championing the best way to handle the uncertainties while making the agricultural sector and the rural areas adopt Green Growth. The EU Green Deal as a growth strategy is geared towards making the EU to be the
first climate-neutral continent by 2050 (EC, 2019b). Green Growth in the agricultural sector is a product of the low carbon sector. Aiming for carbon neutrality is a mitigation strategy in the short term, but adopting and implementing the practices in the long run transpires to be adaptation (Attri and Rathore, 2010; Ignaciuk and Croz, 2019).
Currently, joint efforts towards zero emissions by 2050 across all member states are gaining high importance (EEA, 2020; Garnett et al., 2013). European agriculture contributes approximately 10% of total EU greenhouse gas (GHG) emis- sions (Bellocchi et al., 2017). The Macsur Knowledge hub recently concluded that the greatest challenge is not mitigat- ing the emissions but determining the possible ways through which farmers can survive the net-zero emissions (Roggero, 2018). Although there exists great information on adapta- tion, execution and implementation remain the greatest chal- lenges for farmers.
The European agricultural sector development is highly driven by multiple factors that are characterised by regional variation, thereby doubling its complexity (EEA, 2020). To establish a sustainable sector characterised with high adap- tive capacity and strong resilience to climate change, its pre- requisite is to ensure smooth integration of societal values and economic objectives (Lipper et al., 2018).
The European agricultural sector vulnerability to climate change offers two different opposing scenarios based on geo- graphical location and the attributable seasonal changes. The European Commission points out that production patterns are expected to alter due to climate change (EEA, 2020).
They see the emergence of new diseases, and the occur- rence of unprecedented catastrophic events as factors signifi- cantly contributing to these changes. The occurrence of such events will heavily influence farmers’ income across the EU depending on their geographical location, in turn influencing Kennedy MUTUA NDUE*1 and Pál GODA*2
Multidimensional assessment of European agricultural sector adaptation to climate change
The agricultural sector and how it relates to climate change is today emerging as a central subject of debate and critique, because it is heavily impacted by, and at the same time, a primary contributor to, climate change. The intertwined, complex relationship between the sector and climate change is among the unprecedented challenges now facing the European Union (EU). The complexity of the relationship calls for the establishment of a sustainable, future climate-proof, adapted and resilient sector with strong adaptive capacity. This paper argues that over the past decades, strong emphasis has been placed on how to mitigate the negative effects of climate change across the sector, causing it to fall behind in terms of adaptation. Although adaptation is now part of the sector’s development agenda, sectoral adaptation performance across member states remains low. In order to justify an accelerated adaptation process across the sector, the paper develops a Relative Climate Change Adaption Index (RCCAI) for the sector based on Eurostat data. The analysis shows that there is no single member state across the EU whose agricultural sector can be considered as fully climate-adapted (resilient), and thus validates the hypothesis that adaption efforts must be stepped up across the sector. To ensure continued sectoral adaptive capacity improvement, the paper recommends coherent integration and accelerated implementation of adaptation practices and policies alongside the Common Agricultural Policy (CAP) for the sake of both private and public interests.
Keywords: Climate change, adaptation, Relative Climate Change Adaptation Index, climate-proof agriculture, climate-adapted agriculture
JEL classification: Q15
* Institute of Agricultural Economics, Zsil utca 3-5, 1093 Budapest, Hungary. Corresponding author: kennedy.mutua@aki.gov.hu Received: 10 November 2020, Revised: 1 February 2021, Accepted: 4 February 2021.
1 https://orcid.org/0000-0003-0406-9606
2 https://orcid.org/0000-0002-1900-2175
farm income distribution. The implication of such changes can result in increased food insecurity or increased commod- ity production due to production zone migration, causing market price distortion.
Leveraging adaptation approaches to match mitigation efforts is essential (Long et al., 2016; Nelson and Stroink, 2014). These studies explain how most of the adaptation measures and strategies in place employ “mainstreaming”
adaptation approaches, which they criticise as problematic since they fail to address what can be adapted to by farmers. In their opinion, the adaptation process should be an integral part of societal development and not treated as a separate entity.
As they see it, integrating adaptation to climate change into people’s ordinary way of living should mean that the sector implements adaptation as a necessary part of its development and not as a driving force for fighting against climate per se.
This problem with mainstreaming adaptation can be addressed by shifting towards transformative adaptive meas- ures (Fedele et al., 2019). These scholars have outlined that transformative adaptation goes beyond understanding the impacts of climate change on the sector to the extent of devel- oping site-specific real-time adaptation techniques. Upholding the importance of private goods or farm values in adaptation further differentiates the two approaches (Chambwera et al., 2015; Pelling et al., 2015). The establishment of strong knowledge hubs has the potential to increase the sectoral adaptive capacity (Perez Perdomo et al., 2010). Establishing a multi-actor approach leads to knowledge cross-fertilisation and eventually a one stop-shop for solving farmers’ problems (Edward et al., 2019; Karlsson et al., 2018; Mitter et al., 2020;
Reidsma, 2007).
The existence of insufficient investment in research and development in the European agricultural sector, coupled with weak Agricultural Knowledge and Information Systems (AKIS), contributed to slow sectoral growth (8%) as com- pared to over 11% in the previous decade (Klerkx et al., 2019).
According to Goda and Kis (2017) and Pardey et al. (2013), there may exist an inverse relationship between countries’
development curve and investment in agricultural research, with highly developed economies being more likely to invest less in agricultural research and development, a situation that is attributable to a congruence effect.
Establishing a healthy co-existence between both the vertical and horizontal actors across the agricultural sector in the implementation of adaptation measures is a plausible pathway to setting up a food system that is resilient to climate change. Diversification of policy stakeholders compounds the complexity that arises due to the implementation of conflict- ing decisions; this necessitates the adoption of transformative policy change (Goldenberg and Meter, 2019; Jpi et al., 2016).
Determinant factors for the agricultural sector adaptation to climate change
The future of European agriculture, coupled with climate change, represents one of the most debatable scenarios and issues to be addressed (Bozzola et al., 2018; Reidsma, 2007).
Temperature and rainfall variations are some of the evidence that has been held accountable for changes in agricultural zones across Europe (Ciscar et al., 2019). Continuous tem- perature changes are projected to have a negative effect on Southern Europe, as opposed to Northern Europe agri-zones, where extension to growing seasons is predicted to occur (Ciscar et al., 2019). Although temperature and precipita- tion contribute significantly, local weather conditions play a deterministic role in these changes (Bozzola et al., 2018;
Dixon et al., 2015).
The pursuit of a climate-resilient agricultural sector is highly driven by multiple factors that are less costly if initi- ated and implemented now than in the future when defining sustainable food systems (Chaudhary et al., 2018). An ideal scenario conducive to sustaining adaptation is more likely to come into existence through an identification of the trade-offs between the desired practices that ensures a win-win inter- action (Lankoski et al., 2018; Shrestha and Dhakal, 2019).
In such a trade-off identification, irrespective of whether the complex systems are autonomous or semi-autonomous, the aim should be to establish a climate resilient sector (Holz- kämper, 2017; Olde, 2017; Sacchelli et al., 2017).
Agricultural water management
Water is a core issue in adaptation to climate change in the agricultural sector (OECD, 2014). There exists a com- plex interaction between water, climate change and agricul- ture, one that calls for a critical approach. Climate change- related risks are projected to intensify in those regions perceived as water scarce (Iglesias and Garrote, 2015). The OECD highlights the reduction in water availability through precipitation, the interference with the water quality through surface runoff, river flows, accumulation of nutrients and the occurrence of extreme disasters such as droughts as some of the eminent potential effects of climate change on agri- culture and water (OECD, 2014). The associated impacts of the water resource change due to climate change varies across the sector causing destabilisation of markets, trigger- ing food insecurity and imposing strain on non-agricultural water uses (Sordo-Ward et al., 2019). Climate change has the potential to interfere not only with the availability of water but also with specific water requirements which vary from crop to crop, season to season and even farm to farm (Falloon and Betts, 2010; Mateo-Sagasta and Jacob, 2011).
To protect against such negative effects, the European Com- mission advocates sound water management as being of decisive importance to the future of the agricultural sector (Kahil et al., 2015). They propose adoption of increased effi- cient water use and effective land use practices in line with the Water Directive Framework (WFD) to increase sectoral adaptive capacity while continuing to maintain “good” water status (EC, 2008).
Compared to other sectors, European agriculture has huge potential to ensure sustainable water management.
The sector, if well maintained, can improve the soil’s water holding capacity and reduce the high levels of consumption of natural waters. The sector is responsible for 22.5% of water abstraction and 60% of freshwater abstraction, facts which make sustainability of water abstraction imperative.
To ensure the sustainability of this scarce resource, the EU has put in place instrumental policies that have highly sup- ported the initiative. The Nitrate Directive (EC, 2020c) has had a measurable effect on water quality through the reduc- tion of pollution. Moreover, the Sustainable Use of Pesti- cides Directive has recently served as an important instru- ment contributing towards the achievement of “good” water status (EC, 2009a, 2009b).
Agricultural biodiversity management
The use and application of agricultural biodiversity have been applauded as a plausible concept for climate smart agriculture (Abrams et al., 2017; Dabkienė, 2016; Lipper et al., 2018; Shortle and Uetake, 2015). According to this view, agricultural biodiversity can be perceived as an approach aimed at reorienting the way sectoral biodiversity is concep- tualised, starting out from the genetic, species and ecosystem levels. Adoption of sectoral biodiversity has the capacity to transform both inter and intra-diversity at the farm level, leading to increased production, resilience and adaptation to climate change (Jones and Silcock, 2008; Lankoski, 2016).
The outcome of such diversification, besides resilience and an increased adaptive capacity of the sector to climate change, is food security due to reduced deterioration of soil quality, reduced prevalence of pests and diseases and improvement of the farm wellbeing in general (Lin, 2011;
Taguas et al., 2015).
Across the EU agricultural sector, the importance of farm diversity is emphasised by the biodiversity strategy (Euro- pean Commission, 2020) as an element essential to bringing back nature to the sector. The strategy outlines the measures that can be followed to ensure nature coexists with farm practices sustainably. In compliance with the Kyiv Resolu- tion on Biodiversity, all EU member states agreed to identify all high nature value areas and have favourable management of substantial portions of them in order to conserve the envi- ronment (Paracchini et al., 2008). Preservation of high nature value areas can potentially serve as biofilters and bioreme- diations, thereby improving the quality of soil, water, and air so as to create an enabling environment for agriculture.
One objective of the EU Biodiversity Strategy-2030 is to increase the contribution of the agricultural sector in the reduction of biodiversity loss. Under the CAP, the EU intro- duced ‘‘greening’’ measures to improve biodiversity within conventional agriculture and support traditional knowledge and practices in rural areas. The EEA pointed out the declin- ing biodiversity trend across Europe that necessitated the development of the Biodiversity Strategy 2030 for post-2020 biodiversity control. The Biodiversity Strategy 2030 aims to put Europe’s biodiversity on the path to recovery to ensure it is people-oriented, climate-, and planet-friendly (EC, 2020b;
Garnett Tara, 2013).
Agricultural environmental management
The agricultural sector and the environment are insepa- rable entities characterised by a complex relationship. To reduce the complexity and promote coexistence, prioritising sound environmental management is crucial (Eichler et al.,
2018; OECD, 2017; Reidsma, 2007). One possible cause of the sectoral environmental degradation is waste genera- tion. Agricultural waste and by-products across Europe are responsible for almost half of the total solid waste equiva- lent to 700 Mt annually (Pawełczyk, 2005). This implies that the agricultural sector is responsible for wastes other than food that need to be accounted for if one is to regulate envi- ronmental degradation. Over 88 million tonnes of food is wasted across the EU and is expected to go up to 120 million tonnes (Caldeira et al., 2017; EC, 2018c).
Biodegradable waste, where agricultural waste lies, has been responsible for approximately 3% of methane emis- sions. Reducing agricultural waste and the promotion of more efficient agricultural systems through conversion of the waste into inputs for energy production is a plausible sectoral adaptation pathway that simultaneously imple- ments the 1999 Landfill Directive that required member states to reduce their biodegradable waste by 35% by 2020 (EC, 2018a).
Agricultural soil management
A future involving healthy soils in Europe calls for bet- ter management of peatlands and wetlands, a goal that can be achieved by ensuring that Good Agricultural and Envi- ronmental Conditions (GAECs) are practised (EEA, 2020;
Hatfield et al., 2018; Thaler et al., 2012). Under the GAECs, farmers are required to use the Farm Sustainability Tool (FaST) for developing their nutrient management plans (EC, 2019a). GAECS are linked to direct income. To promote vol- untary health soil management practices, the CAP under the
“eco-schemes” incentivises local practices directed towards managing healthy soils like agroforestry, organic farming, afforestation, and agroecology (EC, 2020b). In practice, advances in technology are setting the direction for soil health in the future; hence, due to precision farming, increas- ingly the right amount of nutrients and pesticides are being applied (Delgado et al., 2019; EC, 2019b).
Agricultural energy management
One of the objectives set by the EU under the Green Deal is renewable energy. The agricultural sector has great potential to achieve these objectives. Despite the potential farms possesses, the sector still faces technological, social and economic barriers to transitioning to renewable energy (EIP-Agri, 2019). Some of the challenges can be overcome by the sector adopting energy efficient farm practices geared towards adapting to climate change (Troost, 2014). Moves towards greater agricultural energy efficiency have been highly driven by the desire for the sector to achieve the EU’s clean energy transition objective by 2030 (Warren, 2019).
The EU aims to ensure that Europe not only transitions towards green energy but in addition, adapts it. Achieving energy efficiency across the sector has been defined as a challenge faced by the sector. This is due to the nature of food production, as a function of perishable and non-perisha- ble products with different energy demands along the value- chain. To address such a challenge, ensuring efficient energy utilisation across the sector has become crucial. Although
more than two thirds of the renewable energy produced in Europe is derived from biomass, with the sector contributing immensely to production of the raw materials, the greatest obstacle is the paucity of hard data on biomass extraction coupled with the limitations placed on extractable biomass in order to avoid depletion of Soil Organic Carbon (SOC) (Henderson, 2011).
The European Commission describes the current agri- food chain as highly energy-dependent, highly reliant on fossil fuels and in need of a sustainable system of energy use (Monforti et al., 2015). Increasing its share of bio- energy has the potential to reduce the impacts of climate change. The EU agricultural sector’s energy consumption as a proportion of total energy consumption is estimated at 17 per cent, with over 70 percent of it occurring beyond the farm gate. Coupled with the amount of food wasted, the amount of energy used to produce the wasted food is also accounted for in the figure for the sector (Diakosavvas, 2017). This calls for increased circular production within the sector in order for the value-chain to have zero energy leakage.
Research and development, information, knowledge, and skills management
Although a great number of steps have been initiated across all member states to strengthen their research capacity and build resilience towards emerging and future challenges, the majority of these measures are being implemented at a national level, resulting in a fragmented system. System fragmentation can lead to impaired knowledge sharing and information exchange between farmers and relevant stake- holders (EIP-Agri, 2018). Moreover, the existence of frag- mented knowledge and information systems has created a space for innovation brokers who are most likely to exploit farmers (Klerkx et al., 2009; Malinovskyte et al., 2014;
The European Network for Rural Development, 2013). The involvement and participation of farmers in the research process has been criticised for its partial inclusion criteria (EIP-Agri, 2018). Establishing a strong, well connected and aligned agricultural research system with farmers at the cen- tre requires high capital investment (Catalano et al., 2020).
To counter the climate change-related risks and threats to sector-wide knowledge dissemination and skills develop- ment, the European Commission is advocating for efforts to be intensified, involving the public, the corporate sector and individuals to scale-up research and development. All these efforts are geared towards increasing the sectoral adaptive capacity to climate change (The European Network for Rural Development, 2013).
Agricultural economic management
Performing cost-benefit analysis is essential to determin- ing the economic efficiency of any desired practice (Bruin, 2011; Dixon et al., 2015). Although desired practices vary from place to place based on endowments and resources, future benefits must outweigh the planning costs. Farmers tend to select those practices where they can pre-formulate the anticipated outcomes. Increasing farm efficiency in adap-
tation to climate change has the potential to increase farm output and reduce adaptation barriers (Kurukulasuriya and Rosenthal, 2003; Reinsborough, 2003).
The European Environmental Agency projects that a lack of escalated adaptation to climate change in the agricultural sector would result in a 16% loss of farm income by 2050.
To preserve the economic value of these farms, enhancing social-economic aspects that will improve a farm’s income while at the same time reducing negative impacts on the environment becomes essential (Attri and Rathore, 2010;
EC, 2019b; Ignaciuk and Croz, 2019; Peyriere and Acosta, 2019).
Agricultural social integration
Behavioural change is an effective tool for bottom-up decision-making with a view to increasing society’s adaptive capacity (Niamir et al., 2020). The Drawdown Methodology formulates that reorienting societies’ approach towards climate change from the larger community perspective to individual responsibility constitutes part of behavioural change (Wil- liamson et al., 2018). The Climate-ADAPT partnership high- lights the importance of economic incentives for behavioural change as an important tool in policy-shaping in relation to climate change adaptation and mitigation measures and notes how they can spur accelerated behavioural change (Climate- ADAPT, 2019). Most adaptation incentives and disincentives originate from the government. Overreliance on government support can also be viewed as an obstacle limiting farmers from active involvement in eradicating social issues affecting climate change adaptation (Van Valkengoed and Steg, 2019).
Establishing a strong community with the desire to change the ways farmers operate and to create a collaborative approach towards solving climate-related problems could help reduce overreliance on government support.
Methodology
Composite indices are an outcome of a long and elaborate sequential process involving steps that have to be followed keenly (Greco et al., 2019; Hickel, 2020; Saisana, 2008). The authors of this paper, in keeping with composite index devel- opment principles, developed a stepwise approach towards creating an agricultural sector Relative Climate Change Adaptation Index (RCCAI). The methodological process was based on the conceptual framework (Table 1) below, involving a series of steps. After establishing the concept, data manipulation involved empirical application of statisti- cal steps such as data selection, aggregation, normalisation, and visualisation. The conceptual framework was developed as a tool for indicator development and determinants devel- opment following the literature review. A similar approach was applied by Acosta et al. (2020) in formulating indicators for natural capital. The desirability of the chosen indicators was determined by the reviewed literature as presented in the determinants of adaptation section. According to Greco et al. (2019), the subjectivity of indicators formulation is one of its strengths when it is supported with well documented evidence (OECD, 2008).
The data for all the indicators was gathered from the Eurostat. Although questions may arise concerning the consistency and the robustness of their data, Acosta et al.
(2020) and Peyriere and Acosta (2019) propose the engage- ment of stakeholders in the process in order to evaluate their key interests; this can play a significant role in weighting the indices. Stakeholder engagement was not part of this paper, a fact necessitating further research to validate the indices and updating of the subjective indicators. To ensure coherence and completeness of data from the indicators, simple imputation involving the omission of incomplete data was selected in preference to extrapolation and mean imputation due to the likelihood of the latter approaches involving implausible assumptions (Zhu et al., 2012). The latter authors outlined the challenges of mean imputation in relation to the way it reduces variance thus changing the corelation between indicators.
Index formulation
When working with multidimensional indicators with different units and dimensions, its essential subject the data under normalization process (Pollesch and Dale, 2016). Nor- malisation in composite index development helps in indica- tor transformation into uniform scale and unitless numbers for easy comparison (OECD, 2008). The min-max normali- sation method(rescaling method) as outlined by (Mazziotta and Pareto, 2013) was applied to align indicators with both positive and negative relationship to the index thus reducing the effect of extreme values on the index. Rescaling was cho- sen for its simplicity in application and the ability to elimi- nate extreme values therefore removing outliers partially.
The min-max transformation method rescales the dif- ferent indicators (Xi) into an identical range (0-1) based on minimum (Xmin) and maximum (Xmax) as presented in Equation 1 below.
Table 1: Theoretical conceptual framework.
Indicators Aggregate indicators Determinants Index
Irrigated utilised agricultural area as a
percentage of total utilised agricultural area Agricultural irrigation
compliance Agricultural Water
Management
Relative Climate Change Adaptation
Index (RCCAI) Irrigable utilised agricultural area as a
percentage of total utilised agricultural area
The agricultural area protected for Biodiversity The agricultural area protected for Biodiversity
Agricultural Biodiversity Management
Common Farmland Bird index Common Farmland
Bird index Agricultural area fully converted to
Organic farming Organic farming adoption
Agricultural area under conversion to Organic farming
Agricultural pollution tax (euro per ha) Agricultural environmental awareness
Agricultural Environmental Management Total agricultural tax (euro per ha)
Agricultural waste generation (Kg/capita) Agricultural waste generation (Kg/capita) High input farms as a percentage of
utilisable agricultural area Soil input dependency
Agricultural soil management Low input farms as a percentage of
utilisable agricultural area
Agricultural lands under severe soil erosion Soil erosion risk Agricultural lands under moderate soil erosion
Soil nitrogen gross nutrient balance Soil nitrogen gross nutrient balance
Biomass extraction per capita Renewable energy
capacity Agricultural energy
management Agricultural energy supply per hectare Agricultural energy
sustainability Agricultural energy use per hectare
Agricultural Human Resource Employment in Science and Technology (HRST)
Research and Development, information, skills, and knowledge
management
Agricultural Information, Knowledge and Skills,
management Research and Development expenditure as a
percentage of GDP
Research and Development personnel as a percentage of the active population Agricultural availability of labour
National Farm income (Standard output) Agricultural economic
efficiency Agricultural Economic
Management Annual work unit (Total hours worked
in the farm
Youth Agricultural farm income (SO/ha) Agricultural Future
attractiveness Agricultural Social Integration National agricultural farm income (SO/ha)
Waste recycling Waste recycling
Source: own composition based on Eurostat (2020) data
(1)
Where:
Xi Normalised: Normalised ith indicator
Xi: The value of the aspect/indicator under study
Xmin: The minimum value of the aspect under observation Xmax: The maximum value of the aspect under observation
Post normalisation, differentiation between indicators was based on the literature review because of their subjectiv- ity to determine their nature. To differentiate the indicators,
Xi Normalised was expressed in two forms as presented in the
two equations 2 and 3 below. Equation 2 was applied to the indicators that were considered optimal when their index is high while equation 3 was subjected the indicators that were defined as optimal when their index is optimal when low.
(2)
(3)
Where:
: The j sub-index of Dimension i
: Member states value in Dimension i in aspect j
: Minimum value of aspect j in Dimension i across member states
: Maximum value of aspect j in Dimension i across member states
The determinants’ indices (Di) were calculated by aggre- gating the arithmetic mean of the relative sub-indices of the aspects/indicators characterising the determinants as shown in equation 4 below:
(4)
Where:
: The determinant index of a member state in Dimension i : Sum of sub-indices of Dimension i
n: Number of sub-indices in Dimension i
The RCCAI was calculated as a composite of the different determinant indices using equation 5 below:
(5) Where:
RCCAI: The Relative Climate Change Adaptation Index n: Number of determinants indices of the all the dimensions.
To classify the member states the arithmetic mean, the upper and lower medians’ values of the RCCAI were used as shown below. These constituted the upper and lower limits of the index.
(6)
Where:
XRCCAI: The average of all the (n) member states RCCAI RCCAIa,...,n: Member states RCCAI
(7)
(8)
Where:
MedupperRCCAI: Median of the RCCAI values greater than
the XRCCAI
MedlowerRCCAI: Median of the RCCAI values less than the
XRCCAI
All the member states RCCAI values were classified based equation 7 and 8 resulting into four groups which a member state sector could be considered to exist in as shown below:
If RCCAI > MedupperRCCAI: High potential for adaptation If RCCAI > XRCCAI < MedupperRCCAI: Potential for adapta- tionIf RCCAI < XRCCAI > MedlowerRCCAI: Risky to climate change
If RCCAI < MedlowerRCCAI: High risky to climate change
Results and discussion
This section presents the outcomes of the different aggre- gation of member states’ performance in different aspects that together form the key factors for adapting to climate change in agriculture, as presented above. When dealing with com- posite indices, their multidimensional nature results in a high level of subjectivity depending on how they are perceived and defined. To justify the need for accelerated adaptation efforts across the EU agricultural sector, this section presents the results for the member states’ performance in terms of sectoral adaptation.
Agricultural water management
The irrigation compliance index shows how the differ- ent member states’ agricultural sectors are exploiting their irrigation potential to compensate for variations in their crop or livestock water requirements. In terms of irrigation com- pliance, Malta (1.0), Portugal (0.94), Greece (0.84), Bulgaria (0.82), and Italy (0.7) have the highest share of irrigable lands under irrigation compliance (Table 1 and Table 2). This can be attributed to the increased prevalence of droughts in the Southern Europe regions (Falloon and Betts, 2010; Trnka et al., 2012). Most the member states’ agricultural sectors have complied with irrigation to counteract the negative effect of
water scarcity. Even though the need for irrigation is present in all member states, there are over 9 member states whose agricultural sectors’ irrigation compliance is still very low.
The index was lowest in Finland (0.00), the Netherlands (0.23), Sweden (0.27), Belgium (0.31) United Kingdom (0.32), Austria (0.37), Poland (0.48), and France which had 0.49. For the Nordic countries, it can be concluded that the low indices are due to increased precipitation or increased thawing of frozen waters due to increasing temperatures and longevity of seasons (Ray et al., 2019). Increasing the area under irrigation is a plausible pathway towards adaptation to climate change. However, the increase must be guided by the desire for highly water-efficient irrigation systems, technolo- gies and practices to ensure that water quality and quantity are not affected. Research has predicted that the European agricultural sector will continue to experience water demand
competition from increased biomass and energy produc- tion; thus there is a need to ensure high efficiency in uti- lisation and management of the available resource (IIASA, 2014). Coupled with advances in technology, increasing efficiency – so as to ensure any irrigation technique aimed at having a less negative effect on both soil quality and quantity while increasing the conditionality of eco-schemes across the European agriculture – holds huge potential for ensuring good water irrigation practices (Kahil et al., 2015).
However, these practices on their own are not sufficient to ensure sustainable water management, as outlined under the sustainable use directive. Implementation of sound water management practices under cross-compliance and condi- tionality for smart techniques for agricultural water use is therefore a plausible pathway for the sector’s adaptation to climate change’s effects on water.
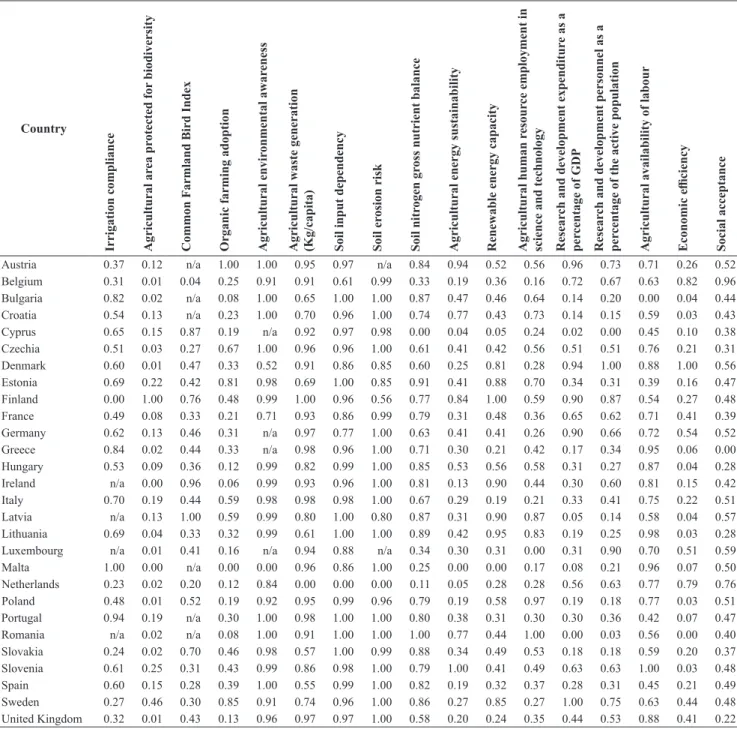
Table 2: European agricultural relative climate change adaptation aspects sub-indices.
Country
Irrigation compliance Agricultural area protected for biodiversity Common Farmland Bird Index Organic farming adoption Agricultural environmental awareness Agricultural waste generation (Kg/capita) Soil input dependency Soil erosion risk Soil nitrogen gross nutrient balance Agricultural energy sustainability Renewable energy capacity Agricultural human resource employment in science and technology Research and development expenditure as a percentage of GDP Research and development personnel as a percentage of the active population Agricultural availability of labour Economic efficiency Social acceptance
Austria 0.37 0.12 n/a 1.00 1.00 0.95 0.97 n/a 0.84 0.94 0.52 0.56 0.96 0.73 0.71 0.26 0.52
Belgium 0.31 0.01 0.04 0.25 0.91 0.91 0.61 0.99 0.33 0.19 0.36 0.16 0.72 0.67 0.63 0.82 0.96
Bulgaria 0.82 0.02 n/a 0.08 1.00 0.65 1.00 1.00 0.87 0.47 0.46 0.64 0.14 0.20 0.00 0.04 0.44
Croatia 0.54 0.13 n/a 0.23 1.00 0.70 0.96 1.00 0.74 0.77 0.43 0.73 0.14 0.15 0.59 0.03 0.43
Cyprus 0.65 0.15 0.87 0.19 n/a 0.92 0.97 0.98 0.00 0.04 0.05 0.24 0.02 0.00 0.45 0.10 0.38
Czechia 0.51 0.03 0.27 0.67 1.00 0.96 0.96 1.00 0.61 0.41 0.42 0.56 0.51 0.51 0.76 0.21 0.31
Denmark 0.60 0.01 0.47 0.33 0.52 0.91 0.86 0.85 0.60 0.25 0.81 0.28 0.94 1.00 0.88 1.00 0.56
Estonia 0.69 0.22 0.42 0.81 0.98 0.69 1.00 0.85 0.91 0.41 0.88 0.70 0.34 0.31 0.39 0.16 0.47
Finland 0.00 1.00 0.76 0.48 0.99 1.00 0.96 0.56 0.77 0.84 1.00 0.59 0.90 0.87 0.54 0.27 0.48
France 0.49 0.08 0.33 0.21 0.71 0.93 0.86 0.99 0.79 0.31 0.48 0.36 0.65 0.62 0.71 0.41 0.39
Germany 0.62 0.13 0.46 0.31 n/a 0.97 0.77 1.00 0.63 0.41 0.41 0.26 0.90 0.66 0.72 0.54 0.52
Greece 0.84 0.02 0.44 0.33 n/a 0.98 0.96 1.00 0.71 0.30 0.21 0.42 0.17 0.34 0.95 0.06 0.00
Hungary 0.53 0.09 0.36 0.12 0.99 0.82 0.99 1.00 0.85 0.53 0.56 0.58 0.31 0.27 0.87 0.04 0.28
Ireland n/a 0.00 0.96 0.06 0.99 0.93 0.96 1.00 0.81 0.13 0.90 0.44 0.30 0.60 0.81 0.15 0.42
Italy 0.70 0.19 0.44 0.59 0.98 0.98 0.98 1.00 0.67 0.29 0.19 0.21 0.33 0.41 0.75 0.22 0.51
Latvia n/a 0.13 1.00 0.59 0.99 0.80 1.00 0.80 0.87 0.31 0.90 0.87 0.05 0.14 0.58 0.04 0.57
Lithuania 0.69 0.04 0.33 0.32 0.99 0.61 1.00 1.00 0.89 0.42 0.95 0.83 0.19 0.25 0.98 0.03 0.28
Luxembourg n/a 0.01 0.41 0.16 n/a 0.94 0.88 n/a 0.34 0.30 0.31 0.00 0.31 0.90 0.70 0.51 0.59
Malta 1.00 0.00 n/a 0.00 0.00 0.96 0.86 1.00 0.25 0.00 0.00 0.17 0.08 0.21 0.96 0.07 0.50
Netherlands 0.23 0.02 0.20 0.12 0.84 0.00 0.00 0.00 0.11 0.05 0.28 0.28 0.56 0.63 0.77 0.79 0.76
Poland 0.48 0.01 0.52 0.19 0.92 0.95 0.99 0.96 0.79 0.19 0.58 0.97 0.19 0.18 0.77 0.03 0.51
Portugal 0.94 0.19 n/a 0.30 1.00 0.98 1.00 1.00 0.80 0.38 0.31 0.30 0.30 0.36 0.42 0.07 0.47
Romania n/a 0.02 n/a 0.08 1.00 0.91 1.00 1.00 1.00 0.77 0.44 1.00 0.00 0.03 0.56 0.00 0.40
Slovakia 0.24 0.02 0.70 0.46 0.98 0.57 1.00 0.99 0.88 0.34 0.49 0.53 0.18 0.18 0.59 0.20 0.37 Slovenia 0.61 0.25 0.31 0.43 0.99 0.86 0.98 1.00 0.79 1.00 0.41 0.49 0.63 0.63 1.00 0.03 0.48
Spain 0.60 0.15 0.28 0.39 1.00 0.55 0.99 1.00 0.82 0.19 0.32 0.37 0.28 0.31 0.45 0.21 0.49
Sweden 0.27 0.46 0.30 0.85 0.91 0.74 0.96 1.00 0.86 0.27 0.85 0.27 1.00 0.75 0.63 0.44 0.48
United Kingdom 0.32 0.01 0.43 0.13 0.96 0.97 0.97 1.00 0.58 0.20 0.24 0.35 0.44 0.53 0.88 0.41 0.22 Source: Own calculations based on Eurostat (2020) data
Agricultural biodiversity management
Agricultural biodiversity management across European agriculture is one of the climate change adaptation areas that calls for accelerated action; indeed, this is explicit in the EU biodiversity Strategy 2030 where nature is recognised as an important ally in fighting against climate change (EC, 2020b).
This and ecosystem management must be viewed as comple- mentary activities and not in competition with one another, as both challenges are interlinked. As presented in Table 2 above, only four member states have a biodiversity manage- ment index above 0.5 with Finland (0.75), Latvia (0.57), Aus- tria 0.56, and Sweden (0.54). Specifically, and taking a keen interest in the area protected for biodiversity, only Finland has an index above 0.5, with all the other countries having low indices. In terms of organic farming adoption, which is an eco- system-friendly agricultural practice, Austria (1.0), Sweden (0.85) and Estonia (0.81) had the highest sub-indices while Romania (0.08), Bulgaria (0.08), and Ireland (0.06) have the lowest indices for organic farming adoption. Birds contribute significantly to the agricultural area and the protection of birds across Europe is significantly higher in Latvia (1.0), Ireland (0.96), Cyprus (0.87) and Finland (0.75).
The adoption of results-based eco-schemes as proposed under the Biodiversity strategy – in line with the Farm to Fork Strategy under the new CAP – is a plausible pathway for establishing a connection between nature preservation and the agricultural sector. The EU Pollinators initiative is a good indicator of the importance attached to birds and how they can positively influence the sectoral adaptation to climate change (EC, 2018b). Similarly, the EU Biodiversity strategy-2030 proposes that the agricultural sector must con- vert at least 25 percent of its land to organic production. All these initiatives are geared towards improving soil quality and biodiversity, while at the same time reducing the sectoral footprint of food production. The establishment of an enabling policy environment and knowledge transfer mechanisms to farmers with regard to how to implement these strategies is essential. Improved farm performance is more likely to occur when there is continued empowerment instead of sanctions on failure to amend. Sanctions on environmental protection have the potential to discourage farmers who may perceive good agricultural and environmental conservation practices as detrimental to their economic activities and livelihoods. One significant example of the problems faced here is the planned reduction of the size of Ecological Focus Areas (EFA) from their current 15 ha. This became necessary because in some countries, e.g., Romania, the average farm size is below 15 ha, a fact that exempts them from the intended incentive and therefore renders the EFA conditionality inefficient (Wiréhn, 2017; Zinngrebe et al., 2017). Although protection is still a good measure, the EU-Nature restoration plan advocates res- toration as being the most plausible way to align the interests of agriculture with the preservation of nature (EC, 2020b).
Agricultural environmental management
An environmentally aware agricultural sector will emit less pollution and pay less environmental pollution tax. In terms of their pollution and environmental tax liability, most
of the European member states have impressive indices for environmental awareness with indices above 0.8 as shown in Table 2. In terms of waste generation per capita across the agricultural sector, only the Netherlands had an index below 0.5 followed by Spain (0.55) and Slovakia (0.57).
In general, environmental management performance across European agriculture is a strength and all the member states are performing well. The strong environmental performance can be attributed to the strong pace set up globally by the EU for environmental management through the establishment of the world’s leading environmentally friendly policies and implementing them at both national regional and farm levels (EC, 2019b).
Agricultural soil management
The soil management index was developed as a com- posite of input dependency, erosion risk, and nitrogen gross nutrient balance. High input dependency and nitrogen gross nutrient balance are key challenges for healthy soil manage- ment across the European agricultural sector (Table 1 and Table 2). Similar findings were reported by Thaler et al.
(2012) and Vanschoenwinkel et al. (2016) in their analyses of whether both Eastern and western Europe are exposed to similar climate shocks. According to recent analysis, Roma- nia has the highest index for healthy soils due to less depend- ency on inputs and low gross nutrient balance (Zinngrebe et al., 2017). Soils are repositories for GHGs and excess carbon from the atmosphere and ensuring that less reliance on inputs is essential to maintain their healthy status (EC, 2020c). The Netherlands had the lowest soil management index due to its high input dependency, high erosion risk, and high gross nutrient balance (Panagos et al., 2014). The geographical location of the Netherlands defines most of its soils as man- made, subjecting them to high fertility and the presence of peat soils coupled with high nitrates, phosphorous and heavy metals accumulation (Jones et al., 2012).
Belgium and Luxembourg had low indices due to high nitrogen gross nutrient balance. High dependency on nitrog- enous fertilisers increases soil degradation through increased emission of ammonia which increases soil GHG concentra- tion and acidification of the soil and in turn having a negative effect on the water bodies (EC, 2020c). Bulgaria (0.96), Slo- vakia (0.95), Hungary (0.95) and Slovakia (0.95) presents another group of countries whose soils can be categorised as healthy. These countries are covered by food production zones for Europe and require precision and efficient soil and land management to ensure that their soil qualities remain healthy (Panagos et al., 2014). The geographical location of these countries has immensely contributed to their lower soil management levels; consequently, their governments should promote land-use practices that are conducive to lower levels of soil degradation (EC, 2020c).
Agricultural energy management
The paper analysed European agricultural energy sustain- ability, as defined by the sector’s energy supply per ha to the energy use per ha and the countries’ renewable energy pro- duction per capita (national biomass production per capita).
Finland had the highest energy management index (0.92).
Finland has high national biomass production per capita in comparison with the rest of Europe, but at the same time has a low energy sustainability index, a fact necessitating the exploitation of energy-efficient production mechanisms.
Austria (0.71), Lithuania (0.69), Estonia (0.64) and Latvia (0.61) have high national biomass production per capita but low energy sustainability indices. Across Europe, Energy sustainability per ha is weak, with only Slovenia and Austria having higher indices. Cyprus (0.04) and the Netherlands (0.17) had the lowest energy management indices. The Neth- erlands’ low index can be attributed to its low energy sus- tainability due to high levels of mechanisation and a highly intensive agricultural sector with high energy consumption per ha as compared to output per ha. Similarly, the Nether- lands has low national biomass per capita, due again to the intensiveness of its agricultural practices; it has only a small portion of its lands dedicated to biomass production. With an energy management index of 0.52, Ireland has one of the highest per capita levels of biomass production and a low energy sustainability index (0.13).
Adopting energy-efficient agricultural production sys- tems – characterised by high energy efficiency while at the same time increasing the share of renewable energy produc- tion in comparison to food production – is a plausible path
to sector-wide climate change adaptation. Although biomass is not the only source of renewable energy, across Europe it accounts for more than two-thirds of renewable energy with the majority of biomass production occurring in agriculture.
Irregular bioenergy management practices can lead to indi- rect land use change which can cause adverse effects to the sector (Valin et al., 2014). Exploring sectoral energy produc- tion by converting agricultural production waste into energy through increased circular production methods and the use of renewable energy can accelerate sectoral adaptation to climate change (Viaggi, 2015).
Agricultural information, knowledge, and skills management
The agricultural knowledge, skills, and knowledge man- agement across European agriculture, had no member state with an index above 0.8. Denmark (0.77), Austria (0.74) and Finland (0.72) had the highest information, skills, and knowledge management index. These findings correlate to those of PRO-AKIS report by the EIP-agri where European member states were categorised based on the nature of the AKIS structure; Denmark, Austria and Ireland were classi- fied as having a strongly integrated system (EIP-Agri, 2018).
Denmark had the highest index overall, but had a low index
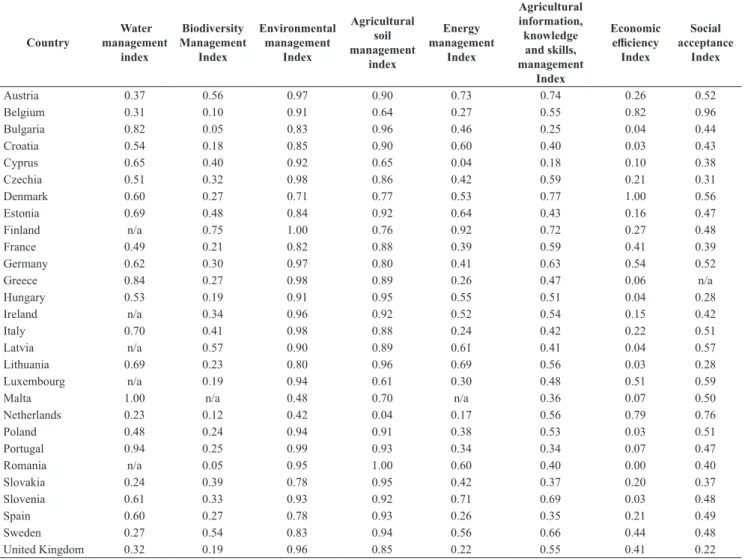
Table 3: Determinants of Relative Climate Change Adaptation Index by EU countries.
Country Water management
index
Biodiversity Management
Index
Environmental management
Index
Agricultural soil management
index
Energy management
Index
Agricultural information, knowledge and skills, management
Index
Economic efficiency
Index
Social acceptance
Index
Austria 0.37 0.56 0.97 0.90 0.73 0.74 0.26 0.52
Belgium 0.31 0.10 0.91 0.64 0.27 0.55 0.82 0.96
Bulgaria 0.82 0.05 0.83 0.96 0.46 0.25 0.04 0.44
Croatia 0.54 0.18 0.85 0.90 0.60 0.40 0.03 0.43
Cyprus 0.65 0.40 0.92 0.65 0.04 0.18 0.10 0.38
Czechia 0.51 0.32 0.98 0.86 0.42 0.59 0.21 0.31
Denmark 0.60 0.27 0.71 0.77 0.53 0.77 1.00 0.56
Estonia 0.69 0.48 0.84 0.92 0.64 0.43 0.16 0.47
Finland n/a 0.75 1.00 0.76 0.92 0.72 0.27 0.48
France 0.49 0.21 0.82 0.88 0.39 0.59 0.41 0.39
Germany 0.62 0.30 0.97 0.80 0.41 0.63 0.54 0.52
Greece 0.84 0.27 0.98 0.89 0.26 0.47 0.06 n/a
Hungary 0.53 0.19 0.91 0.95 0.55 0.51 0.04 0.28
Ireland n/a 0.34 0.96 0.92 0.52 0.54 0.15 0.42
Italy 0.70 0.41 0.98 0.88 0.24 0.42 0.22 0.51
Latvia n/a 0.57 0.90 0.89 0.61 0.41 0.04 0.57
Lithuania 0.69 0.23 0.80 0.96 0.69 0.56 0.03 0.28
Luxembourg n/a 0.19 0.94 0.61 0.30 0.48 0.51 0.59
Malta 1.00 n/a 0.48 0.70 n/a 0.36 0.07 0.50
Netherlands 0.23 0.12 0.42 0.04 0.17 0.56 0.79 0.76
Poland 0.48 0.24 0.94 0.91 0.38 0.53 0.03 0.51
Portugal 0.94 0.25 0.99 0.93 0.34 0.34 0.07 0.47
Romania n/a 0.05 0.95 1.00 0.60 0.40 0.00 0.40
Slovakia 0.24 0.39 0.78 0.95 0.42 0.37 0.20 0.37
Slovenia 0.61 0.33 0.93 0.92 0.71 0.69 0.03 0.48
Spain 0.60 0.27 0.78 0.93 0.26 0.35 0.21 0.49
Sweden 0.27 0.54 0.83 0.94 0.56 0.66 0.44 0.48
United Kingdom 0.32 0.19 0.96 0.85 0.22 0.55 0.41 0.22
Source: Own calculations based on Eurostat (2020) data
in agricultural human resource employment in science and technology (0.28). Cyprus (0.18) and Bulgaria (0.25) had the lowest indices (Table 1 and Table 2). These countries had low sub-indices for research and development as a share of the GDP and for research and development personnel as a percentage of the active working population. It can there- fore be concluded that increasing the share of research and development relative to GDP and creating more opportuni- ties for employment in research and development positively correlates with knowledge discovery and dissemination and relevant skills management.
Agricultural social integration
To assess the level of societal change in relation to cli- mate change adaptation, the paper outlined social acceptance as a measure of how society is adapting. Societal acceptance of a new way of living was measured by assessing the com- munities’ waste recycling and the ability to involve youth in agricultural activities. Waste recycling as part of the 3-R prin- ciples of circular economy to establish Green Growth holds the potential to be an indication of environmentally aware society. In terms of waste recycling, Belgium had the highest index (1.0) followed by the Netherlands (0.66) with the rest of the member states having a sub-index below 0.5 (Table 1 and Table 3). This is an indication that waste recycling is still low in most of the member states. The low sub-indices correlate with the findings of the BIOREGIO that presented the food waste figures for selected member states based on the findings of the project (BIOREGIO, 2019). High figures of food waste are an indication of low recycling capacity.
In order to assess the future attractiveness of agriculture, young people’s income from agriculture as a share of national farm income was examined across member states. The higher the share of youth income per ha, the higher was the possibility
of a higher level of involvement in farm activities. Higher indi- ces were recorded across all the member states except for the UK and the Czech Republic. Farmers’ aging is a general chal- lenge across European agriculture. Low future attractive indices are more likely to imply that fewer youths are highly involved in agriculture. Therefore, incorporating more youths in the sector by making it more favourable is more likely to improve sectoral adaptation capacity. High involvement of youths in the agricul- tural sector is a promising strategy that offers a potential solu- tion not only for climate change adaptation but also for an age- ing society. Strong social integration promotes cohesion among farmers, as those who are socially organised are more likely to take adaptive measures than their less organised counterparts.
Agricultural economic management
In terms of farm economic efficiency, Denmark had the highest index (1.0), Belgium (0.82) and the Netherlands (0.79) and Germany (0.54). All the other member states had an index below 0.5, which is an indication of low farm efficiency.
Increasing farm income efficiency by increasing the farm income and farmers’ welfare through reduced working hours while adapting to the negative impacts of climate change is a plausible adaptation pathway. Every farmer wishes to run their operations profitably. Ensuring that green growth is viewed as the roadmap for farmers is a promising route for farmers to take with a view to maximising their incomes in a sector facing potentially drastic climate change (Acosta et al., 2020).
Relative Climate Change Adaptation Index (RCCAI)
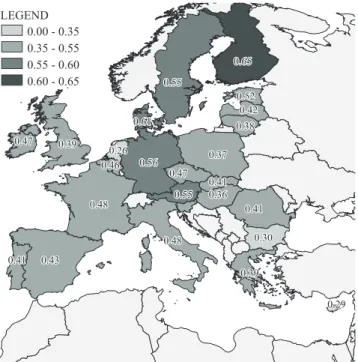
Finland had the highest agricultural RCCAI of 0.65 fol- lowed by Denmark (0.61). Based on the adaptation classi- fication criterion developed in 3.2 above (step 4), Finland and Denmark were classified as those countries with the highest potential for adaptation to climate change in their agricultural sector. Germany (0.56), Austria (0.55), and Sweden (0.55) were categorised as having the potential for adaptation to climate change. Taken together, this group of countries were considered to have strong potential to adapt to climate change.
The remaining 23 member states were defined as having weak potential for climate change adaptation and thereby, as being at risk of climate change. They were further regrouped in two classes as presented in Figure 1. The spatial presenta- tion of the indices shows that Southern European member states fall under the risky category. These results are similar to the findings of JRC/EEA which classifies Southern Europe as under high risk of climate change (EEA, 2020; Merino et al., 2020); this can be strongly attributed to their increased exposure to climate change over the past decade.
Discussion and Conclusion
Making a concerted effort to increase the European agri- cultural sector’s adaptive capacity to climate change remains a priority. Although there is no concrete framework for adap- tation such as exists with mitigation, evidence can be drawn
0.47
0.47 0.55 0.56
0.55
0.52 0.42 0.38 0.37
0.36 0.41
0.41 0.30
0.39
0.29 0.61
0.65
0.39 0.46
0.26
0.48
0.48 0.43
0.41 0.47
0.47 0.55 0.56
0.55
0.52 0.42 0.38 0.37
0.36 0.41
0.41 0.30
0.39
0.29 0.61
0.65
0.39 0.46
0.26
0.48
0.48 0.43
0.41
0.00 - 0.35 0.35 - 0.55 0.55 - 0.60 0.60 - 0.65 LEGEND
Figure 1: Relative Climate Change Adaptation Index by EU countries.
Source: Authors’ own calculation