50 100 150 200 250
Thousand persons
1940 1950 1960 1970 1980 1990 2000 2010
2. THE “USUAL SUSPECTS” – DEMOGRAPHIC REPLACEMENT AND EMPLOYMENT ABROAD 2.1 DEMOGRAPHIC REPLACEMENT
Zoltán Hermann & Júlia Varga
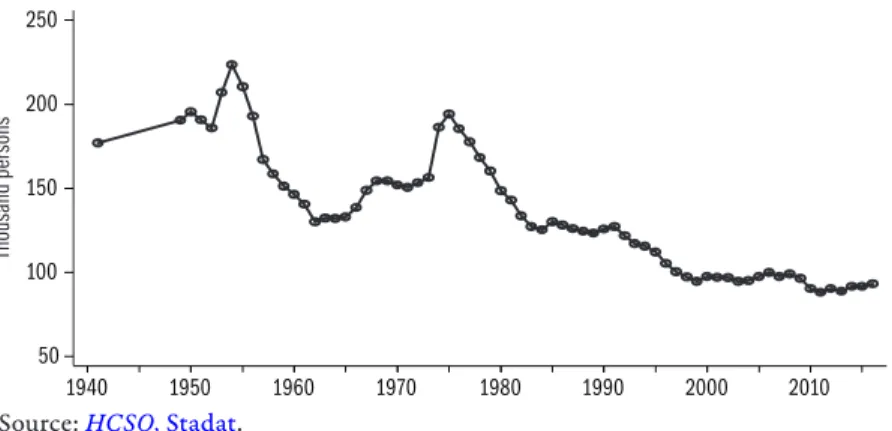
Demographic replacement means the change in the composition of the pop- ulation, which is affected by changes in birth rates and life expectancy of the population, changes in the educational attainment of entering and exiting cohorts as well as immigration and emigration. Demographic replacement of the active age population is also determined by changes in retirement regu- lations and education policy. Demographic replacement has an impact on la- bour supply and thus on trends in labour shortage. In recent years, populous age groups (the so-called “Ratkó children”) have retired or are retiring and less and less populous ones enter the labour market (Figure 2.1.1). This Subchap- ter examines how this may influence the labour shortage. Only differences in birth rates and changes in education policy and retirement regulations are tak- en into account, immigration and emigration are not included. In addition to trends that have already taken place, expected future changes are also discussed.
Figure 2.1.1: The number of live births 1940–2016
Source: HCSO, Stadat.
The impact of demographic replacement on labour supply is estimated in a sim- ple model. The model describes changes in the number of people potential- ly on the labour market. Demographic replacement is defined as the differ- ence between the number of people entering the labour market from the school system and the number exiting the labour market (due to retirement or death). Demographic replacement in a given educational attainment cat- egory is as follows:
),
( 1, ,
, j
retage k j t k retage
entagej k
j k j t
entagej k j t
t N N p N
D =
= –
= – × +
=
∑
(1)where D is the balance of demographic replacement in the j educational at- tainment category in year t, while N is the number of people in the popula- tion aged k in the year concerned. The first element on the right-hand side of the equation is the number of new entrants to the labour market: the head- count of the cohort that reaches the entry age in year t (this is represented by the variable entagej relevant to educational attainment j). The second member represents the number of outgoing workers. Death in active working age (age between entry age and retirement age) is also regarded as exit. P represents the probability of death at age k in j educational attainment category. The other large group of exiters consist of retiring workers. In year t, the cohort reach- ing the effective retirement age (retage) in that year takes retirement.1 Calcula- tions have been made for women and men separately but – for convenience – equation (1) does not contain indexes designating gender.
Cumulating the different educational attainment categories, the balance of demographic replacement for the entire active age population is obtained:
).
( 1, ,
, j tk retage
k retage
entagej
j j k
j k j t
entagej k t
t N N p N
D =
= –
= – × +
=
∑ ∑ ∑
(2)The model roughly describes changes in the size of the active age population, relying on two important simplifying assumptions. Firstly, it is assumed that everyone retires when reaching the effective retirement age, that is, neither early retirement (e.g. due to invalidity), nor employment after retirement are taken into account. Secondly, for convenience, it is assumed that young peo- ple with a tertiary qualification enter the labour market at the age of 25, and with a lower qualification at the age of 20. Therefore, in each year, in each edu- cational attainment category, the members of the same cohort enter the labour market. In fact, entrants belong to a few consecutive cohorts, their headcount would be possible to determine as the weighted average of the adjacent cohorts.2
The calculations are based on census data from 2011. The data are aggre- gated on the basis of cohorts and not educational attainment. When estimat- ing death rates, death probability calculated from death rates published by HCSO in the early 2000’s broken down to age, gender and qualification level were used for the whole period (i.e. death rates are assumed unchanged). Sin- gle year of age population estimates for each year are calculated using death probability, net of mortality after 2011 and calculated backwards before 2011.
The size of educational attainment categories is the same as the figure actu- ally observed in the census in the case of cohorts born before 1987 (or before 1982 in the case of higher education graduates), while in the case of younger cohorts, the latest observed educational attainment proportions were applied, assuming that the proportions of educational attainment remain unchanged.3
The balance of demographic replacement in an educational attainment cat- egory depends on two factors: the difference in the size of cohorts entering
1 In years when the retirement age is specified for half years, we estimated that half of the cohort of the given year retires.
2 �e opted for the simpler pro��e opted for the simpler pro�
cedure because these weights are difficult to determine precisely, and they probably change over time.
3 �e cannot assume that the education of younger cohorts had typically finished by the year of the census. Higher edu�
cation graduates are assumed to achieve the educational attain�
ment proportion that is largely considered final at the age of 30.
200 250 300 350 400
2001-05 2011-15 2021-25 Males
200 250 300 350 400
2001-05 2011-15 2021-25 Entrants Outgoing workers
Females
-100 -50 0 50 100
Thousand persons
2001-05 2011-15 2021-25 Males
-100 -50 0 50 100
2001-05 2011-15 2021-25 Females
and exiting and the difference in the proportion of educational attainment categories within cohorts entering and exiting, i.e. long term changes in birth rate and schooling. In order to assess the relative weight of the two factors, we have calculated the balance of demographic replacement with no changes in birth rates, that is, with cohorts of equal size. The demographic replacement obtained in this way only indicates the impact of changes in the proportions of educational attainment. The balance of demographic replacement with unchanged population size is:
, tj Btj
Bt tj
K
Kt
D~ = – ×–
∑
j∑
j , (3)where Btj represents the number of entrants and Ktj represents the number of outgoing workers in educational attainment category j, while Bt andKt are the total number of entrants and outgoing workers in year t.4
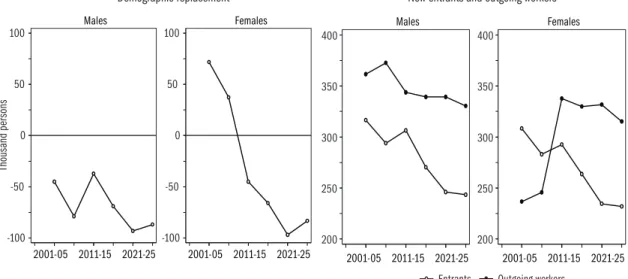
Figure 2.1.2 shows the changes in the number of new entrants and outgoing workers and in demographic replacement broken down to gender in the en- tire active age population, and Figure 2.1.3 shows the changes in the number of new entrants and outgoing workers broken down to gender in the various educational attainment categories. The extent of demographic replacement is given in thousand persons in Table 2.1.1 and proportionately to the popu- lation in 2011 in Table 2.1.2.
4 In years when the number of outgoing workers differed not only because of the size of co�
horts but also because, due to transitional rules, only a part of the cohort retired, this dif�
ference was adjusted first, that is, we made the calculations as if the whole cohort had retired.
Figure 2.1.2: Demographic replacement and the number of new entrants and outgoing workers in the active age population, 2001–2030
Demographic replacement New entrants and outgoing workers
0 50 100 150 200
Thousand persons
2001-05 2011-15 2021-25 0 50 100 150 200
2001-05 2011-15 2021-25 0 50 100 150
2001-05 2011-15 2021-25 0 50 100 150
2001-05 2011-15 2021-25
0 20 40 60
Thousand persons
2001-05 2011-15 2021-25 0 20 40 60
2001-05 2011-15 2021-25 0 20 40 60
2001-05 2011-15 2021-25 0 20 40 60
2001-05 2011-15 2021-25
0 50 100 150
Thousand persons
2001-05 2011-15 2021-25 0 50 100 150
2001-05 2011-15 2021-25
Entrants Outgoing workers
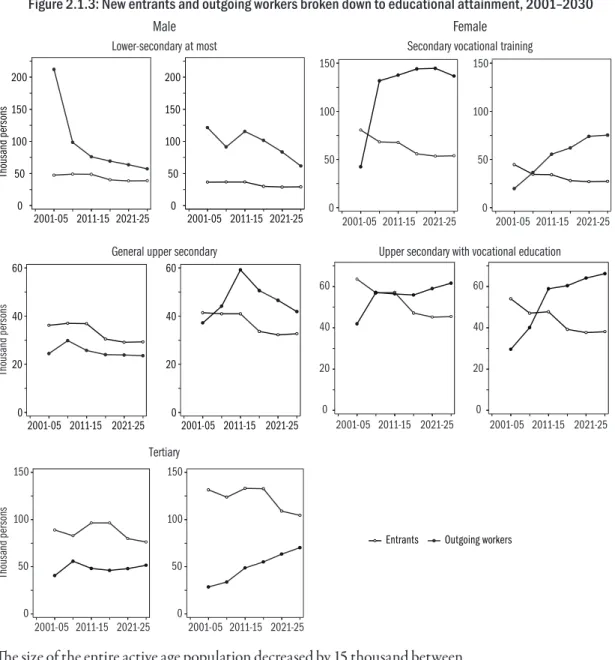
Figure 2.1.3: New entrants and outgoing workers broken down to educational attainment, 2001–2030 Male Female
Lower-secondary at most Secondary vocational training
The size of the entire active age population decreased by 15 thousand between 2001 and 2010, which is primarily because the decreasing headcount of the cohorts in that period was offset by the increase of the retirement age of wom- en. The size of the entire active age population will decrease by 217 thousand between 2010 and 2020 and by 360 thousand between 2020 and 2030.
The entering cohorts are more educated than the outgoing ones but because the outgoing cohorts are larger, the headcount of active-age people decreases in every educational attainment category except in the category of higher ed- ucation graduates. The number of higher education graduates will increase by
General upper secondary Upper secondary with vocational education
Tertiary
260 thousand between 2011 and 2020, while the number of those with an up- per secondary and vocational qualification will decrease by 40 thousand, the number of those with a general upper secondary qualification will decrease by nearly 18 thousand, the number of those with a vocational training cer- tificate will decrease by 213 thousand and the number of those with a lower secondary qualification will decrease by 206 thousand.
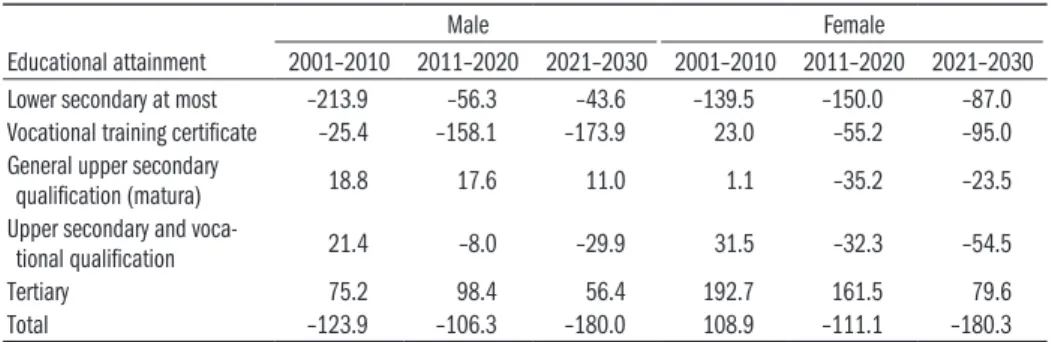
Table 2.1.1: Demographic replacement between 2001–2030, by educational attainment and gender (thousand persons) Educational attainment
Male Female
2001–2010 2011–2020 2021–2030 2001–2010 2011–2020 2021–2030
Lower secondary at most –213.9 –56.3 –43.6 –139.5 –150.0 –87.0
Vocational training certificate –25.4 –158.1 –173.9 23.0 –55.2 –95.0 General upper secondary
qualification (matura) 18.8 17.6 11.0 1.1 –35.2 –23.5
Upper secondary and voca-
tional qualification 21.4 –8.0 –29.9 31.5 –32.3 –54.5
Tertiary 75.2 98.4 56.4 192.7 161.5 79.6
Total –123.9 –106.3 –180.0 108.9 –111.1 –180.3
Table 2.1.2: Demographic replacement between 2001–2030, by educational attainment and gender in proportion to the active age population of 2011 (percentage) Educational attainment
Male Female
2001–2010 2011–2020 2021–2030 2001–2010 2011–2020 2021–2030
Lower secondary at most –45.0 –11.8 –9.2 –24.6 –26.5 –15.4
Vocational training certificate –2.4 –14.8 –16.3 3.9 –9.4 –16.2
General upper secondary
qualification (matura) 7.4 6.9 4.4 0.3 –8.3 –5.5
Upper secondary and voca-
tional qualification 4.0 –1.5 –5.6 5.4 –5.6 –9.4
Tertiary 15.1 19.8 11.3 27.5 23.1 11.4
Total –4.4 –3.8 –6.4 3.8 –3.9 –6.3
There are substantial differences according to gender: there is a considerably greater increase in the number and proportion of higher education graduates and a decrease in the number and proportion of those with a lower second- ary qualification at most among women. The proportion of men with a lower secondary qualification decreased dramatically, by more than 45 per cent be- tween 2001 and 2010, because the outgoing cohorts had a high proportion of low-qualified men. A further significant decrease is expected between 2011 and 2020: by 12 per cent among men and by more than 26 per cent among women. The proportion of men with a vocational training certificate will decrease by 15 per cent and that of women by 9 per cent between 2011 and 2020 and a similar decrease is expected in the following decade. The propor- tion of men with a tertiary (higher education) qualification will increase by
0
–50
–100
–150
Thousand persons
2001-05 2011-15 2021-25 0
–50
–100
–150
2001-05 2011-15 2021-25 50
0
–50
–100
2001-05 2011-15 2021-25 50
0
–50
–100
2001-05 2011-15 2021-25 20
10 0 –10 –20
Thousand persons
2001-05 2011-15 2021-25 20 10 0 –10 –20
2001-05 2011-15 2021-25 30 20 10 0 –10 –20 –30
2001-05 2011-15 2021-25 30 20 10 0 –10 –20 –30
2001-05 2011-15 2021-25
0 20 40 60 80 100
Thousand persons
2001-05 2011-15 2021-25 0 20 40 60 80 100
2001-05 2011-15 2021-25
Demographic replacement Demographic replacement in case of unchanged cohorts size
20 per cent and that of women by 23 per cent between 2011 and 2020 and the following decade will see a slower – 11–11 per cent – growth unless there are considerable education policy changes.
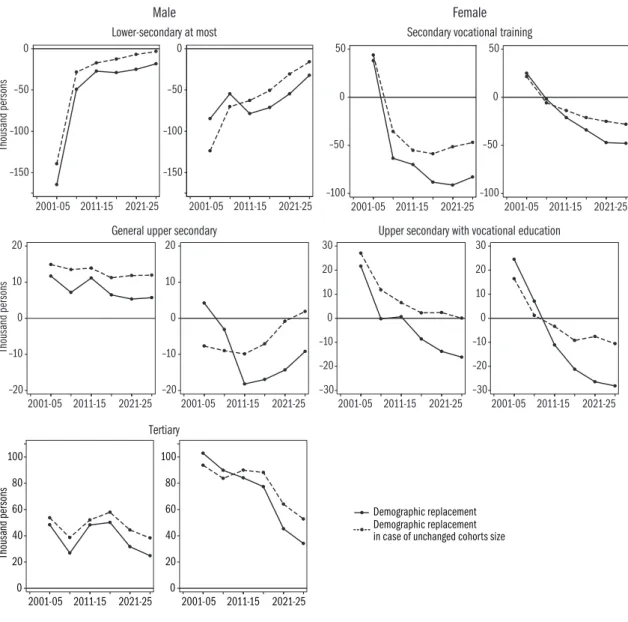
Figure 2.1.4: The impact of changes in birth rates on demographic replacement broken down by educational attainment, 2001–2030
Male Female
Lower-secondary at most Secondary vocational training
General upper secondary Upper secondary with vocational education
Tertiary
Figure 2.1.4 shows the estimates for the impact of the difference in the size of entering and outgoing cohorts on demographic replacement and how de- mographic replacement would change if birth rates were unchanged, that is, all cohorts were the same size. When the two curves are close to each other
and are largely parallel, it indicates that differences in schooling play a key role in demographic replacement, since identical cohort sizes would have resulted in the same increase/decrease in the headcounts of educational at- tainment categories.
As seen in Figure 2.1.4, this is the case among the lowest qualified – with lower secondary qualification at most – where the headcount would have de- creased similarly in the case of identical cohort sizes. And this is also the case with higher education graduates, where the headcount would have increased similarly. Trends are mixed in the other educational attainment categories. In the general upper secondary category, the headcount of men would have in- creased to a similar extent with identical cohort sizes, because a larger propor- tion of men have obtained this qualification than before. However, in the de- mographic replacement of those with a vocational training certificate, changes in the size of cohorts played just as important a role as differences in schooling.
As a result of demographic replacement, the active age population will de- crease by about 6 per cent between 2011 and 2020 but its educational/school- ing composition will considerably improve. Although the decrease is signif- icant, so far it has not been substantial enough to play a key role in labour shortage tendencies. Emigration, on the other hand – which we have not investigated – may reinforce the effect of these processes. In addition, in the following decade (until 2030) there will be larger decreases (of more than 12 per cent) in the number of active age workers and more significant changes in the schooling composition unless retirement regulations and education policies are amended.