english: https://doi.org/10.33924/amt-2020-01-01
State Monitoring of Polymer Composites with Glass Optical Fibre and with Equipment Used in Telecommunication
Gergely Hegedűs,1 Tibor1 CzIGány 1, 2*
1Budapest University of Technology and Economics, Faculty of Mechanical Engineering, Department of Polymer Engineering, Budapest, Hungary
2 MTA–BME Research Group for Composite Science and Technology, Budapest, Hungary
* Corresponding author: czigany@eik.bme.hu
Abstract
Thanks to the widespread use of optical fibers in telecommunication, they, and their accompanying equip- ment have become cost-effective and easily accessible. We have proved that the changed attenuation of a monomodal optical fiber built into a polymer composite can indicate the elongation of the structure com- pared to its original, unloaded state, before the optical fiber breaks. We also proved that the location of deformation in polymer composite structures can be found with OTdR equipment (used for checking the coupling of optical fibers).
Keywords: polymer composite, deformation monitoring, optical fiber, attenuation meter, OTDR.
1. Introduction
Due to the continuous development of polymer composites, the need to know their material be- havior is becoming increasingly important. Be- cause of their complex structure, the simulation of their behavior [1, 2] is a complex task that has to take into account the different structural lev- els of composites, from the nanoscale material components, through the connection of the mi- cro-level constituents (fiber, matrix) to the mac- ro-level component (layers). For this reason, it is important to monitor the structural health of composites with non-destructive, in-situ physical methods [3]. Their complex structure allows the integration of health monitoring sensors, which greatly increases their competitiveness against other structural materials [4]. With built-in opti- cal sensors, it is possible to monitor deformation, stresses, and the resulting damage and defects during the entire life of the composite (lamina- tion, crosslinking, removal from the mold, as- sembly, use). some characteristics of the light (power, phase, polarization, wavelength, timing, and spectral distribution) propagated in the opti- cal fiber of the optical sensors change as a result of external conditions (such as load on the fiber,
deformation) [5]. Common to the different types of optical sensors is that the signal-processing de- vice can be detached from the optical fiber. It is a separate unit; it does not need to be built into the composite [6]. The use of optical sensors is be- coming more and more common in laboratories but has not become widespread in cost-sensitive industries (e.g., the automotive industry) because it requires the installation of a relatively complex, expensive system.
An optical fiber is often used to transmit the sig- nal between optical sensors and the processing unit. Nowadays, optical fibers and related tele- communications equipment have become readily available. The most common tool for examining the condition of joints (connections, welds) used in optical networks in telecommunications is the optical power meter. An optical power meter set consists of a light source of specific wavelength (most commonly 1310 and 1550 nm), which can be connected to one end of the optical network, and a power meter unit, which can be connect- ed to the other end of the network. Attenuation (α(λ) [dB]) is the ratio of the radiated power input (Pin) and the output (Pout) of the fiber expressed in decibels [7] (1):
α(λ) = 10 · lg(Pin/Pout) (1) The radiated power required to calculate the attenuation is the power (watts) emitted, trans- mitted, or received in the form of radiation [8].
Another common tool used to test optical net- works is optical time-domain reflectometry (OTdR), which uses reflected light due to Rayleigh scattering. Rayleigh scattering is caused by the micro-anomalies in the optical fiber. As a result of the anomalies, some of the light energy in the fiber is scattered in all directions. The closer the wavelength of the light to the magnitude of the micro-defects is, the greater the degree of scattering. The part of the scattered light that arrives at the cladding of the optical fiber at an angle greater than the critical angle is reflected from it and can even travel backward within the fiber. By measuring the backscattered light, in- formation can be obtained about the inhomoge- neities of the fiber, or even about the change of the inhomogeneities. The OTDR sends a pulse of light into the fiber and monitors the light return- ing from it. The return signal weakens over time as the light travels longer and longer. With the use of the speed of light in the fiber, the starting point of the return signal can be calculated.
Rayleigh scattering can be used to localize fiber welds, micro bends, joints, fiber defects, cracks, breaks, and branches within the optical network.
With the help of the OTDR, the location of each defect on the optical fiber can be determined with an accuracy of the order of meters [9].
The advantage of the test is that it can be per- formed from one end of the optical fiber since the instrument measures the pulses reflected from the optical fiber.
several researchers have shown that micro- level and macro-level bending of optical fibers is reflected in the power of light transmitted through the fiber [10–12]. several authors have examined the condition of the composite struc- ture with built-in optical fibers, and their results suggest that the decrease in light output at the end of the optical fiber can be used to detect damage [13–15]. This method is suitable for determining the location of the damage, but it does not provide information about its extent.
In our previous papers [16, 17] we investigated the applicability of glass optical fiber to detect the deformation of polymer composites. In this study, we continued to examine the applicability of opti- cal fibers and the devices used in telecommunica- tions for the health monitoring of polymer com-
posite structures. Our aim was to deduce – from the changed characteristic of the light propagating in the built-in optical fiber – the change of the composite compared to its initial, unloaded state, due to repeated load. We measured the change in the attenuation of the built-in optical fiber using instruments commonly used in telecommunica- tions (optical power meter and OTDR) during low cycle tensile loading of the composite specimen.
Our goal was to detect the deformation before the critical condition causes failure, and to de- velop our method further. Our aim was to show that if the increase in fiber attenuation is greater than allowed, i.e., if the optical fiber is damaged somewhere because the polymer composite is damaged, an externally connected OTDR instru- ment common in telecommunications can be used to find the defect.
2. Materials and equipments used
The optical fiber used in the experiments was g.652.d single-mode glass optical fiber with an outer diameter of 125 µm and a core diameter of 9 µm (manufactured by Corning) with a perpen- dicular fiber end design.
We made the composite specimens from two layers of zero and ninety degrees woven (ortho- tropic) prestressed glass fabric (300±5 % g/m2, RT 300 n, Kelteks). Between the two layers, we threaded a 140 mm long section of the 3 m long optical fiber. The optical fiber was guided out of the specimen in front of the grips of the tensile machine so that the grips did not directly load the optical fiber.
The optical fiber proved to be very vulnerable at the exit and entry points of the composite because after manual lamination, the resin surrounding the fiber area made the fiber very stiff and rigid.
To avoid fiber breakage, we only removed the 250 μm lacquer layer of the fiber (for mechani- cal protection) in the middle of the threaded fi- ber over a 100 mm section, leaving a 20 mm lac- quered section on each side of the built-in fiber.
The specimen was reinforced with additional reinforcing fabric as a clamping tab beyond the built-in optical fiber section (beyond 140 mm).
The specimens were not produced independently but were laminated by hand as a single sheet (so that during manual lamination, the fabric layers could be prestressed and would not be creased by the matrix material). Unsaturated polyester resin (AROPOL M105 TB, Ashland spA) and 1.5 % initi- ator (PROMOX P200TX, PROMOX sRL) were used as matrix material. After curing at room tempera-
ture for 24 hours, the specimens were cut from the laminated sheet. The specimens were 25 mm wide, 1.3 mm thick, with a total length of 250 mm.
Clamping length was 195 mm, and the installed length of the optical fiber was 140 mm. Three specimens were prepared for each test.
We used a fiber breaker (Fujikura, CT-30) and a fiber welding machine (Fujikura, FsM 12 s) to splice the optical fiber. We connected light with a wavelength of 1550 nm (AFL Telecommunica- tions, from a Flexscan Fs-200 light source) at one end of the optical fiber. We examined the change in attenuation at the other end of the fiber with an optical power meter and OTDR instrument with a resolution of 0.01 dB (AFL Telecommunica- tions, FLX380-304 FlexTester OTDR).
We loaded the composite specimens with the built-in optical fiber in a tensile machine (Zwick, Bz050 / TH3A), and the strain was calculated from the crosshead displacement (as a quotient of the crosshead displacement and the initial clamping length). The optical power meter does not have a data logger, but the display shows the current attenuation value. To assign these values to the measured displacement and force, the values dis- played by the tensile machine software and the display of the optical power meter were record- ed on video (Figure 1.). With the help of these recordings, the attenuation values could later be assigned to the values recorded by the tensile ma- chine.
3. Results and discussion
3.1. Effect of cyclic tensile loadWe examined the change in the attenuation of the built-in optical fiber on 3 specimens during cyclic tensile loading starting from zero load. The attenuation of the optical fibers built in the speci- mens after gripping was nearly 0 dB. In the tests, the loading and unloading speeds were set to be 1.5 mm/min with an increasing max. displace- ment of 0.1 mm per cycle. In the case of one speci- men, the measured values are shown in Figure 2 and 3.
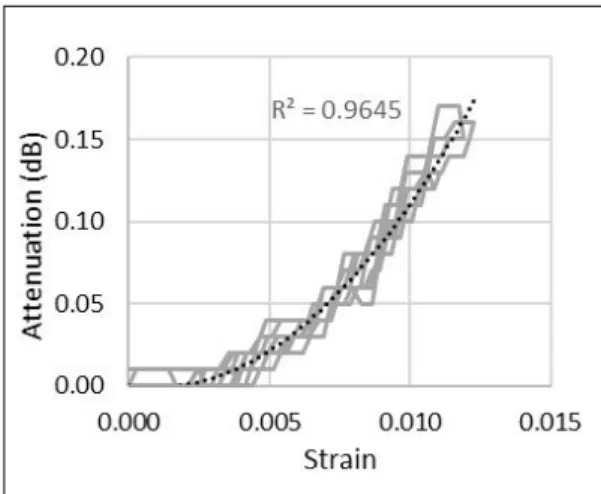
Our results show that the change in the strain and attenuation of the optical fiber can be related, which can be described by a quadratic function with a coefficient of determination greater than 94 % (indicated by the dashed line in Figure 3.) This indicates that the measurement of the al- tered attenuation is suitable for the detection of strain.
Figure 1. Measurement layout (1-measured displace- ment and force values, 2-optical power me- ter, 3-video camera, 4-optical fiber, 5-com- posite specimen, 6-tensile test machine grip- per).
Figure 2. The change of attenuation and strain as a function of time during cyclic tensile load- ing.
Figure 3. Attenuation of the optical fiber as a function of strain during cyclic tensile load.
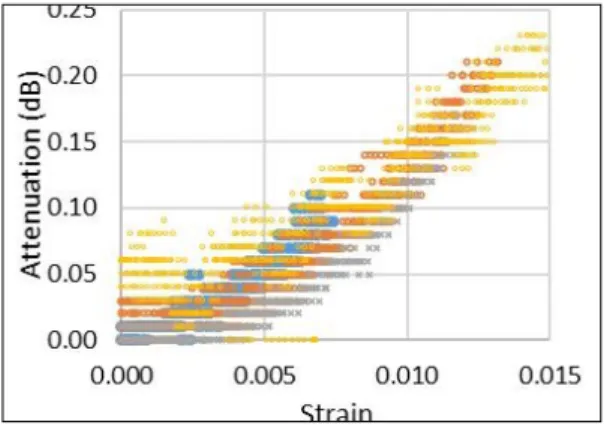
Figure 4. Attenuation measured during cyclic tensile loading as a function of strain (values mea- sured for different specimens are marked with different colors).
Figure 5. Strain and stress as a function of time mea- sured during the testing of a built-in optical fiber loaded on a 2×140 mm long section (stopping the test for testing with the OTDR is identifiable in the figure).
Figure 6. Attenuation and strain as a function of time measured during the testing of a built-in op- tical fiber loaded on a 2x140 mm long secti- on (stopping the test for testing with the OTDR is clearly identifiable in the figure).
Figure 4 summarizes the change in attenuation as a function of strain.
The measurement results show that the attenu- ation of the optical fiber is closely related to its strain. Higher strain results in higher attenuation.
Although the measured attenuation values have a large variance, it can be said that above 1 % strain, the change in the attenuation of the optical fiber is greater than 0.1 dB. This method does not allow accurate strain measurement, but with the help of the changed attenuation of the fiber, the deformation state of the composite element can be categorized: below 0.1 dB attenuation change, the composite is in good condition, while above 0.1 dB attenuation change, it is expedient to test the condition of the composite with additional methods.
In previous tests, a 140 mm long fiber section was built into the specimens and (ideally) the installed section was fully loaded. In our next se- ries of experiments, we investigated the effect of more than one loaded section of the optical fiber.
3.2. The effect of cyclic tensile load on more than one loaded section of the optical fiber To examine several loaded sections of the opti- cal fiber, we clamped 2 specimens side by side in the tensile machine and pulled the specimens to- gether (in a similar layout as shown in Figure 9.).
The optical fibers built into the loaded specimens were welded together with a 10 m long optical fi- ber (the specimens were connected together with 1,5 + 1,5 + 10 = 13 m unloaded optical fibers). With this layout, we were able to load a built-in optical fiber at several points. The length of the loaded op- tical fiber was 2 × 140 mm . Loading and unloading were performed in the same way as in the previous series of experiments, at a speed of 1.5 mm/min, with an increasing maximum displacement of 0.2 mm per cycle. The test was stopped during the 5th cycle and the OTDR was used instead of the optical power meter (the result of this test is presented in Chapter 3.4.). After the test was per- formed with the OTDR, the optical power meter was reconnected to the optical fiber and the test was continued. In cycle 7, the built-in optical fiber was torn and the optical power meter showed an attenuation of over 40 dB. At this time, the OTDR was reconnected to it (see Chapter 3.4.). The torn optical fiber was illuminated with visible light, too. The results are presented in Chapter 3.3.
Figures 5 and 6 show the test results. The atte- nuation measured during the test as a function of strain is shown in Figure 7.
3.4. Determining the location of the large de- formation using OTDR
The results so far indicate that the deformation of the environment of the optical fiber results in a change in the attenuation of the fiber. We aimed to investigate whether the location of the large deformation in the composite structure can be detected with the help of an OTDR, which is also used in the inspection of telecommunication networks. Widespread commercial OTDR instru- ments for testing telecommunication networks are not suitable for continuous monitoring, as it takes a relatively long time to analyze and evalu- ate the measured parameters. The method is not ideal for fast, in-situ condition monitoring (eva- luation is in the order of minutes), but may be a suitable complement to the previously presented attenuation measurement in a periodic condition check. By examining the built-in optical fiber, the method may be suitable for detecting large defor- mations of the composite in the vicinity of the op- tical fiber and for determining the location of the deformation. To prove this theory, we stopped the movement of the crosshead of the tensile test ma- chine under tensile load (Chapter 3.1) when the optical power meter showed a significant jump in the attenuation of the built-in optical fiber (above 1 dB, which indicates a strain of more than 0.8 % in each case). We detached the end of the optical fiber from the optical power meter and recon- nected it to the OTDR using the measurement lay- out shown in Figure 9.
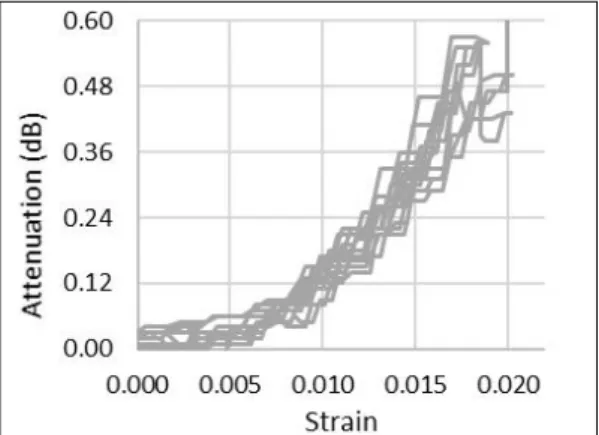
Figure 7. Change of the attenuation of the built-in op- tical fiber loaded at 2×140 mm as a function of strain.
The attenuation change of the optical fiber as a function of strain is bigger than observed in the previous series of experiments, which is clearly due to the greater length of the loaded fiber sec- tion. The optical power meter detects the amount of change in attenuation on both 140 mm loaded sections of the optical fiber.
The results show that the length of the loaded fiber section must be known so that the deforma- tion state of the tested composite part can be de- termined based on the attenuation change of the optical fiber. If an optical fiber is loaded in several places, the magnitude of the loads cannot be de- duced separately with the optical power meter. If a large deformation in the vicinity of the optical fiber breaks the fiber, it can be detected with the optical power meter, but other additional tests are needed to determine the location of the failure, which will be examined below.
3.3. Determining the location of the large de- formation using visible light
Experiments with the optical power meter show that the attenuation of the built-in optical fibers changes as a result of the strain of the composite.
The light attached to the fiber is absorbed and scat- tered due to the strain of the fiber. When the com- posite specimen is highly elongated, the optical fiber may be broken. In the event of a fracture of the fiber, light exits the fiber at the point of failure.
The illumination wavelength of the optical power meter falls in the infrared radiation range, which is not visible. The exit of visible light from the fiber at the point of fracture can be identified, a phenomenon that may be suitable for locating the damage (Figure 8.).
Figure 8. Visible light emitted at the point of fracture in the case of one (a) and two (b) gripped specimens.
a) b)
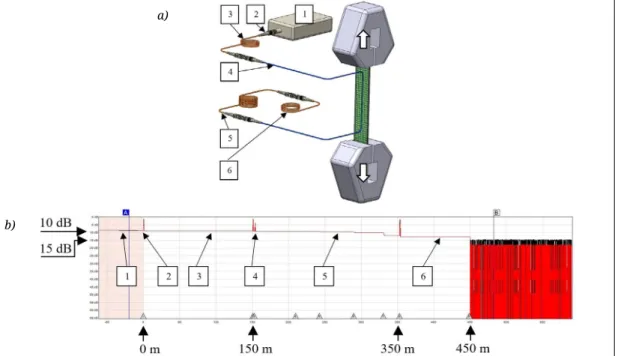
Due to the dead zone of the OTDR, a 150 m opti- cal fiber was connected after the instrument, and the optical fiber built into the composite spec- imen was attached to it with an optical connec- tor. We connected an optical fiber approximately 200 m long to the other end of the built-in optical fiber, to avoid the reflections from the end of the fiber, followed by an additional 100 m long optical fiber wound with a small radius. With the OTdR, we examined the attenuation along the length of the built-in optical fiber at 1310 nm and 1550 nm.
The OTDR can identify the location and value of each jump in attenuation with an accuracy of 0.1 m and 0.01 dB. The evaluation software tries to identify these jumps with the types of equip- ment and failures that occur in the optical net- works. These elements cannot be interpreted in the examination of composites, but the location and value of the longitudinal attenuation change can be easily observed. The attenuation and dis- tance measured with the OTDR on the unloaded specimen are shown in Figure 9.
The tensile test of the specimen shown in sec- tion 3.1. was stopped at an attenuation value of ~20 dB, and the OTDR was connected as de- scribed above. The measured values are shown in Figure 10 and 11.
From the graph obtained from the measure- ment, it can be seen that between the two optical connectors (marked with numbers 2 and 3 at the bottom of Figure 11.) of the built-in optical fiber, the OTDR measured a considerable increase in attenuation. This increase is due to the load of the composite specimen into which the optical fiber is built. The OTdR instrument measured an attenuation of 15.2 dB at 1310 nm and 12.8 dB at 1550 nm at the fiber length of 150.7 m. Contrary to expectations, the attenuation change in the speci- men caused by the tensile load is not separated in the graph from the protrusion caused by the optical connector, which shows the disadvantage of measurement with an OTDR. The OTDR can- not detect the location the deformation causing a large attenuation change with an accuracy of cm.
We also gripped and pulled two specimens to- gether to observe the behavior of the multi-point loaded optical fiber and the possibility of exami- ning it with OTdR. Two optical fibers built into the loaded specimens were welded together with a 10 m long optical fiber (the specimens were con- nected with 1.5 m + 1.5 m + 10 m = 13 m unloaded optical fibers). The measurement layout and the results are shown in Figure 12, 13 and 14.
Figure 9. OTDR measurement layout (a) and the values measured with the OTDR on the unloaded specimen (b) (1 - OTDR, 2 - optical connector, 3 - 150 m long ballast fiber, 4 - 3 m long optical fiber with a 140 mm long section built into the composite specimen, 5 - 200 m long optical fiber, 6 - 100 m long optical fiber wound with a small radius to eliminate reflection).
a)
b)
Only two protruding peaks appear on the graph drawn by the OTDR software, and they do not show the same attenuation change either. The na- ture of the instrument developed for optical net- works is well demonstrated in this measurement.
In this case, the instrument was no longer able to distinguish the mechanical optical connectors, they were no longer displayed on the graph, and the software was not able to properly evaluate the attenuation change measured at each point.
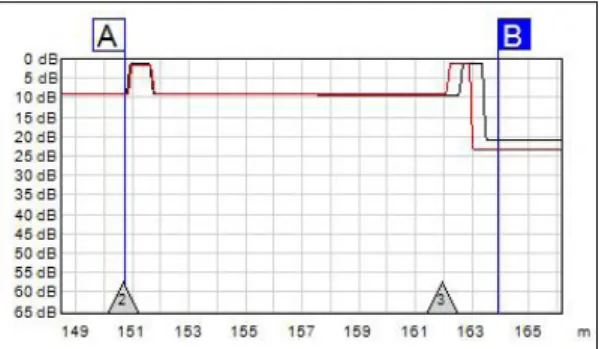
The instrument measured 15.6 dB attenuation at 1310 nm at the location marked with signal line “A”, but did not indicate this on the graph.
At this length, in reality, one of the loaded speci- mens had a built-in optical fiber section and the ODTR regarded the 15.6 dB attenuation change as caused by the tensile load on the specimen. At mark “B”, the device measured 14.3 dB of attenu- ation at 1310 nm and at 162.0 m, and also showed this on the graph.
The results showed that the OTDR is able to de- tect and distinguish several loaded sections of a single optical fiber, it can measure their attenua- tion changes and their location with an accuracy of a few decimeters. However, these sections may Figure 10. The software of the OTDR identifies the
different attenuation-points with numbers marked at the bottom of the figure.
Figure 11. Diagram of OTDR measurement at the atte- nuation drop measured on the loaded spe- cimen, section A-B of Figure 10 enlarged.
Figure 12. Measurement layout with two clamped test pieces (1 - OTDR instrument, 2 - optical connector, 3 - 150 m long ballast fiber, 4 - 1.5 m long fiber section leading to the test piece, 5 - 13 m fiber section connecting the test pieces) , 6 - 1.5 m long fiber section exi- ting the specimen, 7 - 200 m long optical fiber, 8 - 100 m long fiber wound with a small radius to eliminate reflection).
Figure 13. OTDR measurement graph of the fiber lo- aded in the two gripped specimens.
Figure 14. A detail of the OTDR measurement graph of the fiber loaded in the two gripped speci- mens.
be incorrectly identified by the software, so when the results are evaluated, it needs to be conside- red that the software was developed specifically to assess the quality of optical networks.
4. Conclusions
Although originally the optical power meter and the OTdR are used to check the quality of telecommunication optical networks, for a more general purpose, the method presented may be suitable for in-situ condition monitoring of poly- mer matrix composite materials and detect the presence of deformation prior to critical failure.
The cost-effectiveness of the method is ensured by the devices used, since both glass optical fibers and the optical power meter are an easily accessi- ble device nowadays.
Our results show that the attenuation of a sin- gle-mode optical fiber built into a polymer com- posite changes as a function of strain. After the non-damaging load ceases, the attenuation of the built-in optical fiber returns to its initial, unload- ed value. The method is able to indicate the strain of the composite structure above 1 % before it reaches a strain causing damage to the structure.
Knowing the loaded length of the section of the built-in optical fiber, the strain state of the com- posite structure can be categorized on the basis of its attenuation change: proper, or requiring addi- tional testing. In the case of a built-in optical fiber section of a given length, the maximum attenua- tion change at which the strain of the composite does not exceed 1 % can be determined; in the case of a larger attenuation change, the strain of the composite should be tested by additional mea- surement. The reason for the attenuation change is that the optical fiber is adhesively bonded to the matrix of the composite, and thus the optical fiber also deforms as the composite deforms, which re- duces the light transmittance of the fiber, i.e., in- creases its attenuation.
We have shown that the attenuation change due to the deformation of the optical fiber built into a com- posite specimen can also be identified with an OTdR.
The OTDR is not suitable for in-situ analysis, but may be a suitable complement to measurement with an optical power meter. With the help of the OTDR, the location (or locations) of the deformation causing the large attenuation change within the optical fiber can be determined with an accuracy of half a meter.
The differently deformed locations can be separated from each other if there is a suitable length unloaded section (~ 3 m) between them, otherwise the mea- suring instrument will not be able to separate them.
Acknowledgments
This work was supported by the national Research, development and Innovation Office, Hungary (nKFIH) [OTKA K 116070 and K120592; nVKP_16- 1-2016-0046; and 2017-2.2.4-TÉT-AT]; the Higher Education Excellence Program of the Ministry of Human Capacities, Hungary in the frame- work of the nanotechnology research area of the Budapest University of Technology and Economics, Hungary [BME FIKP-nAT];
and the national Research, Development and Innovation Fund, Hungary [TUDFO/51757/2019-ITM, Thematic Excellence Program].
The authors wish to thank András nagy, Péter Dobos and Zsolt szabó (ATL Kft.) for their help in perform- ing the measurements.
References
[1] Kovács L., Romhány G.: Derivation of Ply Specific Stiffness Parameters of Fiber Reinforced Polymer Laminates via Inverse Solution of Classical Lami- nate Theory. Periodica Polytechnica Mechanical Engineering, 62. (2018) 158–164.
https://doi.org/10.3311/PPme.11846
[2] Maamar D., zenasni R.: Optimization of Safety Factor by Genetic Algorithm of Circular Notched Carbon / Epoxy Laminate at Low Velocity Impact.
Periodica Polytechnica Mechanical Engineering, 62. (2018) 218–225.
https://doi.org/10.3311/PPme.12041
[3] sethy d., Makireddi s., Varghese F. V., Balasubra- maniam K.: Piezoresistive behaviour of graphene nanoplatelet (GNP)/PMMA spray coated sensors on a polymer matrix composite beam. Express Polymer Letters, 13/11. (2019) 1018–1025.
https://doi.org/10.3144/expresspolymlett.2019.88 [4] Krawczak P.: Polymer composites: Evolve towards
multifunctionality or perish. Express Polymer Letters, 13/9. (2019) 771.
https://doi.org/10.3144/expresspolymlett.2019.65 [5] Konstantopoulos s., Fauster e., schledjewski R.:
Monitoring the production of FRP composites: A review of in-line sensing methods. Express Poly- mer Letters, 8/11. (2014) 823–840.
https://doi.org/10.3144/expresspolymlett.2014.84 [6] Glisic B., Inaudi D.: Fibre optic methods for struc-
tural healt monitoring. John Wiley & sons Ltd., new york, 2007.
[7] Grattan K. T. V., Meggitt B. T.: Optical fiber sensor technology. springer science+Business Media, B.V, Dordrecht, 1995.
[8] MsZ 9620-1:1990: Fénytechnikai terminológia.
A sugárzás alapfogalmai, mennyiségei és egységei.
[9] Elliott B., Gilmore M.: Fiber Optic cabling. newnes, Oxford, 2002.
[10] Chinpon A., Thamaphat K., Hansuparnusorn M., Limsuwan P.: A force measurement method using
the optical fibre beam. Procedia Engineering, 32.
(2012) 989–993.
https://doi.org/10.1016/j.proeng.2012.02.043 [11] Luo F., Liu J., Ma n., Morse T. F.: Fiber optic mi-
crobend sensor for distributed sensing application in the structural strain monitoring. sensors and Actuators, A: Physical, 75/1. (1999) 41–44.
https://doi.org/10.1016/s0924-4247(99)00043-6 [12] Hu H.-F., sun s.-J., Lv R.-Q., Zhao Y.: Design and
experiment of an optical fiber micro bend sensor for respiration monitoring. sensors and Actua- tors, A: Physical, 251. (2016) 126–133.
https://doi.org/10.1016/j.sna.2016.10.013
[13] Crane R. M., Gagorik J.: Fiber optics for a dam- age assessment system for fiber reinforced plastic composite structures. In: Thompson D.O., Chi- menti d.e. (eds) Review of Progress in Quan- titative nondestructive Evaluation. 28. (1984) 1419–1430.
https://doi.org/10.1007/978-1-4613-3706-5_94
[14] glossop N. d. W., dubois s., Tsaw W., Leblanc M., Lymer J., Measures R. M., Tennyson R. C.: Optical fibre damage detection for an aircraft composite leading edge. Composites, 21/1. (1990) 71–80.
https://doi.org/10.1016/0010-4361(90)90100-B [15] LeBlanc M., Measures R. M.: Impact damage
assessment in composite materials with embed- ded fibre-optic sensors. Composites Engineering, 2/5-7. (1992) 573–596.
https://doi.org/10.1016/0961-9526(92)90044-7 [16] Hegedűs g., Czigány T.: Developing a glass fibre
sensor for polymer technology applications. Insti- tute of Physics (IOP) Conference series: Materials science and engineering, 426. (2018) 012015.
https://doi.org/10.1088/1757-899X/426/1/012015 [17] Hegedűs g., Czigány T.: Analysis of the applica-
bility of optical fibers as sensors for the structural health monitoring of polymer composites: the re- lationship between attenuation and the deforma- tion of the fiber. sensors and Actuators A: Physi- cal, 272. (2018) 206–211.
https://doi.org/10.1016/j.sna.2018.01.039