The paradox of the binomial Ixodes ricinus activity and the observed unimodal Lyme borreliosis season in Hungary
A. Trájera*, Á. Bede-Fazekasb, L. Hufnagelc, J. Bobvosdand A. Páldyd
aNational Institute of Environmental Health, Semmelweis University, Budapest, Hungary;
bDepartment of Garden and Open Space Design, Corvinus University of Budapest, Budapest, Hungary;cDepartment of Mathematics and Informatics,“Adaptation to Climate Change”
Research Group, Corvinus University of Budapest, Budapest, Hungary;dNational Institute of Environmental Health, Budapest, Hungary
(Received 12 March 2013;final version received 17 May 2013)
The change of ambient temperature plays a key role in determining the run of the annual Lyme season. Our aim was to explain the apparent contradiction between the annual unimodal Lyme borreliosis incidence and the bimodal Ixodes ricinus tick activity run – both observed in Hungary – by distinguishing the temperature- dependent seasonal human and tick activity, the temperature-independent factors, and the multiplicative effect of human outdoor activity in summer holiday, using data from Hungary in the period of 1998–2012. This separation was verified by modeling the Lyme incidence based on the separated factors, and comparing the run of the observed and modeled incidence. We demonstrated the bimodality of tick season by using the originally unimodal Lyme incidence data. To model the outdoor human activity, the amount of camping guest nights was used, which showed an irregular run from mid-June to September. The human outdoor activity showed a similar exponential correlation with ambient temperature to that what the relative incidence did. It was proved that summer holiday has great influence on Lyme incidence.
Keywords: Ixodes ricinus; tick activity; Lyme borreliosis disease; bimodality;
temperature dependence
Introduction
Ixodes ricinus ticks are the most important vectors of Borrelia burgdorferi s.l. in the Carpathian Basin, which is the causative agent of Lyme borreliosis (LB) (Hornok 2009;
Halos et al. 2010). Although some researchers found (Brewer et al. 2003; Brownstein et al. 2003; Subak 2003; Schauber et al. 2005; Ostfeld et al. 2006; Schulze et al. 2009) that precipitation or humidity can play role in seasonality of tick-borne diseases, it seems to be that one of the most important abiotic factor is temperature (Randolph &
Rogers 2000; Perret et al. 2003; Ogden et al. 2005; Daniel et al. 2008; Ogden et al.
2008; Gray et al. 2009; Hancock et al. 2011; Wu et al. 2013) and human activity also can play important role. The seasonal patterns of LB cases are a known consequence of two phenomena – the seasonal activity of ticks and the outdoor activity of humans:
according to Randolph (2010), variation in human outdoor activities may influence pos- itively on both the enzootic cycles and the degree of human exposure to the cycles of
*Corresponding author. Email: atrajer@gmail.com
Ó2013 Taylor & Francis
Downloaded by [Ákos Bede-Fazekas] at 07:36 17 July 2013
tick borne disease systems. Human influence may be more important side of the interac- tion than the changes in the transmission potential in natural enzootic cycles (Randolph 2010) and hot, sunny summer weather and in general holiday times make an additional risk on human infection by stimulating people to go to the nature (Šumilo et al. 2008).
According to historical data and field collection studies, the seasonal activity of Ixodes ricinus is bimodal with a spring and fall peak in Hungary (Babos & Faragó 1964; Egyed et al. 2012). Széll et al. (2006) found that the seasonal activity of I. ricinus was the greatest between April and June with a peak in May and the authors found a less marked increase in activity in September and October.
In Hungary, the seasonality of LB does not show the bimodality of the seasonal activity of I. ricinus tick. LB season starts in late February and has a peak season in mid-June, but in July and August, those are the most dry and warm seasons, there is a relatively high LB incidence and the LB season does not show a second peak in the fall months (Hornok 2009).
Our aim was to explain the apparent contradiction between the observed unimodal LB and the known bimodal tick activity run by separating the temperature-related seasonal human and tick activity from the nontemperature-related factors combining with the effect of the multiplicative holiday human outdoor activity. We confirmed the relevance of this approach by creating a model for the period of 1998–2012 in Hungary.
Materials and methods Data sources
The population size of Hungary
The population in 1998 was 10,280,000 and in 2012 was 9958,000 inhabitant (3.13%
total decline/15 year) (KSH 2013b). We considered the average population of Hungary for the entire 15 years as 10,000,000 inhabitants. While we used the weekly percentile of the annual LB incidences, the changing population did not influence the model.
The source and the definition of Lyme cases
The weekly incidence of LB data for the period 1998–2012 was retrieved from one center, the Hungarian National Epidemiological and Surveillance System (OEK 2013). While the Hungarian mandatory system does not distinguish between the infection forms, we defined the “case” as any kind of type of early or late infection form of LB disease. It is important to note that only the complicated cases must be notified in Hungary. LB is a mandatory reportable disease in Hungary, but the ery- thema chronicum migrans or erythema migrans (EM) is not required to be reported.
The diagnosis in our database may be based on three main criteria: persons with typical EM symptoms, persons with late clinical manifestations (arthritis and/or car- diac, neurological disorders, late phase EM), and persons with laboratory confirmed LB with or without symptoms by ELISA, western blot or VlsE lipoprotein IR6 anti- body serological tests.
While the studied period of LB showed an increasing trend with high variance, we used the weekly“relative”(the percent per year) LB incidences in the model. It is very important to note that we retained the term“incidence”because we originally calculated the percentage of the weekly LB values from weekly incidence values. Naturally, the
Downloaded by [Ákos Bede-Fazekas] at 07:36 17 July 2013
precise term of incidence (rate) is the number of new cases per population in a given time period. Hereinafter, we will refer for the percent per year of the weekly LB inci- dences as weekly relative LB incidences (RI).
Weekly mean ambient temperature data
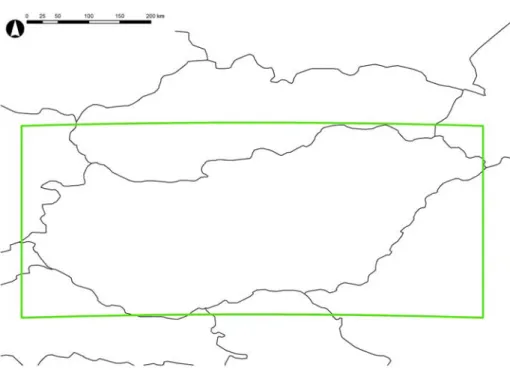
Climatic and the geographical conditions are very homogenous in Hungary. We could handle the country as a homogenous unit. The daily mean temperature data were derived from the European Climate Assessment & Dataset (Haylock et al.
2008). Average values were calculated from the 0.25° grid within the domain including almost the entire Hungary (Figure 1). The latitudinal expansion was 45.7748.56 °N, while the longitudinal was 16.1522.85 °E. We calculated the weekly mean ambient temperature (T) values from the daily mean temperature data with simple averaging method. Temperature values were derived from the period of 1.1.1998–10.31.2012.
Camping guest nights
The monthly guest nights data were derived from the KSH (2013a) database for the period of 01.2008–10.2012. The data of guest nights spent in camping were used. The summarized annual guest nights were 491; 459; 380; 435; and 436 (without the missing data of November and December) thousand, respectively.
Figure 1. The domain used for acquiring temperature data.
Downloaded by [Ákos Bede-Fazekas] at 07:36 17 July 2013
Softwares and statistics
Descriptive statistics, and linear, polynomial, exponential, and Gaussian regression by PAST statistic analyzer (Hammer et al. 2001) and Microsoft Excel Solver add-in were used for this research.
Modeling methods Modeling approach
A model was built to analyze the difference between the observed unimodal run of the annual LB incidence curve and the bimodal activity of Ixodesticks in Hungary and to reconstruct the incidence curve in the studied period. The model was trained to calculate the weekly RIvalues of a certain week based on the weakly mean temperature (T) and the week number. Ourfirst approach was thatRIis the function of a temperature-depen- dent activity factor of both ticks and humans (A)– the human and the tick activity are both positively correlated with the outdoor temperature–and a temperature-independent component of activity (IA).IAmay be related with the actual questing, hungry active tick population, and non-temperature climatic factors, and is the abstraction of the seasonality and population dynamics of ticks. Furthermore, the human activity may have an additional effect in the summer holiday times (holiday multiplier, HM). The two approaches can be formed in simple equations (Equations (1) and (2)).
RI¼A IA ð1Þ
RI ¼A IA HM ð2Þ
Relative weekly incidence and the technical LB year
The lowest LB incidence in the studied period was 9.93 per 100,000 in 1999 and the highest was 23.05 per 100,000 in 2010. Since in the period of 1998–2012 the incidence of LB nearly doubled, we made a variance analysis to analyze whether the trend was significant or not. In case of significant trend, relative (%) incidence should be used instead of absolute incidence. At first, we calculated the LB incidence form the weekly cases.
The occurrence of LB in Hungary can be highly underestimated since the number of patients affected at any one time could be as much as 10% of the population, (Bozsik 2004) and in the neighboring countries the incidence was much higher during the past decade: the incidence of the disease has been more than 100 per 100,000 in Austria and more than 200 per 100,000 in Slovenia (Lipsker and Jaulhac 2009).
Higher temperatures are needed for metamorphosis and egg hatching, between mini- mum 8–11 °C (Daniel 1993) or 5–7 °C (Campbell 1948). Perret et al. (2000) found that when the five days average of the daily maximal temperature was over 7 °C, tick quest- ing activity was always observed. The nymphal activity starts when the maximum air temperature reaches about the 10 °C (Randolph 2009) or 8 °C (Tagliapietra et al. 2011).
We found that in general the 11th week is the first stable spring week, with the T more than 5 °C, which is not followed by a week with T less than 5 °C (mean: 11.133; the week numbers are 13, 12, 12, 10, 8, 12, 11, 11, 12, 9, 12, 12, 11, 11, and 11 for the 15 studied years, respectively).
Downloaded by [Ákos Bede-Fazekas] at 07:36 17 July 2013
We used technical years from the average start of the LB season from the 11th to the next year’s 10th week in the calculation of RI. In conclusion, the period of 03.16.1998–03.11.2012 were used for the modeling.
Human outdoor activity
Human activity may have a great influence on the annual LB incidence (Šumilo et al.
2008; Randolph 2010). We found that many other accommodation types show clear seasonality, but camping was the best suitable approach, because the inside temperature of tents depends on directly the outdoor temperature and humans prefer the sunny, mild, and windless days as ticks as well.
We used the camping guest night data to describe the temperature dependence of the human willingness and seasonality to staying in nature. While the database contains monthly data, we used linear interpolation for two weeks periods to gain higher resolu- tion. The monthly mean temperature showed a strength correlation with the monthly number of camping guest nights. Our previous observations showed that without the July and August data, the remaining 10 months show a Gaussian-like run. We fit a Gauss-curve on the guest nights without the period of 13th–18th two weeks (the omitted period showed an irregular run) by minimizing the sum of squared deviations by Microsoft Excel’s Solver add-in. Because summer is the time of holiday activity, this irregular run can be the consequence of the holidays and the school holidays.
After we fitted the Gaussian curve, we could calculate the observed/calculated ratio (multiplier) of the irregular week pairs to characterize the effect of the summer holidays on human activity. In the case of the irregular two weeks in the further calculations, we used this ratios as a multiplier (hereinafter called holiday multiplier [HM]), while in the case of the nonirregular weeks we thoughtHMas 1.
Temperature-dependent activity
We analyzed the correlation between the RI and T to determine an exponential connection (hereinafter called activity (A)). Theoretically, the chance of the human LB infection is related with both of the outdoor human and tick activity (Equation (3)).
RI Ahuman Atick ð3Þ
We made an exponential regression model without July and August on human camping (outdoor) activity on temperature. This finding showed that both human out- door activity and RI showed a very similar, exponential correlation with temperature.
Hence, we did not distinguish the temperature-related tick and human outdoor activity, but summarized the temperature dependence in one variable (A).
However, LB is a mandatory reportable disease in Hungary; only the secondary manifestation cases are strictly reportable. In addition, our database is a mixture of early localized and disseminated, furthermore late disseminated cases. The EM gives the base of our model since this is able to be directly tied to the time of the biting most of all.
Approximately the 80% of the LB cases symptomatically belong to EM, the early, non- disseminate infection form (Steere 2008).
We made exponential regression model calculating with the weeks when the mean ambient temperature was more than 5 °C and omitting the weeks with 0 LB cases to the peak of the LB season, practically to the 26th week. We used RI of only the increasing phase (1st–26th weeks) of the LB season, because:
Downloaded by [Ákos Bede-Fazekas] at 07:36 17 July 2013
(1) in spring, the soil moisture and the air vapor content is relatively high due to the low evaporation of the previous seasons (low relative humidity is important limiting factor of tick activity);
(2) the relative number of the primer manifestations can be higher than in the later part of the LB season; and
(3) in spring and early summer, according to the literature, the activity of nymphs is the dominant.
Very important is to remove the nonrelevant, cold weeks from the data, where there is not real tick activity. Using this “false”LB, incidence values may imply that there is no threshold of the tick activity. This removing method is useful to avoid also the false effect of the late manifestations of LB in winter time when the temperature is calculated – LB incidence correlation.
The week numbers of the maximum of RI was 27, 27, 24, 26, 27, 25, 28, 25, 26, 24, 24, 27, 24, 29, and 28 for the studied 15 years, respectively (mean: 26.07).
We made linear regression to know whether a significant trend exists in the run of the annual maximum LB incidences in the studied period. The change in the time of the peak did not show significant trend (R2: 0.0092). This result implicate that we can use the 26th week as the peak of the LB season which did not change dur- ing the 15 years.
Using lag
It is important to note that the different forms of LB have different incubation times.
The main vectors in the aspect of humans are infected adults and nymphs. Nymphs feed on their hosts 3–7 days long and their shading lasts for 2–6 months; the EM appear within 7–10 days on average, but it can take up to 30 days before the EM become visi- ble. (Lakos 1991; Lakos 1992; Lakos 1994; Kapiller and Szentgyörgyi 2001; Bacon et al. 2008).
There is a lag from tick biting to the observation and to the appearance of the case in the surveillance (report) system. To analyze the effect of the lag, we used 0, 1, and2 weeks lags. In addition, it was studied whether the exponential regression stronger in case of theHMis part of the expression (dependent variable is notRIbutRI/HM).
Temperature-independent activity
We calculated the temperature-independent component of the activity (IA) by using polynomial regression of the IA = RI/A correlation. Our aim was to find the correlation between the number of weeks and IA. We used only the weeks from the 11th weeks with continuous periods, when the temperature was always more than 5 °C.
Three different approaches were made:
(1) the effect of the summer holidays (HM) was not taken into consideration (IA1);
(2) we added the effect of the summer holidays to the model and the entire year was regressed (IA2);
(3) and a hybrid model (IA3) were made: only the period in the year was regressed when the HM had a visible effect on the run of the population curve (25th–35th weeks), and IA1 curve was used beyond this period. Note that IA3 is a composite function (not continuous).
Downloaded by [Ákos Bede-Fazekas] at 07:36 17 July 2013
Modeling
We compared the modeled results and the observed RI in the period of 03.16.1998– 03.11.2012, and error evaluation (R2and summarized absolute error) was made to com- pare the different models. We made three approaches: (1) A⁄P1; (2) A⁄P2⁄HM; and (3) A⁄P3⁄HM. We displayed the observed and modeled RI, the error, and absolute error for the entire analyzed period.
Results
Descriptive statistics of LB
We found significant (p< 0.01) increasing trend (y= 0.5594x + 9.3829; R²= 0.4764) of LB incidence in the period of 1998–2012, so we had to calculate the relative (%) instead of absolute LB incidence, since in case of same temperature value bound to significantly different incidences the calibration of the model would be problematic methodically.
The LB incidences per 100,000 inhabitants in the order of the years were 10.92, 9.92, 11.08, 12.82, 12.58, 12.27, 12.24, 14.33, 12.31, 9.47, 18.11, 17.38, 23.04, 16.31, 15.49/
100,000 in Hungary. The difference between the biggest (2010) and lowest (1999) LB incidence was 13.12, which means that the difference between 2010 and 1999 was 1,32 times higher than the incidence of 1999. In the studied period in summer from the 24th to the 36th weeks happened the 53.18% of the annual cases, but these values showed minor fluctuations: 68.38%, 54.43%, 49.32%, 50.46%, 52.98%, 52.24%, 52.92%, 56.08%, 56.79%, 41.22%, 51.23%, 53.05%, 49.83%, 60.02%, and 56.36%, respectively.
Human outdoor activity
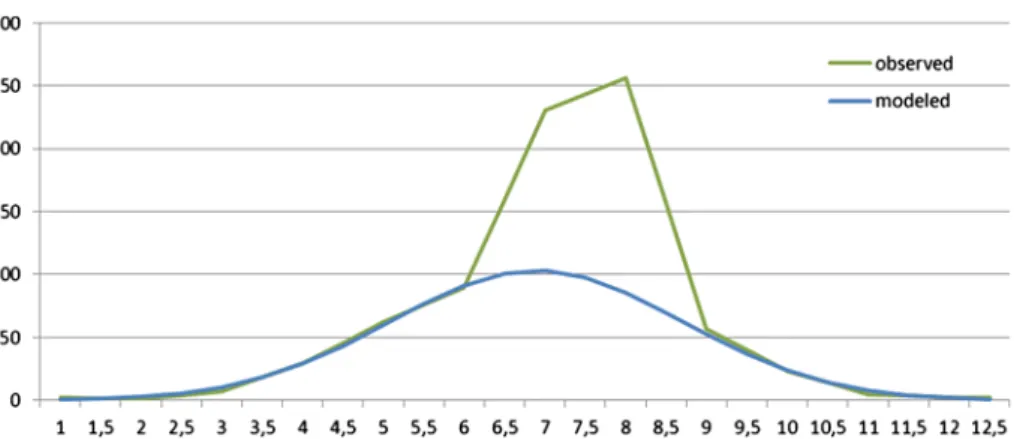
After wefitted the Gaussian curve (Equations (4) and (5)), we calculated the observed/
calculated ratio (multiplier) of the irregular week pairs to characterize the effect of the summer holidays on human activity (Figure 2). From mid-September to the next years’
mid-June, our model strongly (R2: 0.9958) follows the reported run of the camping guest nights.
AhumanNð6:89;1:82Þ ð4Þ
Figure 2. Average gust nights in campings (1000 people; observed), and a normal distribution approximation (modeled) as function of the number of months with half month interval.
Downloaded by [Ákos Bede-Fazekas] at 07:36 17 July 2013
AhumanðhmÞ ¼ 939:74
1:82 ffiffiffiffiffiffi
p2p eð
hm6:89Þ2
21:822 ð5Þ
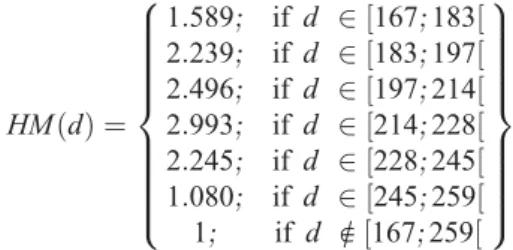
While we were interested in the effect of the summer holidays on the human activ- ity, HM was not calculated for the winter period. The peak multiplier (2.993) occurred in August, while the lowest occurred in thefirst half of September (1.080). In the entire July and August,HMwas above 2.00 (Figure 3, Equation (6)).
HMðdÞ ¼
1:589; if d 2 ½167;183½ 2:239; if d 2 ½183;197½ 2:496; if d 2 ½197;214½ 2:993; if d 2 ½214;228½ 2:245; if d 2 ½228;245½ 1:080; if d 2 ½245;259½ 1; if d R½167;259½ 8>
>>
>>
>>
><
>>
>>
>>
>>
:
9>
>>
>>
>>
>=
>>
>>
>>
>>
;
ð6Þ
Temperature related human outdoor activity
Monthly camping guest nights and monthly mean temperature showed a strong correla- tion (R2: 0.9329) in the period of 0.1.2008.–10.2012 (Equation (7), Figure 4).
AhumanðTnÞ ¼3:445 e0:058Tn ð7Þ
The results of exponential regression are as follows (Figure 5): without HM with 0, 1, and 2 lags, the calculated R2values of the regression were 0.7094, 0.7118, and 0.6859, respectively. WithHMwith 0,1, and2 lags, the calculated R2values of the regression were 0.6708, 0.6617, and 0.6196, respectively. We selected the strongest cor- relation (Equation (8), withoutHMand with1 week lag).
AðTn1Þ ¼0:1057 e0:1904Tn1 ð8Þ
Figure 3. The multipliers calculated and used subsequently as function of the number of months with half month interval.
Downloaded by [Ákos Bede-Fazekas] at 07:36 17 July 2013
Figure 4. Exponential correlation between camping guest nights and weekly mean temperature (T) without summer weeks.
Figure 5. Relative weekly incidence (RI) [A,B,C] and the quotient of relative weekly incidence (RI) and holiday multiplier (HM) [D,E,F] without null-values as function of the weekly mean temperature (T) and an exponential trendline (activity (A) function) with 0 [A,D], 1 [B,E], and 2 [C,F] weeks lag. Data were used from the weeks No. 1–26, when the temperature is more than 5 °C.
Downloaded by [Ákos Bede-Fazekas] at 07:36 17 July 2013
Temperature-independent activity
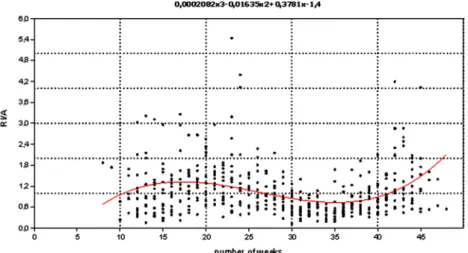
The results of the polynomial regression are given below in case of the three approaches. Equation (9) summarizes the result of the 1st approach (Figure 6), v2: 209.44; R2: 0.11;F: 20.17 (p< 0.001).
IA1ðnÞ ¼ ð1:39995Þ þ0:378123 nþ ð0:0163487Þ n2þ0:000208199 n3;
wheren is the number of the week ð9Þ
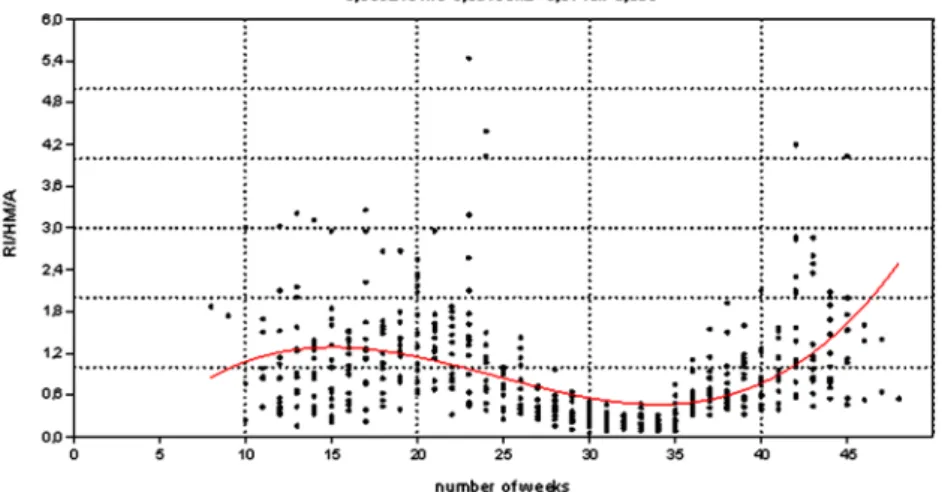
Equation (10) summarizes the result of the 2nd approach (Figure 7), v2: 213.96;
R2: 0.21;F: 42.69 (p< 0.001).
IA2ðnÞ ¼ ð1:11633Þ þ0:374321 nþ ð0:0179289Þ n2þ0:00024373 n3;
wherenis the number of the week ð10Þ
The IA1 and IA2 curves somewhat overestimate the point cloud in the summer.
Since LB incidence is the mostly inaccurately modeled in the summer period (due to the high values and the influence of non-temperature factors), a second-order regression was made separately for this period (Figure 8). Equation (11) summarizes the result of the 3rd approach,v2: 5.04;R2: 0.45; F: 60.91 (p< 0.001).
IA3ðnÞ ¼
9:11121þ ð0:542668Þ nþ0:00827928n2; ifn2 ½25;35
ð1:11633Þ þ0:374321 nþ ð0:0179289Þ n2þ0:00024373n3; ifnR½25;35 8<
:
9=
;ð11Þ where nis the number of the week
Figure 6. Quotient of relative weekly incidence (RI) and the temperature-dependent factor (A) as function of the number of weeks (n) and a third-order polynomial trendline (temperature- independent factor (IA1) function). Data were used from the continuous warm (more than 5 °C) period of the years. The quotient is bimodal with a major spring and a less important and shorter fall peak.
Downloaded by [Ákos Bede-Fazekas] at 07:36 17 July 2013
Modeling
Three different models werefitted to the curve of the observedRIand model suitability was calculated for the studied period. Thefirst approach (Figure 9) resulted in Equation (12)R2is 0.6313 and summarized absolute error is 821.06
RI1ðTn1;nÞ ¼AðTn1Þ IA1ðnÞ ð12Þ Figure 8. Quotient of relative weekly incidence (RI), the holiday multiplier (HM), and the temperature-dependent activity (A) as function of the number of weeks (n) and a second-order polynomial trendline (summer period of the temperature-independent activity (IA3) function).
Data were used from the weeks No. 25–35.
Figure 7. Quotient of relative weekly incidence (RI), the holiday multiplier (HM) and the temperature-dependent factor (A) as function of the number of weeks (n) and a third-order polynomial trendline (temperature-independent activity (IA2) function). Data were used from the continuous warm (more than 5 °C) period of the years.
Downloaded by [Ákos Bede-Fazekas] at 07:36 17 July 2013
Figure9.Observedrelativeweeklyincidence,modeledrelativeweeklyincidencebasedontheoriginaltemperature-independentactivityfunction(IA1), calculatederrorofthemodel,andcalculatedabsoluteerrorofthemodel.
Downloaded by [Ákos Bede-Fazekas] at 07:36 17 July 2013
Figure10.Observedrelativeweeklyincidence,modeledrelativeweeklyincidencebasedontheimprovedtemperature-independentactivityfunction(IA2), calculatederrorofthemodel,andcalculatedabsoluteerrorofthemodel.
Downloaded by [Ákos Bede-Fazekas] at 07:36 17 July 2013
Figure11.Observedrelativeweeklyincidence,modeledrelativeweeklyincidencebasedonthefractionaltemperature-independentactivityfunction(IA3), calculatederrorofthemodel,andcalculatedabsoluteerrorofthemodel.
Downloaded by [Ákos Bede-Fazekas] at 07:36 17 July 2013
The second approach (Figure 10) resulted in Equation (13) R2 is 0.6247 and summarized absolute error is 685.35
RI2ðTn1;nÞ ¼AðTn1Þ IA2ðnÞ ð13Þ The third approach (Figure 11) resulted in Equation (14) R2is 0.6569 and summa- rized absolute error is 774.23
RI3ðTn1;n;dÞ ¼AðTn1 IA3ðnÞÞ ð14Þ
Discussion
Our aim was not to predict the yearly LB incidence but to analyze the changing profile with special regard to the start and bimodality of the LB season. Temperature plays a very complex and controversial key role in the influencing of tick–human connection by increasing the questing activity of ticks and the human outdoor activity as well as by increasing the evaporation and cause lower relative air humidity. The latter has nega- tive effect on tick activity, but sunny and dry summer days have positive effect on human outdoor activity (Šumilo et al. 2008; Randolph 2010).
The development of theIAshowed a pronounced summer depression, maybe due to the effect of the summer drought on tick activity. After the modification of the polynomial IA curve by HM, the remaining curve is mainly exempts from the human influence. Since our model used this empirically recognized equation, the model contains indirectly some kind of correlation between tick activity and the summer environment.
Although the spirochaetae have an important role on infection chain, the tempera- ture requirements of the parasite may rather depend on the temperature of the blood meal than the ambient temperature, since the temperature optimum of B. burgdorferi parasite is between 33–37 °C (Barbour and Hayes 1986; Heroldova et al. 1998; Hubalek et al. 1998; Hubalek 2009) and the maximum temperature is 41 °C (Hubalek et al.
1998).
Although family physicians and dermatologists report the EM, the Hungarian notification system – as declared by the edict 63/1997. (XII. 21)– does not require the mandatory report of EM, the cases with (cardial, neurological, etc.) complications must be reported. The Hungarian National Center for Epidemiology (OEK) in the Epinfo issue weekly communicates the previous week’s raw LB case amount. The Hungarian LB data does not allow the differentiation between early and complicated symptoms.
The early localized infection is the 70% of the whole recognized LB cases in the USA (CDC 2012), and according to a sampling (with n= 1784) this is the same in Hungary (Lakos 1999). Therefore, major part of the reported LB cases may be EM; we handled the annual LB data with the latency characteristics of the EM. Naturally, this simplification does not allow the modeling of the nonEM cases of the year and consequently the exact modeling of the entire year.
The onset of the late disseminated infection and other LB-related complications can be much longer, months to years, than the onset of EM. According to Bacon et al.
(2008), the seasonal peak of the EM reaches its peak in July and August, while the maximum of the neurological manifestations appear in August and September in the USA. Creating the correspondence between the spring–early summer ambient mean
Downloaded by [Ákos Bede-Fazekas] at 07:36 17 July 2013
temperature and relative LB the nonEM cases influenced less the model, because of their longer latency.
There is lag between the biting and the report of a case, while there is 3–30 days (the average is between 1–2 weeks) from the biting to the observing of EM and the serology can confirm the suspect of the disease within 1 week. Note that the IgM anti- bodies have only in the first three months of the infection diagnostic value and the nonEM symptoms usually have a longer latency than EM. From the above-mentioned facts, it is difficult tofit the cases of a reporting week to the real time of the tick biting, when the individual is infected by the parasite. Searching for the spring–early summer correlation between mean temperature andRI, the one-week lag gave the best results in the model, which is in accordance with the character of the latency of the disease and the report system. It is interesting that similarly one-week lag was found in case of tick-borne encephalitis (TBE) (Daniel et al. 2008).
We used one mean ambient temperature value for entire country, because the topog- raphy of Hungary is largely homogeneous: only the 2% of the country is situated higher than 300 m above sea level, the range of the elevation is between 77.6–1014 m. The country is not bisected by mountains and entire studied area belongs to the Pannonian biogeographical region.
The domain of the grid, the climatic data were derived from, is somewhat greater than Hungary. Since the part of the Carpathian Basin situated within this domain is topographically homogenous, the difference between the domain of climatic and LB data is not significant.
As in other countries of the European Union, summer is the main time of the holidays. In Hungary, in the last decades (e.g. the studied period) the school holiday starts in mid-June and ends in the end of August. It is very conspicuous that without July and August, the camping activity (derived from the camping guest nights) is highly temperature dependent. From this fact, the human and tick activity shows a similar cor- relation from March to the end of May and from September to late October, and the holiday period from July to August form an additional risk to human infection.
Although the studied period is greater than the period of the camping data, this difference is not notable since our aim was only to determine the nature of the correla- tion of camping/human outdoor activity and temperature and to calculate the multiplica- tive effect of summer holidays.
Since we found that human activity is exponential function of temperature as well as the LB – which is determined by both the human and tick activity – distinguished use of human and tick activity could not improve the model.
Our previous assumption was that human outdoor activity has strong correlation with temperature in spring and fall. The results (Figure 2) verified our assumption. We confirmed that the irregular additional summer human activity can explain the high LB incidence in July and August, in accordance withŠumilo et al. (2008), Randolph et al.
(2008), and Estrada-Peña (2008). Since we observed that LB season is occurred between the 10th and 48th weeks of the year, applying any multiplicative effect of human activity (HM) out of this period is useless. Also, note that in case of low values of guest nights in winter calculating multiplicativeHMis inaccurate.
Atfirst inspect, it seems that the most serious insufficiency of our model is that we handle the temperature as it were the only meteorological factor influencing the inci- dence of human LB. It is well known that temperature and humidity theoretically are equally important in influencing the tick activity. In case of TBE, which has the same
Downloaded by [Ákos Bede-Fazekas] at 07:36 17 July 2013
vector as B. burgdorferi s.l. has, in the Czech Republic, a very strong correlation was found between mean ambient temperature and incidence (Daniel et al. 2008).
Using of the precipitation or humidity data of the regular meteorological stations seems to be inappropriate for characterizing the natural environment of ticks, where the evaporation, the transpiration of plants, and the penumbra create a balanced, relatively wet, windless environment with decreased solar radiation which can provide the exis- tence of dew even in a dry period. Another problem that many classic meteorological stations are positioned in subsequently urbanized areas.
We analyzed the first phase of the LB season in case of determining the tempera- ture–activity relation, because in this time, from late February to mid-June, soil mois- ture and the air humidity is high or moderate, thanks to the low evaporation and freeze of the cold season and the probable effect of the decreasing size of the still hungry, questing tick population is not too high, as the second tick activity peak in fall also shows. The other reason is that in spring, the most of the cases belong to the EM.
While, according to historical data and field collection studies, the seasonal activity of Ixodes ricinus is bimodal with a major spring (March to June) and minor fall (September to November) peak in Hungary (Babos and Faragó 1964; Széll et al. 2006;
Egyed et al. 2012), the sesonality of LB does not show bimodality in Hungary (Hornok 2009). After eliminating the human influence and the temperature-related activity from the model, we got a bimodal point cloud, which was regressed to a third-order polyno- mial curve (Figure 7). This curve shows many similarities to the observed in annual Ixodestick activity in Hungary:
(1) the curve is similar to the bimodal summarized activity of adults and nymphs;
(2) the spring–early summer peak is longer–and more important –than the fall peak;
(3) the first peak follows the known run of the activity period of nymphs, which may reflect also the spring activity of adults;
(4) the second peak is very similar to the run of the activity period of adults. Note that the newly moulted ticks of all stages are thought to emerge in the autumn of each year (Randolph 2002);
(5) the curve clearly shows the late summer depression of tick activity.
Since the input of our model was not the number offield-collectedIxodes ticks but the observed LB incidence, we could not distinguish the infection caused by adults or nymphs. The IA curve includes the climatic and nonclimatic factors which may influ- ence the LB except temperature-related human and tick activity and the multiplicative effect of holidays in summer. Since the modeled RI curves show similar run to the observed RI curve, and the calculated R2 values were relatively high, our analysis by distinguishing the temperature-dependent activity, effect of summer holiday, and temperature independent activity was proved.
Conclusion
In accordance with the literature, we found that the summer holiday has great influence on human infection with LB. Despite the fact that raw weekly LB data in Hungary seem to be unimodal, we demonstrated the bimodality of tick season known from the literature by using the originally unimodal LB data.
Downloaded by [Ákos Bede-Fazekas] at 07:36 17 July 2013
Acknowledgments
We acknowledge the E-OBS data-set from the EU-FP6 project ENSEMBLES (http://ensembles- eu.metoffice.com) and the data providers in the ECA & D project (http://www.ecad.eu). The research was supported by Project TÁMOP-4.2.1/B-09/1/KMR-2010-0005.
References
63/1997. (XII. 21). 2013 Mar 07. NM rendelet a fertőző betegségek jelentésének rendjéről.
[Regulation of the Hungarian Ministry of Public Health for the reporting procedure of com- municable diseases]. [Internet]. net.jogtar.hu/jr/gen/hjegy_doc.cgi?docid=99700063.NM. (in Hungarian).
Babos S, Faragó Á. 1964. Die Zeckenfauna Mitteleuropas. Budapest: Academic Press.
Bacon RM, Kugeler KJ, Mead PS. 2008. Surveillance for Lyme disease – United States, 1992–2006. Surveillance Summaries. 57:1–9.
Barbour AG, Hayes SF. 1986. Biology of Borrelia species. Microbiol Rev. 50:381–400.
Bozsik BP. 2004. Prevalence of Lyme borreliosis. The Lancet. 363:901.
Brewer MJ, Mather TN, Mather JR, Mather TN. 2003. Using climate predictions in tick-borne disease risk modeling. [Internet]. Available from: http://www.ofps.ucar.edu/joss_psg/meetings/cpa-wkshp.
Brownstein JS, Holford TR, Fish D. 2003. A climate-based model predicts the spatial distribution of the Lyme disease vector Ixodes scapularisin the United States. Environ Health Perspect.
111:1152–1157.
Campbell, JA. 1948. The life history and development of the sheep tick Ixodes ricinus Linnaeus in Scotland, under natural and controlled conditions [PhD thesis]. Edinburgh: University of Edinburgh.
CDC. 2012. Clinical manifestations of confirmed Lyme disease cases – United States, 2001–2010. [Internet]. [cited 2012 Apr 13]. Available from: http://www.cdc.gov/lyme/stats/
chartstables/casesbysymptom.html
Daniel M. 1993. Influence of the microclimate on the vertical distribution of the tick Ixodes rici- nus (L.) in Central Europe. Acarologia. 34:105–113.
Daniel M, Kríz B, Danielova V, Benes C. 2008. Sudden increase in tick-borne encephalitis cases in the Czech Republic, 2006. Int J Med Microbiol. 298(Suppl 1):81–87.
Egyed L, Elő P, Sréter-Lancz Z, Széll Z, Balogh Z, Sréter T. 2012. Seasonal activity and tick- borne pathogen infection rates of Ixodes ricinus ticks in Hungary. Ticks Tick Borne Dis.
3:90–94.
Estrada-Peña A. 2008. Climate, niche, ticks, and models: what they are and how we should inter- pret them. Parasitol Res. 103(Suppl 1):87–95.
Gray JS., Dautel H, Estrada-Peña A, Kahl O, Lindgren E. 2009. Effects of climate change on ticks and tick-borne diseases in Europe. Interdiscip Perspect Infect Dis. 2009. doi:10.1155/
2009/593232.
Halos L, Bord S, Cotté V, Gasqui P, Abrial D, Barnouin J, Boulouis HJ, Vayssier-Taussat M, Vourc’h G. 2010. Ecological factors characterizing the prevalence of bacterial tick-borne pathogens in Ixodes ricinus ticks in pastures and woodlands. Appl Environ Microbiol.
76:4413–4420.
Hammer O, Harper DAT, Ryan PD. 2001. PAST: Paleontological statistics software package for education and data analysis. Paleontol Electron. 4:1–9.
Hancock PA, Brackley R, Palmer SCF. 2011. Modelling the effect of temperature variation on the seasonal dynamics ofIxodes ricinustick populations. Int J Parasitol. 5:513–522.
Haylock MR, Hofstra N, Klein Tank AMG, Klok EJ, Jones PD, New M. 2008. A European daily high-resolution gridded data set of surface temperature and precipitation for 1950–2006. J Geophys Res. (Atmospheres). 113:D20119, doi: 10.1029/2008JD010201
Heroldová M, Němec M, Hubálek Z. 1998. Growth parameters of Borrelia burgdorferi sensu strictoat various temperatures. Zentralblatt für Bakteriologie. 288:451–455.
Hornok S. 2009. Allochronic seasonal peak activities of Dermacentor and Haemaphysalis spp.
under continental climate in Hungary. Vet Parasitol. 163:366–369.
Hubálek Z. 2009. Epidemiology of Lyme borreliosis. Curr Probl Dermatol. 37:31–50.
Hubálek Z, Halouzka J, Heroldová M. 1998. Growth temperature ranges of Borrelia burgdorferi sensu latostrains. J Med Microbiol. 47:929–932.
Downloaded by [Ákos Bede-Fazekas] at 07:36 17 July 2013
Kapiller Z, Szentgyörgyi L. 2001. Kullancsok és zoonózisok állatorvosoknak, orvosoknak, érdek- lődőknek. [About ticks and zoonosises for veterinarians, physicians, and inquiring people]. B +V Lap- és Könyvkiadó, Budapest (in Hungarian).
KSH (2013a): Guest nights spent in commercial accommodations per accomodation type [A kereskedelmi szálláshelyeken eltöltött vendégéjszakák szállástípusonként]. [Internet]. [cited 2013 Jan 01]. Available from: http://www.ksh.hu/docs/hun/xstadat/xstadat_evkozi/e_oga004.
html (in Hungarian).
KSH (2013b): Population [Népesség, népmozgalom]. [Internet]. [cited 2013 Jan 01]. Available from: http://www.ksh.hu/docs/hun/xstadat/xstadat_hosszu/h_wdsd001a.html (in Hungarian).
Lakos A. 1999. Az erythema migrans (EM) klinikai formái, differenciál-diagnosztikája, kezelése.
[Clinical forms, differential diagnostics and treatment of erythema migrans (EM)]. Gyerme- korvosi Figyelő. 1:80–84, (in Hungarian).
Lakos A. 1994. Lyme borreliosis. In: Nyerges G, editor. Infektológia. [Infectology]. Budapest:
Springer (in Hungarian).
Lakos A. 1992. Kullancsok és betegségek. [Ticks and diseases]. Budapest: Melania (in Hungarian).
Lakos, A. 1991. A Lyme borreliosis. Klinikai tünetek, terápia, epidemiológia, szerodiagnosztika.
[Lyme borreliosis. Clinical symptoms, therapy, epidemiology, and serodiagnostics]. Budapest:
Petit (in Hungarian).
Lipsker D, Jaulhac B. 2009. Lyme Borreliosis: biological and clinical aspects. Basel: S Karger.
OEK (2013): Országos Epidemiológiai Központ. [National Center for Epidemiology]. [Internet].
[cited 2013 Mar 01]. Available from: http://www.oek.hu (in Hungarian).
Ogden NH, Bigras-Poulin M, O’Callaghan CJ, Barker IK, Lindsay LR, Maarouf A, Smoyer- Tomic KE, Waltner-Toews D, Charron D. 2005. A dynamic population model to investigate effects of climate on geographic range and seasonality of the tick Ixodes scapularis. Int J Parasitol. 35:375–389.
Ogden NH, St-Onge L, Barker IK, Brazeau S, Bigras-Poulin M, Charron DF, Francis CM, Heagy A, Lindsay LR, Maarouf A, et al. 2008. Risk maps for range expansion of the Lyme disease vector, Ixodes scapularis, in Canada now and with climate change. Int J Health Geogr. 7:24, Doi:10.1186/1476-072X-7-24.
Ostfeld RS, Canham CD, Oggenfuss K, Winchcombe RJ, Keesing F. 2006. Climate, deer, rodents, and acorns as determinants of variation in Lyme-disease risk. PLoS Biol. 4:e145.
Perret JL, Guerin PM, Diehl PA, Vlimant M, Gern L. 2003. Darkness induces mobility, and satu- ration deficit limits questing duration, in the tick, Ixodes ricinus. J Exp Biol. 206:1809–1815.
Perret JL, Guigoz E, Rais O, Gern L. 2000. Influence of saturation deficit and temperature on Ixodes ricinus tick questing activity in a Lyme borreliosis-endemic area (Switzerland). Parasi- tol Res. 86:554–557.
Randolph SE. 2010. Human activities predominate in determining changing incidence of tick- borne encephalitis in Europe. EDEN-TBD sub-project team. Euro Surveill. 15:24–31.
Randolph SE. 2009. Epidemiological consequences of the ecological physiology of ticks.
Advances in Insect Physiology. 37:297–339.
Randolph SE. 2002. Quantitative ecology of ticks as a basis for transmission models of tick-borne pathogens. Vector Borne Zoonotic Dis. 2:209–215.
Randolph SE, Rogers DJ. 2000. Fragile transmission cycles of tick-borne encephalitis virus may be disrupted by predicted climate change. Proc R Soc Lond B Biol Sci. 267:1741–1744.
Randolph SE, Asokliene L, Avsic-Zupanc T, Bormane A, Burri C, Gern L, Žygutiene M. 2008.
Variable spikes in tick-borne encephalitis incidence in 2006 independent of variable tick abun- dance but related to weather. Parasites Vectors. 1:44.
Schauber EM, Ostfeld RS, Evans AS, Jr. 2005. What is the best predictor of annual Lyme disease incidence: Weather, mice, or acorns? Ecol Appl. 15:575–586.
Schulze TL, Jordan RA, Schulze CJ, Hung RW. 2009. Precipitation and temperature as predictors of the local abundance of Ixodes scapularis (Acari: Ixodidae) nymphs. J Med Entomol.
46:1025–1029.
Steere AC. 2008. Lyme Borreliosis. In: Kasper DL, Braunwald E, Fauci AS, Hauser SL, Longo DL, Jameson JL, Loscalzo J, editors. Harrison’s principles of internal medicine. New York (NY): McGraw-Hill Medical Publishing.
Subak S. 2003. Effects of climate on variability in Lyme disease incidence in the northeastern United States. Am J Epidemiol. 157:531–538.
Downloaded by [Ákos Bede-Fazekas] at 07:36 17 July 2013
Šumilo D, Asokliene L, Avsic-Zupanc T, Bormane A, Vasilenko V, Lucenko I, Golovljova I, Randolph SE. 2008. Behavioural responses to perceived risk of tick-borne encephalitis: vacci- nation and avoidance in the Baltics and Slovenia. Vaccine. 26:2580–2588.
Széll Z, Sréter-Lancz Z, Márialigeti K, Sréter T. 2006. Temporal distribution of Ixodes ricinus, dermacentor reticulatus and haemaphysalis concinna in Hungary. Vet Parasitol. 141:377–379.
Tagliapietra V, Rosà R, Arnoldi D, Cagnacci F, Capelli G, Montarsi F, Rizzoli A. 2011. Saturation deficit and deer density affect questing activity and local abundance ofIxodes ricinus(Acari, Ixodidae) in Italy. Vet Parasitol. 183:114.
Wu X, Duvvuri VR, Lou Y, Ogden NH, Pelcat Y, Wu J. 2013. Developing a temperature-driven map of the basic reproductive number of the emerging tick vector of Lyme disease Ixodes scapularis in Canada. J Theor Biol. 319:50–61.
Downloaded by [Ákos Bede-Fazekas] at 07:36 17 July 2013
![Figure 5. Relative weekly incidence (RI ) [A,B,C] and the quotient of relative weekly incidence (RI ) and holiday multiplier (HM ) [D,E,F] without null-values as function of the weekly mean temperature (T ) and an exponential trendline (activity (A) functi](https://thumb-eu.123doks.com/thumbv2/9dokorg/929594.53027/9.739.98.646.399.871/relative-incidence-quotient-incidence-multiplier-temperature-exponential-trendline.webp)