water
Article
Morphological Evolution of the Lower Tisza River (Hungary) in the 20th Century in Response to
Human Interventions
Gabriel J. Amissah1, Tímea Kiss1,* and Károly Fiala2
1 Department of Physical Geography and Geoinformatics, University of Szeged, Egyetem u. 2–6, 6722 Szeged, Hungary; gabbyjonad@yahoo.com
2 Lower Tisza District Water Directorate, Stefánia 4, 6720 Szeged, Hungary; fialak@ativizig.hu
* Correspondence: kisstimi@gmail.com; Tel.: +36-62-544-545
Received: 10 May 2018; Accepted: 28 June 2018; Published: 2 July 2018
Abstract:To understand the hydro-morphological responses of a river to engineering works is a key to future sustainable engineering projects. The Tisza River in the Carpathian Basin has been the subject of human interventions in the 19th–20th centuries, with regular monitoring since the first intervention.
Therefore, it provides a unique opportunity to understand the long-term responses of a lowland river on engineering works. Here the interventions include the construction of embanked levees, artificial meander cutoffs, construction of revetments and groynes, and construction of lock-dams, whose differing effects can be analysed in detail. The Lower Tisza River, Hungary was shortened by up to a third of its 89-km length during late-19th-century regulation works. Simultaneously, it was disconnected from its 10–20 km wide natural floodplain, which was restricted to 1–5 km.
Revetments were constructed along 25% of the banks since the early 20th century. This paper evaluates the effects of these regulation works on the Lower Tisza channel based on channel-surveys (1891, 1931, 1961, 1976 and 1999). Based on the results, the channel responded to every stage of the regulation works by adjusting its cross-sectional area, thalweg depth and bankfull width. From 1891 to 1961, the cross-sectional area of the channel increased in response to the artificial meander cutoffs through rapid incision and channel widening. The construction of revetments and groynes distorted this morphological development. After their construction, the cross-sectional area of the channel reduced by up to 50% between 1961 and 1976. The channel experienced incision and narrowing within this period. Whilst the morphological response of the river to cutoffs was improved flood conveyance, the revetments drastically decreased the flood conveyance; therefore, the flood levels increased without an increase in discharge, so the revetment constructions indirectly increased the flood risk.
Keywords:human intervention; channel cross-sectional area; artificial cutoffs; meanders; revetments
1. Introduction
Rivers as natural systems of varying forms and sizes have been responsible for shaping the Earth’s landscapes [1,2]. Rivers in their natural states develop towards equilibrium. However, external forces such as climate change [3–8] or human intervention [1,5,9–13] tend to create conditions of disequilibrium. The impact of climate change on rivers and river systems has been widely investigated in recent decades [8,14–19]. Likewise, several studies have been conducted on the various human impacts on rivers [20–28]. The distortion of the fluvial forms in relation to the abovementioned parameters could be connected to the interplay of bed topography, flow field and sediment transport, and anthropogenic changes in channel morphology [11,29–32].
Water2018,10, 884; doi:10.3390/w10070884 www.mdpi.com/journal/water
Water2018,10, 884 2 of 20
In various parts of the world, including Hungary, rivers have been subjected to various forms of human interventions, which can be classified as either direct or indirect depending on the scope of impact. Indirect human impacts are usually basin-scale and mostly alter the run-off and sediment yield, while the direct impacts are in-channel constructions that influence the channel itself. The indirect human impacts include urbanization and land drainage [12,33,34], agriculture [33,34], removal of forest cover, and changes in land use and management [5,12,25–36].
The direct human impacts, on the other hand, include dam/reservoir construction [10,37–40], artificial meander cutoffs [24,40], channelization [37,40–43], water extraction [34,41], in-channel mining activities [37,39,42,44], construction of levees [45,46], construction of groynes and revetments [40,45], removal of riparian vegetation [47], urbanization and land use changes [48,49], and flow regulation and diversion [43]. These human interventions have had various impacts on both the short-term and long-term morphological evolution of rivers and their basins [25,39,50–57]. Some studies have even shown that the changes in the river channel affect riparian vegetation [58,59]. Almost all rivers of the world are altered to some degree by humans; it is therefore important to investigate the effects of these anthropogenic impacts to support sustainable river engineering and management schemes or the future [60].
Although the morphological changes of some short sections of the Tisza River have been investigated [23,61,62], none of them studied the temporal and spatial variations of longer channel sections, thus they could not reveal spatial connections between the parametric changes. Therefore, in the present study, we aimed to analyse the channel morphology of the 89-km-long Lower Tisza River between 1891 and 1999 (108 years). Our goals included the following: (1) to assess the temporal and spatial morphological evolution of the channel; (2) to assess the impact of the meanders on the channel’s evolution; (3) to assess the impact of the artificial meander cutoffs on the channel’s evolution; (4) to assess the effects of the construction of revetments on the channel; and (5) to develop a conceptual model of the morphological evolution of channel cross-sectional area focusing on the roles of the bankfull width and thalweg depth.
2. Study Area
2.1. Physical Setting
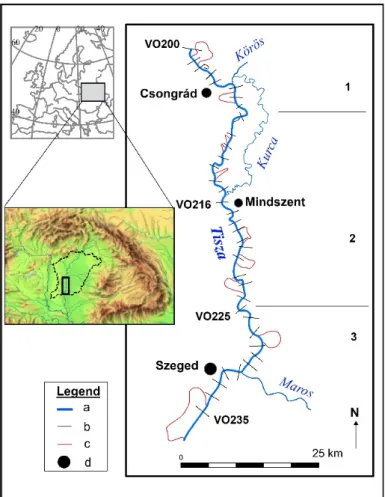
The Tisza River (total catchment area: 157,200 km2, length: 962 km; [63]) is the main tributary of the Danube River in Hungary. With its source in the northeastern Carpathian Mountains, it drains the eastern part of the Carpathian Basin, flowing through the Great Hungarian Plain. The Hungarian section of the Tisza (A: 47,000 km2, L: 596 km,) is divided into three segments: the Upper Tisza, the Middle Tisza and the Lower Tisza. The studied Lower Tisza River (Figure1) stretches from upstream of Csongrád (255 f.km) to the Hungarian–Serbian border (166 f.km). Based on the degree of human impact and the morphological characteristics, we evaluated the study segment by dividing it into three reaches.
Along the Lower Tisza the pre-regulation slope (2.2 cm/km) was increased to 2.9 cm/km by artificial cutoffs. Nowadays, the slope decreases, as the mean slope is only 1.5 cm/km, (with a range of 0.3–3.5 cm/km; [64]). The Maros River, which is the major tributary of the Tisza, has a high slope (13 cm/km) in its lowland segment, and downstream of their confluence at Szeged the slope of the Tisza increases to 6 cm/km [23,65]. The Tisza in Hungary has a typical lowland river character, as it transports large amount of fine-grained sandy and silty suspended sediment (18.7 million t/y). It has a relatively lower bedload transport (9000 t/y), with a clayey bed material [61,63,65,66].
Water2018,10, 884 3 of 20
Water 2018, 10, x FOR PEER REVIEW 3 of 19
Figure 1. Location of studied Lower Tisza River within the Carpathian Basin. The study area was divided into three reaches (1-upper; 2-middle; and 3-lower) based on the morphology of the channel.
a: channel, b: studied cross sections (VO 200-235), c: cutoffs, and d: major towns.
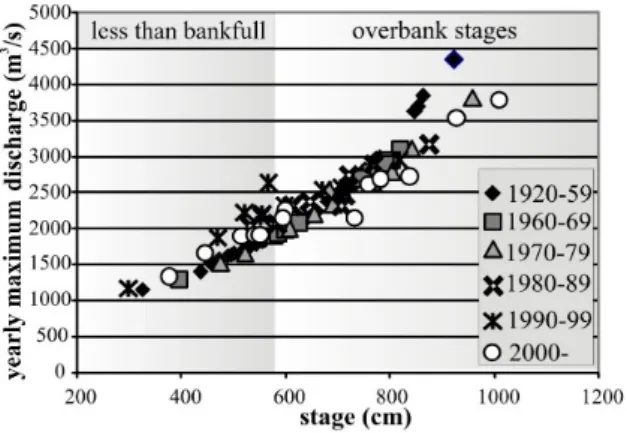
On the Tisza, two major floods usually occur. The first flood (March–April) is caused by snow melt, and if the snowmelt is combined with rainfall extremely large floods could develop. The second flood occurs during the summer (June), induced by the early summer rainfall. As the lowland section of the river is long, and its slope is low (1.0–3.5 cm/km), this summer flood sometimes superimposes on the preceding spring flood, and thus record high floods could develop. The absolute water level change between the highest and lowest water stages is 1355 cm at Mindszent (highest stage measured in 2006: 1062 cm; lowest stage measured in 1968: −293 cm), and 1184 cm at Szeged (highest stage measured in 2006: 960 cm; lowest stage measured in 1968: −224 cm; Figure 2). The discharge also shows considerable hydrological variations. At Szeged, the maximum discharge is 4348 m3/s (in 1932) and the minimum value is 58 m3/s (in 2013; [62,64]). The yearly maximum discharge values and the corresponding water stages at Szeged (Figure 3) not clearly related, and they indicate special channel processes. In case of stages lower than the bankfull level, the discharge values increased, as at the beginning of the measurements (1920–1959) 550–600 cm stages had ca. 1750 m3/s discharge, but later the discharge values of the same stage interval increased, referring to incision. However, in the 21st century this process seems to be abated. On the contrary, the discharge of the overbank flood levels dropped, indicating a decrease inthe flood conveyance: at the beginning of the measurements, record high floods (800–900 cm) produced a large discharge (over 3500 m3/s), but nowadays, even though the floods have only 2500–3700 m3/s discharge, the recorded flood levels increased (over 1000 cm).
Figure 1. Location of studied Lower Tisza River within the Carpathian Basin. The study area was divided into three reaches (1-upper; 2-middle; and 3-lower) based on the morphology of the channel.
a: channel, b: studied cross sections (VO 200-235), c: cutoffs, and d: major towns.
On the Tisza, two major floods usually occur. The first flood (March–April) is caused by snow melt, and if the snowmelt is combined with rainfall extremely large floods could develop. The second flood occurs during the summer (June), induced by the early summer rainfall. As the lowland section of the river is long, and its slope is low (1.0–3.5 cm/km), this summer flood sometimes superimposes on the preceding spring flood, and thus record high floods could develop. The absolute water level change between the highest and lowest water stages is 1355 cm at Mindszent (highest stage measured in 2006:
1062 cm; lowest stage measured in 1968:−293 cm), and 1184 cm at Szeged (highest stage measured in 2006: 960 cm; lowest stage measured in 1968: −224 cm; Figure2). The discharge also shows considerable hydrological variations. At Szeged, the maximum discharge is 4348 m3/s (in 1932) and the minimum value is 58 m3/s (in 2013; [62,64]). The yearly maximum discharge values and the corresponding water stages at Szeged (Figure3) not clearly related, and they indicate special channel processes. In case of stages lower than the bankfull level, the discharge values increased, as at the beginning of the measurements (1920–1959) 550–600 cm stages had ca. 1750 m3/s discharge, but later the discharge values of the same stage interval increased, referring to incision. However, in the 21st century this process seems to be abated. On the contrary, the discharge of the overbank flood levels dropped, indicating a decrease in the flood conveyance: at the beginning of the measurements, record high floods (800–900 cm) produced a large discharge (over 3500 m3/s), but nowadays, even though the floods have only 2500–3700 m3/s discharge, the recorded flood levels increased (over 1000 cm).
Water2018,10, 884 4 of 20
Water 2018, 10, x FOR PEER REVIEW 4 of 19
Figure 2. Yearly maximum, mean and minimum water stages (cm) measured at Mindszent gauging station, in the middle reach of the study area. The “0” point of the fluviometer was set arbitrarily in the 1840s based on the lowest observed stage at that time. (Data source: Lower Tisza Water Directorate [ATIVIZIG].)
Figure 3. Yearly maximum discharge values and the measured water stage at the same day at Szeged gauging station (data source: ATIVIZIG).
2.2. Regulation Works
The late 19th century marked the beginning of catchment-scale engineering interventions on the Tisza River. They involved the disconnection of the Tisza from its alluvial wetlands by construction of embanked levees. This flood control levee system is 2940 km long and was constructed with the aim of protecting the land from inundation, providing safe areas for agriculture, and decreasing the duration of floods [67,68]. Simultaneously, the river was shortened by 38% with 114 artificial meander cutoffs [69,70]. As a result of cutoffs, the meandering equilibrium river was transformed into an in- growing meandering one, as its slope almost doubled. With an increased sediment load, there was accelerated deposition on the confined active floodplains [46,71].
The regulation works in the 20th century continued with the construction of revetments and groynes. Revetments were built to stop the lateral erosion of bends that migrated too close to artificial levees, whilst the groynes facilitated shipping by tightening wide sections and training sharp bends in order to improve the flood conductivity of the river channel. In total 44% of the banks of the Tisza River were stabilized, mainly between the 1930s and 1960s. However, these works started in 1886, whilst the latest revetment was built in 2016.
The second half of the 20th century was a period of dam construction on the Tisza and its tributaries. On the Tisza, three dams (which operate as locks) were built at Tiszalök (1957) and Kisköre (1973) in Hungary, and Törökbecse/Novi Becsej (1976) in Serbia [72]. The locks were built to impound the water during low stages, thus water withdrawal for irrigation could be secured, but they also produce hydropower and aid navigation. Although they are opened during floods, the retention of sediments by the dams creates a temporal sediment deficit downstream that induces incision [23,62].
Figure 2.Yearly maximum, mean and minimum water stages (cm) measured at Mindszent gauging station, in the middle reach of the study area. The “0” point of the fluviometer was set arbitrarily in the 1840s based on the lowest observed stage at that time. (Data source: Lower Tisza Water Directorate [ATIVIZIG]).
Water 2018, 10, x FOR PEER REVIEW 4 of 19
Figure 2. Yearly maximum, mean and minimum water stages (cm) measured at Mindszent gauging station, in the middle reach of the study area. The “0” point of the fluviometer was set arbitrarily in the 1840s based on the lowest observed stage at that time. (Data source: Lower Tisza Water Directorate [ATIVIZIG].)
Figure 3. Yearly maximum discharge values and the measured water stage at the same day at Szeged gauging station (data source: ATIVIZIG).
2.2. Regulation Works
The late 19th century marked the beginning of catchment-scale engineering interventions on the Tisza River. They involved the disconnection of the Tisza from its alluvial wetlands by construction of embanked levees. This flood control levee system is 2940 km long and was constructed with the aim of protecting the land from inundation, providing safe areas for agriculture, and decreasing the duration of floods [67,68]. Simultaneously, the river was shortened by 38% with 114 artificial meander cutoffs [69,70]. As a result of cutoffs, the meandering equilibrium river was transformed into an in- growing meandering one, as its slope almost doubled. With an increased sediment load, there was accelerated deposition on the confined active floodplains [46,71].
The regulation works in the 20th century continued with the construction of revetments and groynes. Revetments were built to stop the lateral erosion of bends that migrated too close to artificial levees, whilst the groynes facilitated shipping by tightening wide sections and training sharp bends in order to improve the flood conductivity of the river channel. In total 44% of the banks of the Tisza River were stabilized, mainly between the 1930s and 1960s. However, these works started in 1886, whilst the latest revetment was built in 2016.
The second half of the 20th century was a period of dam construction on the Tisza and its tributaries. On the Tisza, three dams (which operate as locks) were built at Tiszalök (1957) and Kisköre (1973) in Hungary, and Törökbecse/Novi Becsej (1976) in Serbia [72]. The locks were built to impound the water during low stages, thus water withdrawal for irrigation could be secured, but they also produce hydropower and aid navigation. Although they are opened during floods, the retention of sediments by the dams creates a temporal sediment deficit downstream that induces incision [23,62].
Figure 3.Yearly maximum discharge values and the measured water stage at the same day at Szeged gauging station (data source: ATIVIZIG).
2.2. Regulation Works
The late 19th century marked the beginning of catchment-scale engineering interventions on the Tisza River. They involved the disconnection of the Tisza from its alluvial wetlands by construction of embanked levees. This flood control levee system is 2940 km long and was constructed with the aim of protecting the land from inundation, providing safe areas for agriculture, and decreasing the duration of floods [67,68]. Simultaneously, the river was shortened by 38% with 114 artificial meander cutoffs [69,70]. As a result of cutoffs, the meandering equilibrium river was transformed into an in-growing meandering one, as its slope almost doubled. With an increased sediment load, there was accelerated deposition on the confined active floodplains [46,71].
The regulation works in the 20th century continued with the construction of revetments and groynes. Revetments were built to stop the lateral erosion of bends that migrated too close to artificial levees, whilst the groynes facilitated shipping by tightening wide sections and training sharp bends in order to improve the flood conductivity of the river channel. In total 44% of the banks of the Tisza River were stabilized, mainly between the 1930s and 1960s. However, these works started in 1886, whilst the latest revetment was built in 2016.
The second half of the 20th century was a period of dam construction on the Tisza and its tributaries. On the Tisza, three dams (which operate as locks) were built at Tiszalök (1957) and Kisköre (1973) in Hungary, and Törökbecse/Novi Becsej (1976) in Serbia [72]. The locks were built to impound the water during low stages, thus water withdrawal for irrigation could be secured, but they also produce hydropower and aid navigation. Although they are opened during floods, the retention of sediments by the dams creates a temporal sediment deficit downstream that induces incision [23,62].
Water2018,10, 884 5 of 20
Along the studied Lower Tisza, the channel regulations started in 1855, shortening the originally 131 km long studied river segment by more than 40 km, cutting off 12 meanders [23,28]. The originally 6–8 km wide natural floodplain was reduced to 1 km on average. At Szeged, however, the floodplain is just 400 m wide, thus the artificial levees constricted the floodplain at some sections quite drastically, thereby reducing its flood conductivity and increasing the flood risk. Therefore, the height of the embanked levees increased severalfold, in keeping with the increasing height of floods. Thus, originally they were just 2.3–3.0 m high, but nowadays their height is 7.0 m, so they could provide safety despite the increasing flood levels [23,61,62,70]. In the Lower Tisza, 25% of the banks are protected by revetments, but their spatial distribution is irregular, as indicated by the different revetment density of the studied reaches (Table1).
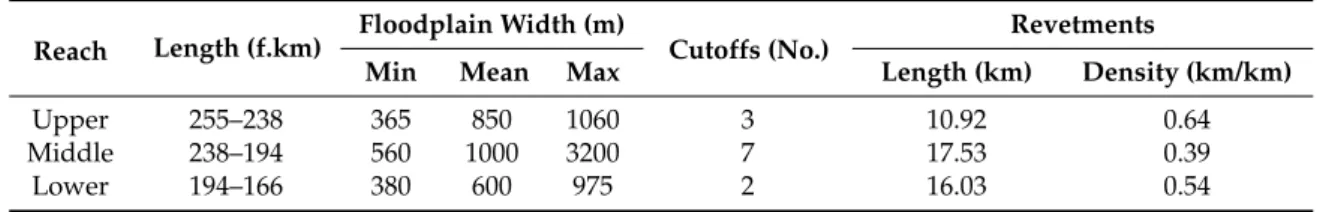
Table 1.Main characteristics of the three river reaches evaluated in this study.
Reach Length (f.km) Floodplain Width (m)
Cutoffs (No.) Revetments
Min Mean Max Length (km) Density (km/km)
Upper 255–238 365 850 1060 3 10.92 0.64
Middle 238–194 560 1000 3200 7 17.53 0.39
Lower 194–166 380 600 975 2 16.03 0.54
3. Materials and Methods
A dataset of the hydrological surveys of cross-sectional area profiles as well as the spatial data of cutoffs and revetments of the Lower Tisza River were provided by the Lower Tisza Water Directorate (ATIVIZIG). The Hydrological Atlas of the Lower Tisza (1974) provides maps on the channel showing the banklines (1891, 1931 and 1976), the locations of the surveyed cross sections and revetments. Channel surveys were made in 1891, 1931, 1961, 1976 and 1999, using fixed geodetic points (known as VO points) established in 1890–91. The cross sections located at approximate 2.5 km intervals. During the surveys of cross section elevation (for the near-bank area), depth measurements (for the wetted channel) were made at 5.0 m intervals. Based on the measurements, the relative depths measured from the bankfull level were used in analysing the characteristics of the cross sections.
For a typical cross section in this present study (Figure4), the bankfull level was determined from the lower bankline. From the relative depths obtained, the thalweg depth (deepest point measured from bankfull level) and mean depth (arithmetic mean of all depth data of a cross section) were determined. Besides these, we calculated the cross-sectional area (area of cross section up to the bankfull level), the bankfull width (width of cross section at the bankfull level) and the mean width (ratio of cross-sectional area to thalweg depth).
Water 2018, 10, x FOR PEER REVIEW 5 of 19
Along the studied Lower Tisza, the channel regulations started in 1855, shortening the originally 131 km long studied river segment by more than 40 km, cutting off 12 meanders [23,28]. The originally 6–8 km wide natural floodplain was reduced to 1 km on average. At Szeged, however, the floodplain is just 400 m wide, thus the artificial levees constricted the floodplain at some sections quite drastically, thereby reducing its flood conductivity and increasing the flood risk. Therefore, the height of the embanked levees increased severalfold, in keeping with the increasing height of floods.
Thus, originally they were just 2.3–3.0 m high, but nowadays their height is 7.0 m, so they could provide safety despite the increasing flood levels [23,61,62,70]. In the Lower Tisza, 25% of the banks are protected by revetments, but their spatial distribution is irregular, as indicated by the different revetment density of the studied reaches (Table 1).
Table 1. Main characteristics of the three river reaches evaluated in this study.
Reach Length (f.km) Floodplain Width (m)
Cutoffs (No.) Revetments
Min Mean Max Length (km) Density (km/km)
Upper 255–238 365 850 1060 3 10.92 0.64
Middle 238–194 560 1000 3200 7 17.53 0.39
Lower 194–166 380 600 975 2 16.03 0.54
3. Materials and Methods
A dataset of the hydrological surveys of cross-sectional area profiles as well as the spatial data of cutoffs and revetments of the Lower Tisza River were provided by the Lower Tisza Water Directorate (ATIVIZIG). The Hydrological Atlas of the Lower Tisza (1974) provides maps on the channel showing the banklines (1891, 1931 and 1976), the locations of the surveyed cross sections and revetments. Channel surveys were made in 1891, 1931, 1961, 1976 and 1999, using fixed geodetic points (known as VO points) established in 1890–91. The cross sections located at approximate 2.5 km intervals. During the surveys of cross section elevation (for the near-bank area), depth measurements (for the wetted channel) were made at 5.0 m intervals. Based on the measurements, the relative depths measured from the bankfull level were used in analysing the characteristics of the cross sections.
For a typical cross section in this present study (Figure 4), the bankfull level was determined from the lower bankline. From the relative depths obtained, the thalweg depth (deepest point measured from bankfull level) and mean depth (arithmetic mean of all depth data of a cross section) were determined. Besides these, we calculated the cross-sectional area (area of cross section up to the bankfull level), the bankfull width (width of cross section at the bankfull level) and the mean width (ratio of cross-sectional area to thalweg depth).
Figure 4. A typical cross section showing bankfull level, bankfull width and thalweg depth.
Figure 4.A typical cross section showing bankfull level, bankfull width and thalweg depth.
Water2018,10, 884 6 of 20
The entire length of the river was dissected into bends or meanders based on Laczay’s classification [73], for which the sinuosity of every segment was calculated between two inflection points (midpoint of straight sections) as the ratio of the bend length of the segment to the chord length (length of straight line joining inflection points). All segments with sinuosity values below 1.1 were classified as bends while those with sinuosity values greater than 1.1 were classified as meanders.
The classification was applied because the thalweg is deeper and closer to the outer banks in case of meanders, thus the meanders and their cross sections can change more than the bends [1]. Then the cross sections were classified based on the sinuosity of the channel (location in meanders or bends) and type of human intervention directly affecting the cross-sectional profile (Figure5)
Water 2018, 10, x FOR PEER REVIEW 6 of 19
The entire length of the river was dissected into bends or meanders based on Laczay’s classification [73], for which the sinuosity of every segment was calculated between two inflection points (midpoint of straight sections) as the ratio of the bend length of the segment to the chord length (length of straight line joining inflection points). All segments with sinuosity values below 1.1 were classified as bends while those with sinuosity values greater than 1.1 were classified as meanders.
The classification was applied because the thalweg is deeper and closer to the outer banks in case of meanders, thus the meanders and their cross sections can change more than the bends [1]. Then the cross sections were classified based on the sinuosity of the channel (location in meanders or bends) and type of human intervention directly affecting the cross-sectional profile (Figure 5)
Figure 5. The main morphological characteristics of the studied cross sections. The VO refers to the registered number of the cross section.
4. Results
4.1. Changes in Vertical Channel Parameters
To analyse the vertical channel changes, first the cross-sectional area values of the whole studied river segment was evaluated, and then the upper, middle and lower reaches were analysed in detail (Figure 6).
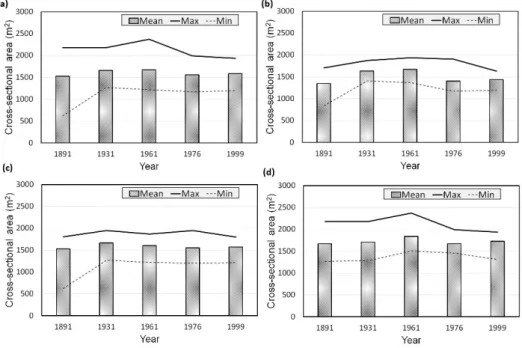
Figure 6. Characteristic cross-sectional area values of (a) entire studied segment, (b) upper reach, (c) middle reach, and (d) lower reach (d). The values are based on the channel surveys made in 1891, 1931, 1961, 1976 and 1999.
Figure 5.The main morphological characteristics of the studied cross sections. The VO refers to the registered number of the cross section.
4. Results
4.1. Changes in Vertical Channel Parameters
To analyse the vertical channel changes, first the cross-sectional area values of the whole studied river segment was evaluated, and then the upper, middle and lower reaches were analysed in detail (Figure6).
Water 2018, 10, x FOR PEER REVIEW 6 of 19
The entire length of the river was dissected into bends or meanders based on Laczay’s classification [73], for which the sinuosity of every segment was calculated between two inflection points (midpoint of straight sections) as the ratio of the bend length of the segment to the chord length (length of straight line joining inflection points). All segments with sinuosity values below 1.1 were classified as bends while those with sinuosity values greater than 1.1 were classified as meanders.
The classification was applied because the thalweg is deeper and closer to the outer banks in case of meanders, thus the meanders and their cross sections can change more than the bends [1]. Then the cross sections were classified based on the sinuosity of the channel (location in meanders or bends) and type of human intervention directly affecting the cross-sectional profile (Figure 5)
Figure 5. The main morphological characteristics of the studied cross sections. The VO refers to the registered number of the cross section.
4. Results
4.1. Changes in Vertical Channel Parameters
To analyse the vertical channel changes, first the cross-sectional area values of the whole studied river segment was evaluated, and then the upper, middle and lower reaches were analysed in detail (Figure 6).
Figure 6. Characteristic cross-sectional area values of (a) entire studied segment, (b) upper reach, (c) middle reach, and (d) lower reach (d). The values are based on the channel surveys made in 1891, 1931, 1961, 1976 and 1999.
Figure 6. Characteristic cross-sectional area values of (a) entire studied segment, (b) upper reach, (c) middle reach, and (d) lower reach (d). The values are based on the channel surveys made in 1891, 1931, 1961, 1976 and 1999.
Water2018,10, 884 7 of 20
The mean cross-sectional area of the entire studied segment was 1530 m2 in 1891, and then increased until 1961 (1672 m2), but later it decreased until 1976 (1557 m2), and finally it increased again between 1976 and 1999 (1586 m2). Similar changes occurred within the upper reach and the lower reach, although the magnitudes of change varied. In the middle reach however, the trend of the changes was different: the mean cross-sectional channel area also started to increase after 1891 but it started to decline earlier (1931–1976), and finally in the last period (1976–1999), the channel cross-sectional area increased similarly to the other reaches. The maximum and minimum values of the cross-sectional area however spatially differed. The minimum values (1891: 620 m2; 1931: 1268 m2; 1961: 1218 m2; 1976: 1668 m2; and 1999: 1194 m2) were always in the middle reach, while the maximum values (1891: 2177 m2; 1931: 2176 m2; 1961: 2374 m2; 1976: 1990 m2; and 1999: 1936 m2) appeared in the lower reach.
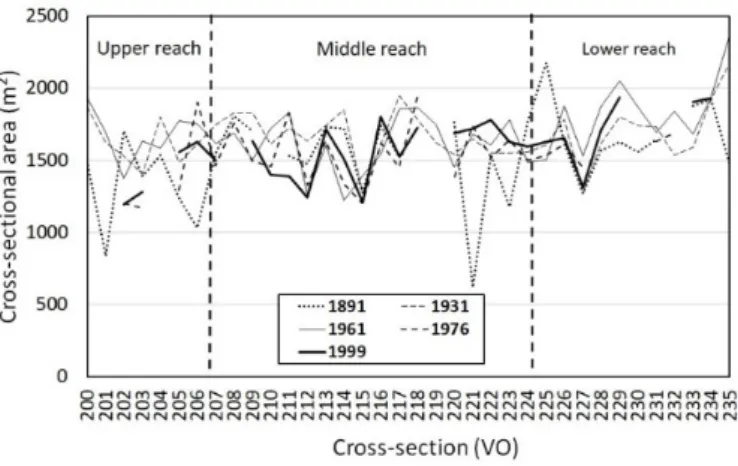
The spatial (downstream) changes in the cross-sectional area were also studied in detail (Figure7).
Some cross-sections only slightly changed between 1891 and 1999, as the change in cross-sectional area was less than 0.5% at certain locations (VO217 and VO234), whilst others had considerable changes, e.g., in case of VO221 the changes were as high as 177%. The greatest variation in the cross-sectional area occurred within the middle reach. A general downstream trend is also visible, as in the upper reach in 1891 the cross-sectional areas were less than 1500 m2, whilst in the same period the lower reach always had higher values than 1500 m2. However, abrupt changes in cross-sectional area by neighbouring survey sites appeared in each survey period, referring to local influencing factors.
Water 2018, 10, x FOR PEER REVIEW 7 of 19
The mean cross-sectional area of the entire studied segment was 1530 m2 in 1891, and then increased until 1961 (1672 m2), but later it decreased until 1976 (1557 m2), and finally it increased again between 1976 and 1999 (1586 m2). Similar changes occurred within the upper reach and the lower reach, although the magnitudes of change varied. In the middle reach however, the trend of the changes was different: the mean cross-sectional channel area also started to increase after 1891 but it started to decline earlier (1931–1976), and finally in the last period (1976–1999), the channel cross- sectional area increased similarly to the other reaches. The maximum and minimum values of the cross-sectional area however spatially differed. The minimum values (1891: 620 m2; 1931: 1268 m2; 1961: 1218 m2; 1976: 1668 m2; and 1999: 1194 m2) were always in the middle reach, while the maximum values (1891: 2177 m2; 1931: 2176 m2; 1961: 2374 m2; 1976: 1990 m2; and 1999: 1936 m2) appeared in the lower reach.
The spatial (downstream) changes in the cross-sectional area were also studied in detail (Figure 7). Some cross-sections only slightly changed between 1891 and 1999, as the change in cross-sectional area was less than 0.5% at certain locations (VO217 and VO234), whilst others had considerable changes, e.g., in case of VO221 the changes were as high as 177%. The greatest variation in the cross- sectional area occurred within the middle reach. A general downstream trend is also visible, as in the upper reach in 1891 the cross-sectional areas were less than 1500 m2, whilst in the same period the lower reach always had higher values than 1500 m2. However, abrupt changes in cross-sectional area by neighbouring survey sites appeared in each survey period, referring to local influencing factors.
Figure 7. Variation of cross-sectional area along the river for 1891, 1931, 1961, 1976 and 1999.
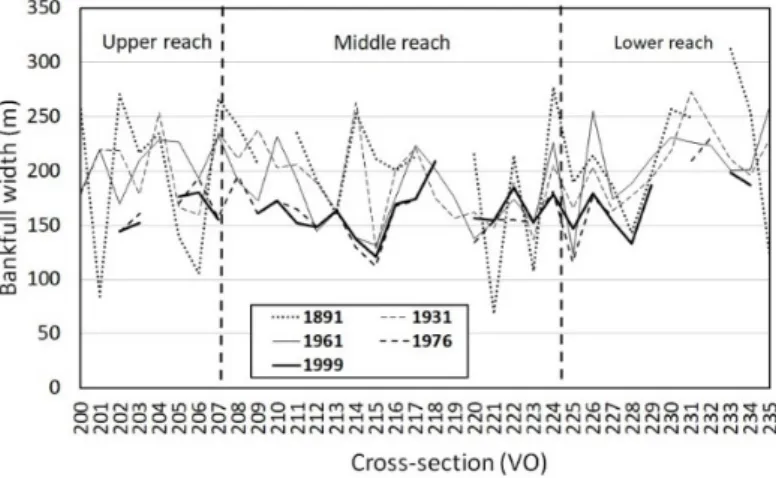
The changes in cross-sectional area could be influenced by such vertical channel parameters as bankfull width and mean thalweg depth. Along the studied segment of the Tisza River, the bankfull width continuously decreased throughout all the survey years (Figure 8). While in 1891 the mean bankfull width of the channel was 203 m, by 1999 it had reduced by 39 m, so the mean channel narrowing was 36 cm/y. Between the surveys, the bankfull width reduction was similar (0.12–0.16 m/y), though between 1961–1976 it accelerated to 1.17 m/y. At the downstream end of the middle reach (VO221) the channel became wider by 125%. The greatest narrowing characterized the upper reach (46% at VO202; and 42% at VO203) and the upstream parts of the middle reach (46% at VO214;
and 43% at VO 215).
The thalweg depth also showed variation along the studied segment (Figure 9). During the studied 108 years, the mean thalweg depth of the entire studied segment increased from 12.2 m to 14.1 m, indicating 1.9 m incision on average (1.7 cm/y). In this process, similarly to the width changes, the period of 1961–1976 was characterised by a slight aggradation of channel bed, as the mean thalweg depth decreased from 13.8 m to 13.5 m. The minimum and maximum rates of incision occurred in 1961–1976 (0.6 cm/y) and 1976–1999 (2.4 cm/y) respectively. Considering downstream changes, no obvious trend was revealed, as the average change in the mean thalweg depth was 18.7%
in the upper reach, the greatest increase (19.5%) was measured in the middle reach, whilst only a 16.8% increase in thalweg depth was found in the lower reach over the study period. The greatest incision occurred at the boundaries of the reaches (63% for VO207; 52% for VO 244; and 48% for
Figure 7.Variation of cross-sectional area along the river for 1891, 1931, 1961, 1976 and 1999.
The changes in cross-sectional area could be influenced by such vertical channel parameters as bankfull width and mean thalweg depth. Along the studied segment of the Tisza River, the bankfull width continuously decreased throughout all the survey years (Figure 8). While in 1891 the mean bankfull width of the channel was 203 m, by 1999 it had reduced by 39 m, so the mean channel narrowing was 36 cm/y. Between the surveys, the bankfull width reduction was similar (0.12–0.16 m/y), though between 1961–1976 it accelerated to 1.17 m/y. At the downstream end of the middle reach (VO221) the channel became wider by 125%. The greatest narrowing characterized the upper reach (46% at VO202; and 42% at VO203) and the upstream parts of the middle reach (46% at VO214; and 43% at VO 215).
The thalweg depth also showed variation along the studied segment (Figure9). During the studied 108 years, the mean thalweg depth of the entire studied segment increased from 12.2 m to 14.1 m, indicating 1.9 m incision on average (1.7 cm/y). In this process, similarly to the width changes, the period of 1961–1976 was characterised by a slight aggradation of channel bed, as the mean thalweg depth decreased from 13.8 m to 13.5 m. The minimum and maximum rates of incision occurred in 1961–1976 (0.6 cm/y) and 1976–1999 (2.4 cm/y) respectively. Considering downstream changes, no obvious trend was revealed, as the average change in the mean thalweg depth was 18.7% in the
Water2018,10, 884 8 of 20
upper reach, the greatest increase (19.5%) was measured in the middle reach, whilst only a 16.8%
increase in thalweg depth was found in the lower reach over the study period. The greatest incision occurred at the boundaries of the reaches (63% for VO207; 52% for VO 244; and 48% for VO234).
The highest change in depth (122%, by 12.5 m) for both the entire study period and between surveys occurred from 1891 to 1931 in the upper reach (VO200).
Water 2018, 10, x FOR PEER REVIEW 8 of 19
VO234). The highest change in depth (122%, by 12.5 m) for both the entire study period and between surveys occurred from 1891 to 1931 in the upper reach (VO200).
Figure 8. Variation of bankfull width along river for 1891, 1931, 1961, 1976 and 1999.
Figure 9. Variation of thalweg depth along river for 1891, 1931, 1961, 1976 and 1999.
4.2. Effect of Sinuosity on Vertical Channel Parameters
In the 19th century, when the channel-survey network was established, the cross sections were set an approximately uniform distance (2.5 km) from each other. Therefore, they represent channel sections with various sinuosity, and various locations even within a meander. Therefore, to understand the role of the planform of the river in determining cross-sectional area, the cross sections were grouped based on their location: in slightly sinuous bends or in sinuous meanders (Figure 10).
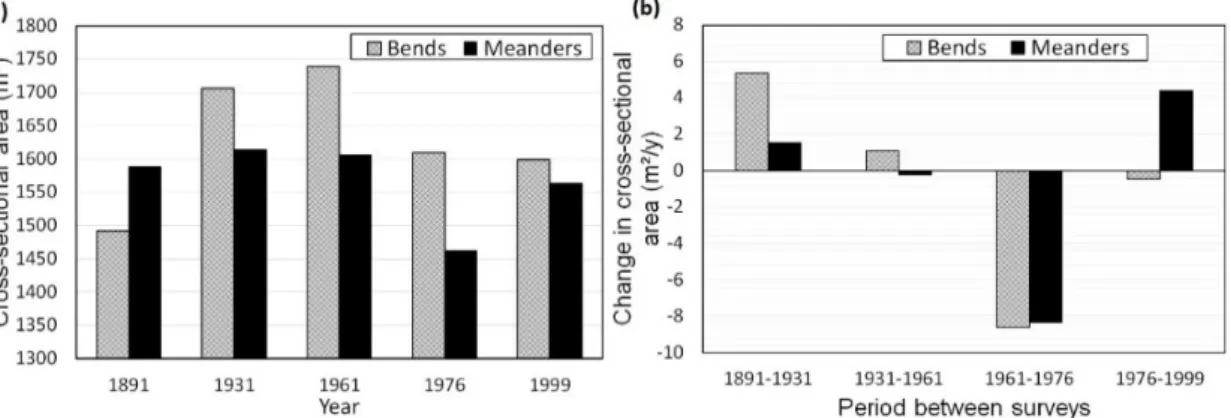
In the slightly sinuous bends usually the cross-sectional area was 2–9% greater than in meanders, except in the first survey period (1891), when bends had smaller area by 6.5%. At the first half of the studied period (1891–1961) the cross-sectional area of the bends increased gradually by 16.6% (from 1491 m2 to1739 m2), while of the meanders, this increase was just 1.1% (from 1589 m2 to 1606 m2).
Later, between 1961 and 1976 the cross-sectional area experienced considerable reduction within both the bends (8.1%) and in the meanders (2.7%). However, during the last period (1976–1999) the cross- sectional area of bends only slightly changed (−0.7%), but the cross-sectional area of the meanders considerably increased by 6.9%, (from 1462 m2 to 1563 m2). At the end of these changes the cross- sectional area conditions of the entire channel became similar, as the values of bends (1599 m2) and meanders (1563 m2) were initially not so close to each other.
These changes are well reflected by the yearly change in cross-sectional area. The greatest increase (5.4 m2/y) in cross-sectional area of bends took place between 1891 and 1931, and later the process slowed down (1931–1961: 1.1 m2/y) to one fifth. Later, the channel of the bends even became smaller, as its area decreased by 8.6 m2/y (1961–1976). The process almost terminated between 1976
Figure 8.Variation of bankfull width along river for 1891, 1931, 1961, 1976 and 1999.
Water 2018, 10, x FOR PEER REVIEW 8 of 19
VO234). The highest change in depth (122%, by 12.5 m) for both the entire study period and between surveys occurred from 1891 to 1931 in the upper reach (VO200).
Figure 8. Variation of bankfull width along river for 1891, 1931, 1961, 1976 and 1999.
Figure 9. Variation of thalweg depth along river for 1891, 1931, 1961, 1976 and 1999.
4.2. Effect of Sinuosity on Vertical Channel Parameters
In the 19th century, when the channel-survey network was established, the cross sections were set an approximately uniform distance (2.5 km) from each other. Therefore, they represent channel sections with various sinuosity, and various locations even within a meander. Therefore, to understand the role of the planform of the river in determining cross-sectional area, the cross sections were grouped based on their location: in slightly sinuous bends or in sinuous meanders (Figure 10).
In the slightly sinuous bends usually the cross-sectional area was 2–9% greater than in meanders, except in the first survey period (1891), when bends had smaller area by 6.5%. At the first half of the studied period (1891–1961) the cross-sectional area of the bends increased gradually by 16.6% (from 1491 m2 to1739 m2), while of the meanders, this increase was just 1.1% (from 1589 m2 to 1606 m2).
Later, between 1961 and 1976 the cross-sectional area experienced considerable reduction within both the bends (8.1%) and in the meanders (2.7%). However, during the last period (1976–1999) the cross- sectional area of bends only slightly changed (−0.7%), but the cross-sectional area of the meanders considerably increased by 6.9%, (from 1462 m2 to 1563 m2). At the end of these changes the cross- sectional area conditions of the entire channel became similar, as the values of bends (1599 m2) and meanders (1563 m2) were initially not so close to each other.
These changes are well reflected by the yearly change in cross-sectional area. The greatest increase (5.4 m2/y) in cross-sectional area of bends took place between 1891 and 1931, and later the process slowed down (1931–1961: 1.1 m2/y) to one fifth. Later, the channel of the bends even became smaller, as its area decreased by 8.6 m2/y (1961–1976). The process almost terminated between 1976
Figure 9.Variation of thalweg depth along river for 1891, 1931, 1961, 1976 and 1999.
4.2. Effect of Sinuosity on Vertical Channel Parameters
In the 19th century, when the channel-survey network was established, the cross sections were set an approximately uniform distance (2.5 km) from each other. Therefore, they represent channel sections with various sinuosity, and various locations even within a meander. Therefore, to understand the role of the planform of the river in determining cross-sectional area, the cross sections were grouped based on their location: in slightly sinuous bends or in sinuous meanders (Figure10). In the slightly sinuous bends usually the cross-sectional area was 2–9% greater than in meanders, except in the first survey period (1891), when bends had smaller area by 6.5%. At the first half of the studied period (1891–1961) the cross-sectional area of the bends increased gradually by 16.6% (from 1491 m2to1739 m2), while of the meanders, this increase was just 1.1% (from 1589 m2 to 1606 m2). Later, between 1961 and 1976 the cross-sectional area experienced considerable reduction within both the bends (8.1%) and in the meanders (2.7%). However, during the last period (1976–1999) the cross-sectional area of bends only slightly changed (−0.7%), but the cross-sectional area of the meanders considerably increased by 6.9%, (from 1462 m2to 1563 m2). At the end of these changes the cross-sectional area conditions of the
Water2018,10, 884 9 of 20
entire channel became similar, as the values of bends (1599 m2) and meanders (1563 m2) were initially not so close to each other.
Water 2018, 10, x FOR PEER REVIEW 9 of 19
and 1999, as the cross-sectional area decrease was only 0.5 m2/y. The cross-sectional area in meanders also increased at the beginning of the studied period, but by much smaller rate (1891–1931: 0.6 m2/y).
In the meanders the deterioration of the channel area started as early as 1931 and lasted until 1976 (by 0.2 m2/y and 8.4 m2/y respectively), and recently the area increased by 4.4 m2/y (1976–1999).
Figure 10. Mean cross-sectional area (a) within bends and meanders for the surveyed years, and (b) the yearly changes between the surveys.
The patterns of change of the cross-sectional area for the entire studied segment and the three reaches (Figure 11) indicated that the changes in the bends followed a similar pattern. That notwithstanding, there were differences due to the magnitudes of change. In the meanders however, the changes for each of the reaches as well as the river segment followed different patterns. To better understand the spatial characteristics of the changes above, the cross-sectional area parametric values (Figure 12) of the three reaches of the Lower Tisza River within both bends and meanders were compared. From 1891, the mean cross-sectional area of the upper reach was the least both in bends and meanders (1407 m2 and 1291 m2, respectively) with the maximum for both bends and meanders in the lower reach (1676 m2 and 1672 m2, respectively). Over the entire studied period, the greatest change in the mean cross-sectional area in bends occurred in the lower reach (10.9%) while in that for meanders occurred in the upper reach (18.4%). The least change in the bends over the period occurred in the upper reach (−2.7%) with the least change in meanders occurring in the middle reach (−3.7%).
These changes were further highlighted by the bankfull width and the thalweg depth. Although the cross-sectional area increased over the 108-year studied period by 4.9% and 1.9% within the bends and meanders, the bankfull width decreased by 18.5% and 20.5%, respectively. Over the same period, however, the thalweg depth increased by 17.9% and 13.0% in the bends and meanders, respectively.
Similar changes in bankfull width and thalweg depth took place within the reaches. In general, the greatest differences between the reaches appeared between 1961 and 1976, when as it indicated, the development pattern of bends and meanders altered. However, the difference between the three reaches became smaller by the end of the studied period, referring to more uniform channel conditions.
Figure 10.Mean cross-sectional area (a) within bends and meanders for the surveyed years, and (b) the yearly changes between the surveys.
These changes are well reflected by the yearly change in cross-sectional area. The greatest increase (5.4 m2/y) in cross-sectional area of bends took place between 1891 and 1931, and later the process slowed down (1931–1961: 1.1 m2/y) to one fifth. Later, the channel of the bends even became smaller, as its area decreased by 8.6 m2/y (1961–1976). The process almost terminated between 1976 and 1999, as the cross-sectional area decrease was only 0.5 m2/y. The cross-sectional area in meanders also increased at the beginning of the studied period, but by much smaller rate (1891–1931: 0.6 m2/y).
In the meanders the deterioration of the channel area started as early as 1931 and lasted until 1976 (by 0.2 m2/y and 8.4 m2/y respectively), and recently the area increased by 4.4 m2/y (1976–1999).
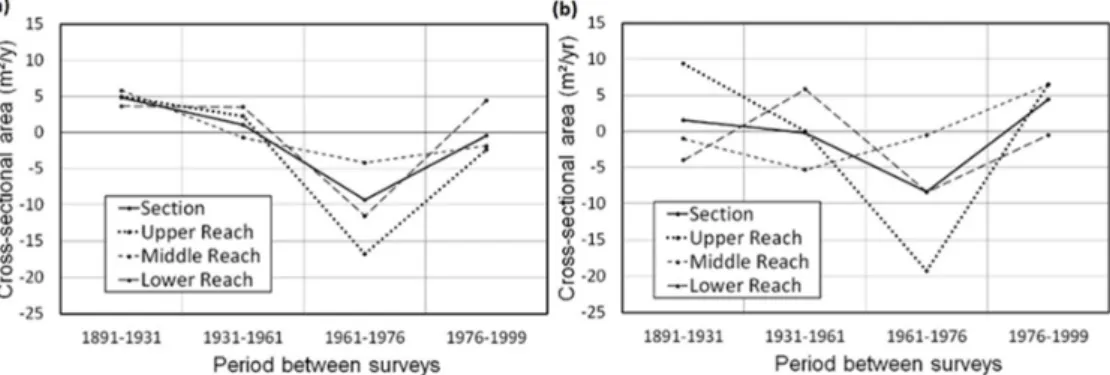
The patterns of change of the cross-sectional area for the entire studied segment and the three reaches (Figure 11) indicated that the changes in the bends followed a similar pattern.
That notwithstanding, there were differences due to the magnitudes of change. In the meanders however, the changes for each of the reaches as well as the river segment followed different patterns.
To better understand the spatial characteristics of the changes above, the cross-sectional area parametric values (Figure12) of the three reaches of the Lower Tisza River within both bends and meanders were compared. From 1891, the mean cross-sectional area of the upper reach was the least both in bends and meanders (1407 m2and 1291 m2, respectively) with the maximum for both bends and meanders in the lower reach (1676 m2and 1672 m2, respectively). Over the entire studied period, the greatest change in the mean cross-sectional area in bends occurred in the lower reach (10.9%) while in that for meanders occurred in the upper reach (18.4%). The least change in the bends over the period occurred in the upper reach (−2.7%) with the least change in meanders occurring in the middle reach (−3.7%). These changes were further highlighted by the bankfull width and the thalweg depth.
Although the cross-sectional area increased over the 108-year studied period by 4.9% and 1.9% within the bends and meanders, the bankfull width decreased by 18.5% and 20.5%, respectively. Over the same period, however, the thalweg depth increased by 17.9% and 13.0% in the bends and meanders, respectively. Similar changes in bankfull width and thalweg depth took place within the reaches.
In general, the greatest differences between the reaches appeared between 1961 and 1976, when as it indicated, the development pattern of bends and meanders altered. However, the difference between the three reaches became smaller by the end of the studied period, referring to more uniform channel conditions.
Water2018,10, 884 10 of 20
Water 2018, 10, x FOR PEER REVIEW 9 of 19
and 1999, as the cross-sectional area decrease was only 0.5 m2/y. The cross-sectional area in meanders also increased at the beginning of the studied period, but by much smaller rate (1891–1931: 0.6 m2/y).
In the meanders the deterioration of the channel area started as early as 1931 and lasted until 1976 (by 0.2 m2/y and 8.4 m2/y respectively), and recently the area increased by 4.4 m2/y (1976–1999).
Figure 10. Mean cross-sectional area (a) within bends and meanders for the surveyed years, and (b) the yearly changes between the surveys.
The patterns of change of the cross-sectional area for the entire studied segment and the three reaches (Figure 11) indicated that the changes in the bends followed a similar pattern. That notwithstanding, there were differences due to the magnitudes of change. In the meanders however, the changes for each of the reaches as well as the river segment followed different patterns. To better understand the spatial characteristics of the changes above, the cross-sectional area parametric values (Figure 12) of the three reaches of the Lower Tisza River within both bends and meanders were compared. From 1891, the mean cross-sectional area of the upper reach was the least both in bends and meanders (1407 m2 and 1291 m2, respectively) with the maximum for both bends and meanders in the lower reach (1676 m2 and 1672 m2, respectively). Over the entire studied period, the greatest change in the mean cross-sectional area in bends occurred in the lower reach (10.9%) while in that for meanders occurred in the upper reach (18.4%). The least change in the bends over the period occurred in the upper reach (−2.7%) with the least change in meanders occurring in the middle reach (−3.7%).
These changes were further highlighted by the bankfull width and the thalweg depth. Although the cross-sectional area increased over the 108-year studied period by 4.9% and 1.9% within the bends and meanders, the bankfull width decreased by 18.5% and 20.5%, respectively. Over the same period, however, the thalweg depth increased by 17.9% and 13.0% in the bends and meanders, respectively.
Similar changes in bankfull width and thalweg depth took place within the reaches. In general, the greatest differences between the reaches appeared between 1961 and 1976, when as it indicated, the development pattern of bends and meanders altered. However, the difference between the three reaches became smaller by the end of the studied period, referring to more uniform channel conditions.
Figure 11.Yearly change in cross-sectional area for (a) bends and (b) meanders for the periods between surveys of cross sections within the three reaches and entire studied segment.
Water 2018, 10, x FOR PEER REVIEW 10 of 19
Figure 11. Yearly change in cross-sectional area for (a) bends and (b) meanders for the periods between surveys of cross sections within the three reaches and entire studied segment.
Figure 12. Comparison of processes of the reaches and entire studied segment. Yearly change in bankfull width for bends (a) and meanders (b); and yearly change in thalweg depth for bends (c) and meanders (d) for the periods between surveys.
4.3. Effect of Artificial Cutoffs on Vertical Channel Parameters
The downstream variations of cross-sectional parameters only partly could be explained by the various sinuosity conditions at the surveyed profiles, as the direct engineering works could also affect the vertical parameters of the channel. The artificial cutoffs affected the channel development directly at the 12 surveyed cross sections (see Figure 5).
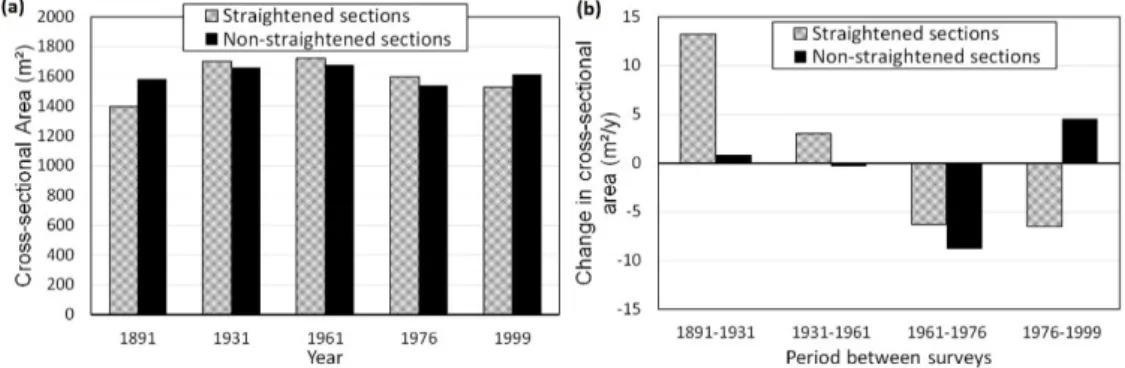
The mean cross-sectional area increased by 39.4% (1891–1999) of the straightened channel sections created by artificial cutoffs. Meanwhile, the mean cross-sectional area of those sections, which were not affected directly by cutoffs slightly decreased (2.7%). The cross-sectional area of the straightened sections increased considerably soon after the cutoffs were made (1891–1931: 13.2 m2/y), and even the non-straightened sections had an increased cross-sectional area (0.8 m2/y; Figure 13).
The process continued within the straightened sections later on (1931–1961), though its rate decreased (3.1 m2/y). However, the non-straightened sections had already experienced decline in their cross- sectional area (0.3 m2/y). The deterioration of the straightened sections started after 1961, as their cross-sectional area decreased by 6.3 m2/y (1961–1979) and 6.5 m2/y (1976–1999). Within the non- straightened sections, the yearly change in cross-sectional area had a different pattern, as it decreased by 8.7 m2/y between 1961 and 1976, but later it increased by 4.5 m2/y (1976–1999).
The changes within these straightened sections also indicate that the maximum and mean cross- sectional area values increased just until 1961 (Figure 14). However, the minimum cross-sectional area value (620 m2: VO221) was very low in 1891, and it increased by 166% until 1931 (1651 m2).
Though later on (1931–1976) it also decreased similarly to the maximum and mean values, though the decrease in minimum values started earlier. A comparison of the mean cross-sectional area values of the straightened sections within the reaches reflects that, there was always an increasing downstream trend, thus the lower reach had the greatest cross-sectional area in all survey years.
Figure 12.Comparison of processes of the reaches and entire studied segment. Yearly change in bankfull width for bends (a) and meanders (b); and yearly change in thalweg depth for bends (c) and meanders (d) for the periods between surveys.
4.3. Effect of Artificial Cutoffs on Vertical Channel Parameters
The downstream variations of cross-sectional parameters only partly could be explained by the various sinuosity conditions at the surveyed profiles, as the direct engineering works could also affect the vertical parameters of the channel. The artificial cutoffs affected the channel development directly at the 12 surveyed cross sections (see Figure5).
The mean cross-sectional area increased by 39.4% (1891–1999) of the straightened channel sections created by artificial cutoffs. Meanwhile, the mean cross-sectional area of those sections, which were not affected directly by cutoffs slightly decreased (2.7%). The cross-sectional area of the straightened sections increased considerably soon after the cutoffs were made (1891–1931: 13.2 m2/y), and even the non-straightened sections had an increased cross-sectional area (0.8 m2/y; Figure13). The process continued within the straightened sections later on (1931–1961), though its rate decreased (3.1 m2/y).
However, the non-straightened sections had already experienced decline in their cross-sectional area (0.3 m2/y). The deterioration of the straightened sections started after 1961, as their cross-sectional area
Water2018,10, 884 11 of 20
decreased by 6.3 m2/y (1961–1979) and 6.5 m2/y (1976–1999). Within the non-straightened sections, the yearly change in cross-sectional area had a different pattern, as it decreased by 8.7 m2/y between 1961 and 1976, but later it increased by 4.5 mWater 2018, 10, x FOR PEER REVIEW 2/y (1976–1999). 11 of 19
Figure 13. Mean cross-sectional area of straightened and non-straightened sections (a) for the years 1891, 1931, 1961, 1976 and 1999, and (b) the yearly changes between.
The changes within these straightened sections also indicate that the maximum and mean cross- sectional area values increased just until 1961 (Figure 14). However, the minimum cross-sectional area value (620 m2: VO221) was very low in 1891, and it increased by 166% until 1931 (1651 m2).
Though later on (1931–1976) it also decreased similarly to the maximum and mean values, though the decrease in minimum values started earlier. A comparison of the mean cross-sectional area values of the straightened sections within the reaches reflects that, there was always an increasing downstream trend, thus the lower reach had the greatest cross-sectional area in all survey years.
Figure 14. Variations in cross-sectional area within straightened sections (a) of the entire studied segment of the river and (b) of the upper, middle and lower reaches.
In the straightened sections the temporal patterns of the changes in the cross-sectional area within the reaches were similar to those of entire Lower Tisza River, while those of the non- straightened sections were different (Figure 15). In the straightened sections, the yearly change in the cross-sectional area for all the reaches decreased until 1976, after which it increased, although not up to the earlier rates. On the other hand, the non-straightened sections had varying trends in the yearly change in the cross-sectional area, as while the upper and middle reaches increased until 1931, the values of the upper reach decreased. Later there was a decreasing trend for the upper and lower reaches while the cross-sectional area of the middle reach increased. However, after 1976, the cross- sectional areas of the straightened and non-straightened sections uniformly increased.
The yearly change in the bankfull width and thalweg depth highlighted their influences on the cross-sectional area (Figure 16). Generally, there was an inverse relationship between the yearly change in bankfull width and yearly change in thalweg depth. While the rate bankfull width change decreased until 1976, later it increased. On the other hand, the yearly change in thalweg depth generally decreased until 1976, but later decreased. In spite of these general trends, between 1931 and 1961, there was an increase in the rate of bankfull width in the upper reach for the straightened sections, while an increase for the same period within the non-straightened sections of the lower reach was also detected.
Figure 13.Mean cross-sectional area of straightened and non-straightened sections (a) for the years 1891, 1931, 1961, 1976 and 1999, and (b) the yearly changes between.
The changes within these straightened sections also indicate that the maximum and mean cross-sectional area values increased just until 1961 (Figure14). However, the minimum cross-sectional area value (620 m2: VO221) was very low in 1891, and it increased by 166% until 1931 (1651 m2).
Though later on (1931–1976) it also decreased similarly to the maximum and mean values, though the decrease in minimum values started earlier. A comparison of the mean cross-sectional area values of the straightened sections within the reaches reflects that, there was always an increasing downstream trend, thus the lower reach had the greatest cross-sectional area in all survey years.
Water 2018, 10, x FOR PEER REVIEW 11 of 19
Figure 13. Mean cross-sectional area of straightened and non-straightened sections (a) for the years 1891, 1931, 1961, 1976 and 1999, and (b) the yearly changes between.
The changes within these straightened sections also indicate that the maximum and mean cross- sectional area values increased just until 1961 (Figure 14). However, the minimum cross-sectional area value (620 m2: VO221) was very low in 1891, and it increased by 166% until 1931 (1651 m2).
Though later on (1931–1976) it also decreased similarly to the maximum and mean values, though the decrease in minimum values started earlier. A comparison of the mean cross-sectional area values of the straightened sections within the reaches reflects that, there was always an increasing downstream trend, thus the lower reach had the greatest cross-sectional area in all survey years.
Figure 14. Variations in cross-sectional area within straightened sections (a) of the entire studied segment of the river and (b) of the upper, middle and lower reaches.
In the straightened sections the temporal patterns of the changes in the cross-sectional area within the reaches were similar to those of entire Lower Tisza River, while those of the non- straightened sections were different (Figure 15). In the straightened sections, the yearly change in the cross-sectional area for all the reaches decreased until 1976, after which it increased, although not up to the earlier rates. On the other hand, the non-straightened sections had varying trends in the yearly change in the cross-sectional area, as while the upper and middle reaches increased until 1931, the values of the upper reach decreased. Later there was a decreasing trend for the upper and lower reaches while the cross-sectional area of the middle reach increased. However, after 1976, the cross- sectional areas of the straightened and non-straightened sections uniformly increased.
The yearly change in the bankfull width and thalweg depth highlighted their influences on the cross-sectional area (Figure 16). Generally, there was an inverse relationship between the yearly change in bankfull width and yearly change in thalweg depth. While the rate bankfull width change decreased until 1976, later it increased. On the other hand, the yearly change in thalweg depth generally decreased until 1976, but later decreased. In spite of these general trends, between 1931 and 1961, there was an increase in the rate of bankfull width in the upper reach for the straightened sections, while an increase for the same period within the non-straightened sections of the lower reach was also detected.
Figure 14. Variations in cross-sectional area within straightened sections (a) of the entire studied segment of the river and (b) of the upper, middle and lower reaches.
The changes within these straightened sections also indicate that the maximum and mean cross-sectional area values increased just until 1961 (Figure14). However, the minimum cross-sectional area value (620 m2: VO221) was very low in 1891, and it increased by 166% until 1931 (1651 m2).
Though later on (1931–1976) it also decreased similarly to the maximum and mean values, though the decrease in minimum values started earlier. A comparison of the mean cross-sectional area values of the straightened sections within the reaches reflects that, there was always an increasing downstream trend, thus the lower reach had the greatest cross-sectional area in all survey years.
In the straightened sections the temporal patterns of the changes in the cross-sectional area within the reaches were similar to those of entire Lower Tisza River, while those of the non-straightened sections were different (Figure15). In the straightened sections, the yearly change in the cross-sectional area for all the reaches decreased until 1976, after which it increased, although not up to the earlier rates. On the other hand, the non-straightened sections had varying trends in the yearly change in the cross-sectional area, as while the upper and middle reaches increased until 1931, the values of the
Water2018,10, 884 12 of 20
upper reach decreased. Later there was a decreasing trend for the upper and lower reaches while the cross-sectional area of the middle reach increased. However, after 1976, the cross-sectional areas of the straightened and non-straightened sections uniformly increased.Water 2018, 10, x FOR PEER REVIEW 12 of 19
Figure 15. Yearly change in cross-sectional area of (a) straightened sections and (b) non-straightened sections for periods between the surveys in case of the three reaches and the entire studied segment.
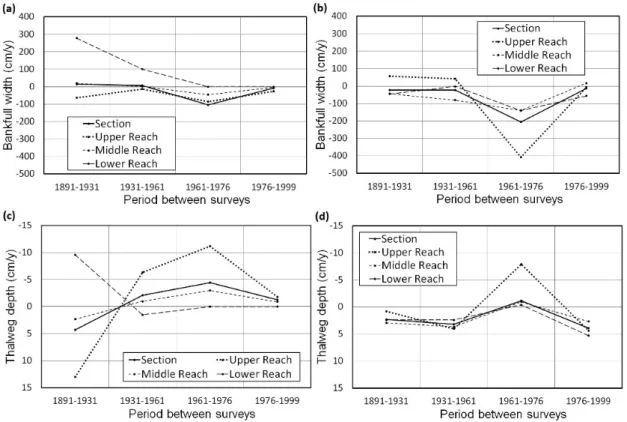
Figure 16. Comparison of processes of the reaches and entire studied segment. Yearly change in (a) bankfull width for straightened sections; (b) bankfull width for non-straightened sections; and yearly change in (c) thalweg depth for straightened sections; and (d) non-straightened sections.
4.4. Effects of the Construction of Revetments and Groynes on Vertical Channel Parameters
To evaluate the effect of revetments on the morphological evolution of the channel, the changes in cross-sectional area of non-revetmented and revetmented sections were compared (Figure 17). The revetments and groynes were mainly constructed after the 1931 survey, thus their effect on vertical parameters should be pronounced only later on. Besides, these direct works were local (almost point- like), affecting low number of cross sections (see Figure 5). As there are only three channel cross sections with groynes, and in the same locations there are revetments as well, in the following analysis we consider only the influence of revetments.
Figure 15.Yearly change in cross-sectional area of (a) straightened sections and (b) non-straightened sections for periods between the surveys in case of the three reaches and the entire studied segment.
The yearly change in the bankfull width and thalweg depth highlighted their influences on the cross-sectional area (Figure16). Generally, there was an inverse relationship between the yearly change in bankfull width and yearly change in thalweg depth. While the rate bankfull width change decreased until 1976, later it increased. On the other hand, the yearly change in thalweg depth generally decreased until 1976, but later decreased. In spite of these general trends, between 1931 and 1961, there was an increase in the rate of bankfull width in the upper reach for the straightened sections, while an increase for the same period within the non-straightened sections of the lower reach was also detected.
Water 2018, 10, x FOR PEER REVIEW 12 of 19
Figure 15. Yearly change in cross-sectional area of (a) straightened sections and (b) non-straightened sections for periods between the surveys in case of the three reaches and the entire studied segment.
Figure 16. Comparison of processes of the reaches and entire studied segment. Yearly change in (a) bankfull width for straightened sections; (b) bankfull width for non-straightened sections; and yearly change in (c) thalweg depth for straightened sections; and (d) non-straightened sections.
4.4. Effects of the Construction of Revetments and Groynes on Vertical Channel Parameters
To evaluate the effect of revetments on the morphological evolution of the channel, the changes in cross-sectional area of non-revetmented and revetmented sections were compared (Figure 17). The revetments and groynes were mainly constructed after the 1931 survey, thus their effect on vertical parameters should be pronounced only later on. Besides, these direct works were local (almost point- like), affecting low number of cross sections (see Figure 5). As there are only three channel cross sections with groynes, and in the same locations there are revetments as well, in the following analysis we consider only the influence of revetments.
Figure 16. Comparison of processes of the reaches and entire studied segment. Yearly change in (a) bankfull width for straightened sections; (b) bankfull width for non-straightened sections; and yearly change in (c) thalweg depth for straightened sections; and (d) non-straightened sections.