Long-term hydrological changes after various river regulation measures: are we responsible for flow extremes?
Tímea Kiss, Károly Fiala, György Sipos and Gábor Szatmári
ABSTRACT
Engineering works have affected the morphology of rivers (e.g., by cut-offs, artificial levees, revetments, and reservoir and dam constructions). These human impacts also have hydrological impacts, as they alter the natural channel geometry, affect the carrying capacity of the channel and confine thefloodplains. The goals of the present paper are to analyseflow changes for the Tisza River (in Hungary) with its highly regulated channel using a long (141 y) daily hydrologic dataset and to evaluate the engineering works from the point of hydrological and morphological equilibrium. Since the late 19th century, theflood level along the Lower Tisza River has increased by 216 cm; further, since 1998,flood levels increased by over 80 cm without an increase in discharge. In addition, river stages for lowflows have decreased, and the water slope has decreased. These changes are likely connected to morphological changes in the channel (e.g., incision, narrowing, disappearance of point bars, intensifying mass movements), which have been driven by the complex response to human impacts. While the channel could adjust itself to convey largerfloods after the cut-offs, the revetments impede the channel adjustment and contribute to the hydrological and morphological disequilibrium state along the Tisza River.
Tímea Kiss(corresponding author) György Sipos
Department of Physical Geography and Geoinformatics,
University of Szeged, Egyetem u. 2–6, Szeged, 6722, Hungary
E-mail:kisstimi@gmail.com
Károly Fiala
Lower Tisza District Water Directorate (ATIVIZIG), Stefánia 4, Szeged, 6720,
Hungary
Gábor Szatmári
Centre for Agricultural Research, Hungarian Academy of Sciences,
Herman Ottó 15, Budapest, 1022, Hungary
Key words|artificial cut-off, disequilibrium state, hydrological response, levee construction, revetment construction
INTRODUCTION
All over the world, increasing human impact is exerted on catchments, river channels and floodplains, affecting their hydrology, water and sediment regime, which in turn, result in altered channel and floodplain morphology and dynamics (Pinter & Heine ; Xia et al. ). The dis- turbed fluvial environment can be a source of increasing risk to society. For example, on lowland rivers, the flood risk can be higher because of decreasedflood conveyance of floodplains due to artificial levee constructions (Remo et al. ), land-use changes (Bormann et al. ) and mismanagement of floodplain vegetation (Delai et al.
). On the other hand, extremely low stages in relation
to accelerated bed-scour (initiated by, for example, dredging or dam construction; Rinaldi & Simon ; Remo et al.
) are also unfavourable for society, as low water levels can make water withdrawal or navigation difficult.
Artificial cut-offs are often created to protect lands, to support navigation or to decrease the extent and duration of flood water. The primary effects of cut-offs on stream channels are increased channel slope and stream power, which lead to increased erosion in the new straightened arti- ficial channel and enhance bedload transport (Biedenharn et al.). Immediately after cut-off, the channel develop- ment accelerates, the channel parameters change (Smith
doi: 10.2166/nh.2019.095
& Winkley ;Rinaldi & Simon;Wyzga), and in extreme cases, even channel metamorphosis can occur (McEwen ). The most common response to cut-offs is channel narrowing (Rinaldi & Simon ;
Surian ; Surian & Rinaldi ), and by increasing the local sediment discharge, narrowing can accelerate the overbank aggradation close to the channel banks (Hesselink et al. ), which in turn increases flood levels by reducing thefloodplain cross-sectional area avail- able to store and convey flood water (Lóczyet al. ;
Kisset al.).
Revetments and groynes are constructed to stabilise the banks and the channel. They prevent lateral erosion, narrowing the channel (Warner ) and resulting in a simplified channel pattern (Surian). These engineering techniques alter channel geometry and flow conditions (Pinter & Heine;Remoet al.), and they can con- tribute to increases in flood levels. The disturbance during their construction and the resultant channel incision increase the local sediment discharge and thus can acceler- ate localfloodplain aggradation along the banks (Marriott
;Hesselinket al.).
Artificial levees are created to provideflood safety. They indeed decrease the risk of flood inundation for small to moderate floods but have the potential to substantially increase flood damage during large floods due to their impacts on bothflood level and discharge. As formerflood- plain areas become disconnected from the river by the levees (Guida et al. , ), the volume of overbank flow is limited to a smaller area of the active floodplain, increasing flood stages (Remo et al. , ). Artificial levees also accelerate overbank aggradation as sediments are deposited on the confined floodplain (Kiss et al. ), and this process decreases flood conveyance of the river and increasesflood hazard.
Some researchers have pointed out that although the aim of these engineering works is to stabilise the channel and control floods, they very often increase flood hazard (Pinter & Heine;Pinteret al.;Lóczyet al.;
Bormann et al. ) because even minor reduction of the cross-sectional area can increaseflood levels on a centennial scale (Remo et al. ). Revetments also affect the low stages, as they support incision and channel narrowing, resulting in a decrease in stages, and over the long term,
these processes have progressive trends (Pinter & Heine
).
Although various engineering works affect a given river, their subsequent or combined effects are not often evaluated. The previous work on the impacts of river engineering onflood hazard mainly focused on the morpho- logical and hydraulic consequences of engineering works, whereas only few studies deal with long-term hydrological data. However, the most efficient method of future river management can be chosen only if the active processes and the consequences of engineering works are known in detail.
Due to Hungary’s long tradition of river engineering, there are also long-term (150–200 year) datasets from which it is possible to evaluate changes inflood conveyance and channel morpho-dynamics. On the other hand, the con- tinental climate and the architecture of the river system amplify the fluvial response to human impacts. The most substantial unforeseen consequence of river engineering has been related to increases in the magnitude and fre- quency offloods and reduction of water levels during low flows related to channel incision. Channel incision can adversely impact direct societal needs making water extrac- tion more difficult or costly and, in some cases, disrupting navigation by creating a channel too narrow for navigation during low flow conditions. In addition, channel incision has been linked to reductions in hydrologic connectivity between the river and itsfloodplain which adversely impacts riverine ecosystems. Hungary plans to start a programme on surface and subsurface waters (Kvassay Plan) to support their sustainable usage. Within the programme, the improve- ment of flood conveyance by channels and floodplains is highlighted, but without detailed descriptions. Thus, an analysis of the historical hydrological and geospatial data is needed to better understand thefluvial responses to pre- vious interventions, as without detailed research, the best practice and sustainable solutions could not be chosen.
The present paper contributes to this analysis, as we aimed to study the hydrological and hydraulic changes (e.g., water stages, discharge, water slope) of the Lower Tisza River in Hungary. The goal of this research is to explore the relationship between these parameters and river engin- eering structures, which have altered the hydrology and hydraulics of the lower Tisza River over the past∼150 years.
STUDY AREA AND DATA
The Tisza River (Figure 1) is the second largest river in Hungary (L: 962 km, A: 157,200 km2; Lászlóffy ).
Characteristic hydrological parameters of the Tisza are summarised in Table 1. Floods usually develop due to early spring snowmelt and early summer rainfall (Lászlóffy
), although recently, late autumn and winter floods are becoming more frequent. As the Tisza has a very low channel slope, floods could be influenced by backwater flooding from the Danube or major tributaries (Vágás &
Bezdán ). These impounded floods are characterised by upstream migration of the peak of the flood and rapid drops of stages after the impoundment is ended.
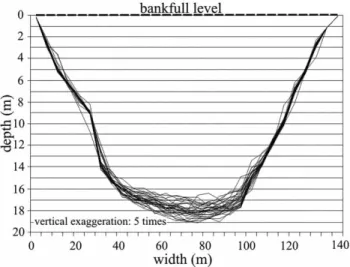
A unique characteristic of the sand-bedded and deeply incised Tisza is an intense change in channel cross-sectional area duringfloods. During rising stages, the channel incises
(by 3–5 m), while during falling stages or flood peaks (especially during impoundment), in-channel aggradation occurs (Figure 2).
The average channel width of the Lower Tisza is 110 m, although in some sections with revetments, it is less than 80 m, which creates unfavourable conditions for the passage of floods. The mean depth of the channel varies between 12.0 m and 15.3 m, and it has increased by 5–48% at different cross sections since the 19th-century regulations (Kiss et al. ). However, the effect of incision is more than compensated for by channel narrowing (17–45%);
thus, the cross-sectional area characteristically decreased by 6–19% during the 20th century (Kisset al.).
River regulation along the studied reach
Prior to the 19th-century engineering works, the Tisza had a wide (10–150 km) floodplain with gentle relief (<5 m).
The channel was shallow (4–5 m) and had low slope (2– 5 cm/km) and high sinuosity (Lászlóffy ). During the long-lasting floods (5–6 months), large areas were inundated; thus, most of the Great Hungarian Plain was occupied by wet meadows and marshlands. The sys- tematic 19th-century engineering works strove to provide protection of intensively cultivated agricultural lands on the 26,000 km2 of floodplain using artificial (embanked) levees, to decrease the length of the channel in order to decrease flood-wave travel times shortening the duration
Figure 1|The analysis was carried out on the Lower Tisza (Hungary) using the data from Mindszent, Algyo˝and Szeged gauging stations: 1: gauging station; 2: dam.
Table 1|Main hydrological and hydraulic parameters of the Lower Tisza at Szeged
Parameter Value
Mean water slope 2.9 cm/km
Floodflow velocity 0.6–1.3 m/s
Recorded highest stage (year) 1,062 cm (in 2006) Recorded lowest stage (year) 293 cm (in 1968) Maximum discharge (year) 4,350 m3/s (in 1932) Minimum discharge (year) 60 m3/s (in 2013) Yearly suspended sediment transport 18.7 million tons
Yearly bedload transport 9,000 tons
Data sources:Lászlóffy 1982; Lower Tisza District Water Directorate (ATIVIZIG).
Figure 2|River-bed changes in the Tisza River at Algyo˝gauging station during the record flood in 2000 based on daily channel surveys (Data source:ATIVIZIG).
offloods, and to improve navigation (Ihrig). During the flood protection works, a 2,940 km-long artificial levee system was built along the Tisza River (Lászlóffy ).
These levees resulted in dramatic contraction of thefloodplain area subjected to inundation, as the originally several tens km- widefloodplain was reduced to 0.2–5 km. The width of the active floodplain is not regular; thus, the extremely narrow areas impound thefloods and increase their heights (Lászlóffy
). The artificial levees were completed by the early 1880s.
However, due to ever-increasingflood levels, they were heigh- tened several times during the 20th century.
Simultaneously with levee construction, 102 artificial cut-offs were made along the Tisza, shortening it from 1,419 km to 962 km (by 32%; Lászlóffy ). The steeper slope and the deeper channel resulted in improved flood conveyance; thus, the duration of floods decreased from 180 d/y to 59 d/y on average. On the Lower Tisza, only ten meanders were cut off (1855–1892); thus, the originally 105 km-long section was shortened by only 18% (Ihrig).
Bank revetments were constructed in the 20th century (i) to stop lateral erosion where the channel migrated too close to the artificial levees, (ii) to improve navigation by deepening the channel through constriction at crossings (riffles) and other shallow reaches of the river, and (iii) to reduce the sinuosity and length of the channel to reduce travel distances and improve the flood conveyance. Most of the revetments were built between the 1930s and 1960s.
Today, 51.5% of the length of the Lower Tisza is provided with revetments (Kisset al.).
The former floodplains lost their connection with the river; thus, in early spring, the surplus precipitation appears as inland excess water on the fields, although during summer, droughts often affect the area. To solve these problems, an artificial irrigation canal system was created in the 1950s and dams were built at Tiszalök in 1954, at Kisköre in 1975 and at Novi Becej in Serbia in 1976.
Data
For the analyses performed in this study, long-termflow data were compiled for three hydrologic monitoring stations on the Lower Tisza (Figure 1) at Mindszent (217.8 rkm), Algyo˝ (192 rkm) and Szeged (173.6 rkm). The Mindszent station is located between two large tributaries (Körös and
Maros Rivers). The Algyo˝ station is situated upstream (by 15 km), and the Szeged station is just downstream (3.4 km) of the Maros confluence. The channel andfloodplain mor- phologies in the vicinities of the stations are also different:
around Mindszent, channel sinuosity is higher (1.2), and the hydrologically connected active floodplain is relatively wide (1–4 km), while at Algyo˝ and Szeged, the sinuosity is lower (1.1) because of artificial cut-offs, and the active floodplain width (0.7–1 km) is substantially narrower.
Analysed water stages were recorded and provided by the Lower Tisza District Water Directorate (ATIVIZIG).
Water level is measured daily at 7:00 at the three stations via fixed staff gauges read by observers. The longest stage dataset is available from Szeged (1876–2017), while at the upstream stations (Mindszent and Algyo˝), measurements began only in 1901. The gauge zero was set to an arbitrary reference point based on an extremely low observed stage in 1840. Regular weekly discharge measurements at Szeged have been conducted since 1921; however, periodic discharge measurements exist for the Szeged station as far back as 1881. During floods, the discharge measurements are repeated daily. While rating curves have been generated from the daily stage measurements, the large amount of scour andfill that occurs duringfloods and the associated hysteresis cause substantial differences in these discharge estimates. Hence, we use only measured discharges for our analyses. Until 2006, the discharge measurements were made from bridges using a velocity-area method employing Seba velocity meters, but after 2006, applying a Teledyne Rio Grande acoustic Doppler profiler (ADCP). The dis- charge values measured by propelled Seba meters are usually lower by 0.8–7.7% than values measured by the ADCP. According toKonyecsny (), this discrepancy is partly caused by the quite long measurement time of the Seba instrument, during which the discharge can change, and is partly caused by their different sampling methods.
METHODS
Based on the measured stage (H) and discharge (Q) data, some hydrological and hydraulic parameters were calcu- lated. The highest recorded flood stage (HRF) and the lowest recorded stage (HRL) until a given date were selected
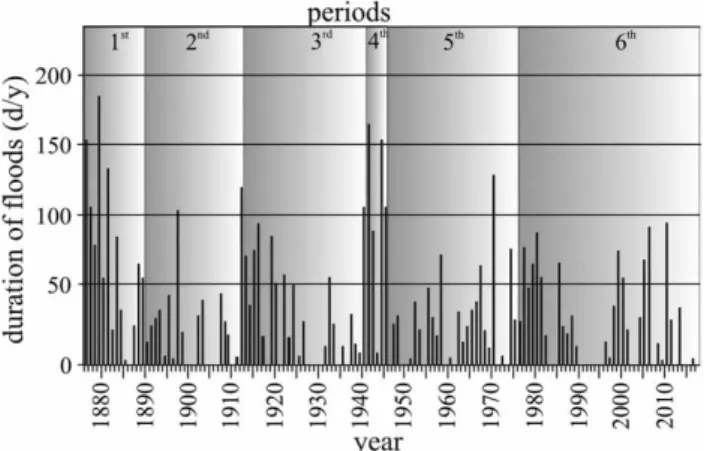
to illustrate the increasing hydraulic extremes. To evaluate the effect of channel adjustment onflow conditions, the dur- ation offloods (Df) and low stages (Dl) was calculated. The annual duration offloods (Df) was defined as the number of days within a year (d/y) when the stage exceeds the lower bankfull level at the gauging station. The duration of low stages (Dl) was defined as the number of days within a year (d/y) when the stage is below 0 cm (i.e., the lowest stage before channel regulations in 1840). In this way, the duration offloods and low water stages could be compared. However, the elevation (stage) of 90% exceedance probability (Ep90%) was also determined, as it refers to channel processes. The water slope was calculated between two neighbouring gau- ging stations based on daily stage data (cm/km).
A hierarchical divisive multiple change point analysis was carried out on the principal components of the maximum, mean and minimum annual water stages and duration of floods using the ecp package, which is an R package for non- parametric multiple change point analysis of multivariate data (James & Matteson;R Core Team). The aim was to detect distributional changes within time-ordered multivariate observations. For the analysis, a significance level of 0.05 was applied to sequentially test that a proposed change point is statistically significant. All parameters were left as the default values according to James & Matteson (). The minimum number of change points was selected to befive because the expert knowledge-based inspection of the time series suggested that the series includesfive change points at least. The Qmax was excluded from the change point analysis because there were no regular discharge obser- vations between 1876 and 1921.
Stage exceedance probabilities were set up on a half- decade scale to describe stage frequencies. First, the stage values were sorted in decreasing numerical order. The total length of five years was considered as 100%, and the stage data were sampled at given (1%, 10%, 20%, etc.) frequencies.
RESULTS
Temporal changes in stage, discharge andflood duration at Szeged
As the longest stage (141 y) and discharge (95 y) datasets are available from Szeged, we focus on this station to present
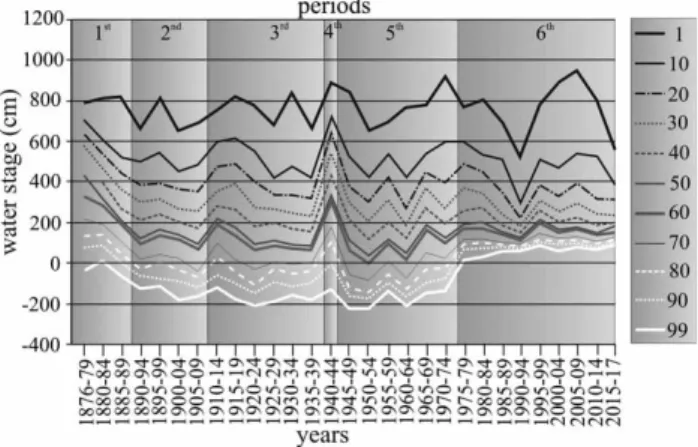
temporal changes in these parameters. Based on the hier- archical divisive multiple change point analysis of the stage data, the years between 1876 and 2017 are divided into six periods (Figures 3–6).
The first period (1876–1889) was characterised by relatively high stages but with a decreasing trend. This period is well reflected by the stage exceedance probability (EP) distribution curves: e.g., the height of the EP50%
curve decreased from 434 cm to 211 cm. The decreases in the EP30–90% curves were at least 100 cm, although the EP50–70% curves decreased by more than 200 cm. Floods occurred almost each year, and they usually lasted for months (mean Df: 77 d/y), although their duration also decreased with time. At the beginning of the period, in
Figure 3|Highest (Hmax), mean (Hmean) and lowest (Hmin) annual stages at Szeged measured between 1876 and 2017.
Figure 4|Water stage values corresponding to certain exceedance probabilities at Szeged gauging station (1876–2017).
1876–1877, a high (HRF: 795 cm) and unusually long (126 d) flood developed. The level of this recordflood was exceeded in 1879 (HRF: 806 cm), when a similar winter–springflood developed and lasted for 230 d. This flood breached the already existingflood protection levees and totally destroyed the city of Szeged, the regional capital, which is located within the Tisza floodplain. Later, even higher record flood stages were measured in 1881 (HRF: 845 cm) and 1888 (HRF: 846 cm); thus, during the period, the height of flood peaks increased by 51 cm. Floods covered theflood- plain for 21% of the period, while low stages lasted for 4%
(mean Dl: 14 d/y). Surprisingly, record low stages were also measured and occurred after the substantial floods of 1877 and 1888 with stages of63 cm and88 cm, respect- ively; thus, the lowest stages decreased by 25 cm.
In the second period (1890–1912), the stages decreased slightly compared to the former period, as reflected by the declining stages for a given exceedance probability. Floods became shorter (mean Df: 27 d/y), as they previously cov- ered thefloodplain for 21% of the period but now for only 7.5%. In addition, during this period, about one-third of the years passed without flood stage exceeding bankfull (Figure 6). In this period, only one flood reached a new record level (in 1895, HRF: 883 cm); thus, the peak flood level increased by 37 cm. The largest number of days in flood was recorded in 1912, although it was not a single flood-wave as before but four minor floods. Progressively lower minimum annual stages were measured in four years (1890, 1892, 1903 and 1904); thus, the absolute level of yearly lowest stages decreased further by 113 cm relative to thefirst period, and the duration of low stages increased to 24% (meanDl: 90 d/y).
During the third hydrologic period (1913–1940), the annual highest, mean and lowest stage curves refer to quite diverse years, as reflected by the increasing standard deviation values (by 32–35%). The beginning of the period was more humid; thus, the annual mean and low stage levels and, correspondingly, the exceedance probabilities shifted higher. However, only 9.2% of the entire period (meanDf: 33 d/y) was characterised byfloods. New record flood stages were measured twice (in 1919, HRF: 916 cm;
in 1932,HRF: 923 cm); thus, compared to the highestflood of the previous period, theflood level increased by another 40 cm. Among these events, theflood in 1932 must be high- lighted because it set theflood record in terms of discharge (4,350 m3/s) along the Tisza River in Hungary, although it was relatively short in duration (63 d, March to May).
The duration of low stages increased (Dl: 94 d/y) during this period; thus, they accounted for 25% of the period; how- ever, the duration of low discharges was short (Dl: 90 d/y;
8.5% of the period). The annual minimum low stages decreased further (by21 cm); thus, new records were set in 1917 (HRL:204 cm) and 1921 (HRL:222 cm). During the latest low-stage period, the lowest discharge was 110 m3/s.
An exceptionally wet period occurred between 1941 and 1945; thus, all the characteristic stages and discharge values increased. Within these five years, floods occurred in each year, lasting for three months on average (mean Df:
Figure 6|Annual duration offloods (d/y) at Szeged (bankfull level: 520 cm).
Figure 5|Highest (Qmax), mean (Qmean) and lowest (Qmin) annual discharge values at Szeged between 1921 and 2017.
92 d/y); thus, they covered the floodplain for 25% of the period. The longest flood of the period happened in 1941, starting already in January and lasting for 144 d, although in autumn, three smallflood-waves were observed. During the 1944 flood, another record high stage was measured (HRF: 954 cm); thus, the record level increased by 31 cm.
The height of the annual minimum stages increased due to the humid characteristics of the period, and the duration of low stages decreased to 48 d/y (13%) on average.
The fifth period (1946–1976) was quite similar to the third (1913–1940), but here, slight increases in the values can be detected, and their standard deviation increased.
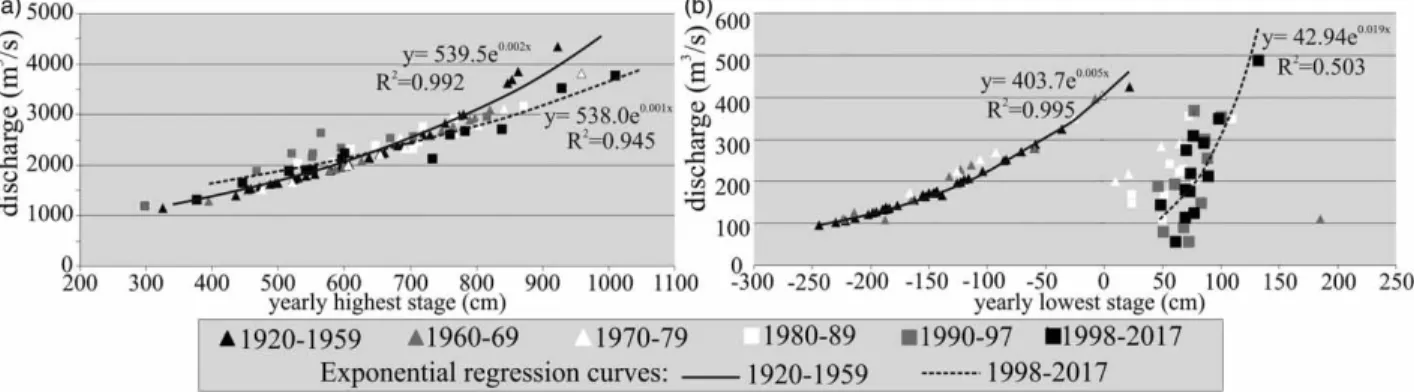
Floods covered the floodplain for 8% of the period (mean Df: 30 d/y). There was only one year (1970) when a new record stage (HRF: 959 cm) was noted; it was only 3 cm higher than the flood in 1944, but it still had a lower dis- charge (3,820 m3/s) than in 1932. This flood was considered to be the‘flood of the century’, as simultaneous floods affected all tributaries of the Tisza. Theflood–similar to the previous record floods – started in February and ended in July; thus, it lasted for 150 d, and stages higher than 800 cm were recorded for 42 d, so that the flood protection of settlements required great efforts. Although the lowest discharge value on record (100 m3/s) was measured in 1946, the record lowest stage (HRL:230 cm) was documented in 1950; thus, compared to the previous period, the recorded lowest stage decreased by 8 cm. The duration of low stages increased to 30% (Dl: 110 d/y). It is interesting to note that prior to 1959, the correlation between discharge and stage values was strong (R2: 0.993–0.997);
however, after 1959, it became weak for low stages (R2: 0.332–0.503;Figure 7).
From the statistical point of view, the sixth period (1977–2017) was more uniform, as the probability curves shifted upward, close to each other. Floods lasted 8% of the period (mean Df: 30 d/y), exactly as in the fifth period. Within the sixth period, the years between 1998 and 2011 must be highlighted, although the existence of this interval was not indicated by the hierarchical divisive multiple change point analysis. During these years, the flood duration increased to 11%. The longestflood (102 d) occurred in 2010, but the new record level (HRF: 1,009 cm) was set in 2006; thus, the peak flood height increased by 55 cm. The twofloods were quite different in character: the 2006flood was due to the backwater effect of the Danube, while the 2010 flood was an independent flood, arriving from the upstream section (Vágás &
Bezdán ). The correlation between the discharge and stage values of the highest yearly waters was declining in the 1980s (R2: 0.906) and 1990s (R2: 0.835), but during the 2000s, it became stronger again (R2: 0.945). Another very characteristic feature of the period is the rise in low stages.
The level of the mean annual minimum stages increased by 205 cm, and the EP90–70% curves shifted considerably upward; thus, during the whole period, water levels were above‘0 cm’(Dl: 0 d/y), and the duration of low discharges decreased (Dl: 18 d/y). At the same time, the mean dis- charge of the lowest stages increased to 220 m3/s, and their Q-H values were substantially less correlated than during previous hydrologic periods (Figure 7).
Figure 7|Stage–discharge relationships of the highest yearly stages (a) and of the lowest yearly stages (b) measured at Szeged. The exponential regression curves of thefirst and last periods are also indicated.
Temporal changes in the stage–discharge relationship offloods
The Tisza is characterised by looped stage–discharge curves, like other low-gradient sand-bedded rivers with changing hydraulic channels or unsteady flow (Chow ). Thus, the discharge for a certain stage is much higher during the rising stage than during the falling stage of aflood (Figure 8);
therefore, theQ-Hvalues create a loop in an anti-clockwise direction. The speciality of these curves is their high hyster- esis and upward shift. For example, in the 1970flood during the rising stage, a discharge of 3,500 m3/s produced a water stage of only 885 cm at Szeged; however, during the falling stage, a similar discharge value corresponded to a much higher stage (930 cm). The changing flood conveyance of the river during the 20th to 21st centuries is well reflected by the upward shift of these loops (i.e., the same discharge is associated with higher stage values). Therefore, the maxi- mum stage (952 cm) measured in 1970 was exceeded at Szeged in 2006 (1,009 cm) without any increase in discharge (1970: 3,820 m3/s; 2006: 3,780 m3/s).
Spatial changes in characteristic water stages andflood duration at two gauging stations (Mindszent and Szeged)
Although the longest stage dataset exists at Szeged, it is highly influenced by the Maros River (3.4 km upstream) and the impounding effect of the Novi Becej Dam (110 km
downstream). The analysis proved that the dataset at Mind- szent (45 km upstream of Szeged) is characteristically different due to local factors. Therefore, the two datasets were compared (Figures 9 and 10), although the fourth period (1941–1945) was not evaluated because during World War II, the gauging station at Mindszent did not operate continuously.
Figure 8|Stage–discharge curves of some greatfloods at Szeged gauging station.
Figure 9|Differences (cm) in the maximum, mean and minimum annual stage levels at Mindszent and Szeged gauging stations. Positive numbers refer to higher values upstream (Mindszent), and negative values refer to higher values downstream (Szeged).
Figure 10|Differences inflood (Df) and low stage (Dl) durations (d/y) at Mindszent and Szeged gauging stations. Higher numbers refer to longerfloods or lower stages upstream (at Mindszent).
The comparison of the datasets indicates that at the two gauging stations, the hydrological data have different trends, which is the most obvious for the sixth period (1977–2017).
Usually, the flood levels were higher (max. by 75 cm) at Mindszent than at Szeged. However, in some years, the floods were 11–25 cm higher at Szeged, due to simultaneous flooding of the Maros or pronounced impoundment by the Danube (Vágás & Bezdán ). Since 1901, new record flood levels were detected at Szeged four times (1919, 1932, 1971 and 2006), whereas the level of flood peaks increased by 93 cm. However, at Mindszent, afifth record flood appeared in 2000, raising the level of peakfloods by 111 cm. Simultaneously with the increasingflood levels at Mindszent, their duration also increased, as at the beginning (1900–1912), floods were longer at Mindszent than at Szeged by only 4 d/y on average, but in the last period (1977–2017), they were already longer by 8 d/y, and during the 1998–2011flood years, their duration increased even more (Df: 11 d/y).
Not only floods but also low stages are different upstream at Mindszent. The level of low stages decreased more remarkably and in an accelerated way: in 1900–
1912, their level was only 22 cm lower at Mindszent than at Szeged, but since 1977, the difference has increased to 92 cm. Similarly, the total decrease in the recorded mini- mum stages was much higher at Mindszent (96 cm) than at Szeged (76 cm). The duration of low stages (Dl. 133 d) was quite long in the upstream section, although at Szeged, they have not occurred since 1976.
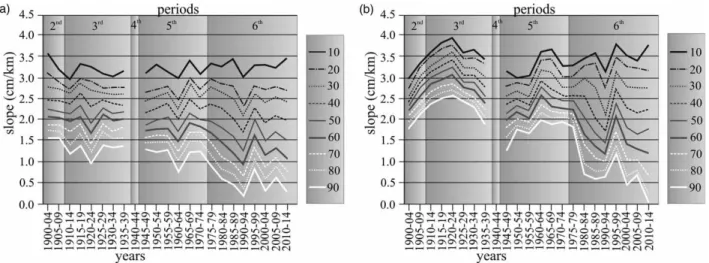
Changes in water slope conditions
Based on the stage values, the water surface slope was also calculated across the three gauging stations. The average water slope of the Lower Tisza between Mindszent and Algyo˝ is only 2.0 cm/km, while between Algyo˝ and Szeged, it increases to 2.4 cm/km. The steeper water slope (by 10–20%) of the downstream section is characteristic of all periods.
However, the temporal trends in water slope changes of the two sections were different. In the upstream section, the water slope frequency curves dropped in thefirst half of the 20th century (Figure 11), while in the downstream section, the curves shifted considerably upward (by 30–50%) until 1924, and they dropped since the late 1920s. The period of 1941–1945 could not be evaluated precisely because the war made impossible the measurement of water levels at Mindszent and Algyo˝. In the next period (1947–1976), the water slope values of the upstream section remained the same (and slightly dropped in the early 1960s), although in the downstream section they started to increase but did not reach the values of the early 20th century. Similar changes characterise the last period (1977–2017), as in both sections, the curves spread, and very low water slope values appeared. While slope values lower than 1 cm/km appeared in the upstream section as early as 1960–1964, they emerged in the downstream section only since the 1980s. In extreme cases, the water slope was 0 cm/km.
During the last period, there was a sudden increase (by
Figure 11|Changes in water slope values of given (10–90%) frequency curves: (a) water slope conditions of the upstream section (Mindszent–Algyo˝); (b) water slope conditions of the downstream section (Algyo˝–Szeged).
50–75%) in water slope in the late 1990s, as in 1998 and 1999, largefloods occurred.
DISCUSSION
The Lower Tisza displayed well-defined hydrological responses to different engineering works (e.g., cut-offs, con- struction of artificial levees, revetments and dams).
However, it must be emphasised that the channel conditions in the late decades of the 19th century should not be con- sidered the natural state, as engineering works started in the mid-19th century. The hydrological response was immedi- ate according to contemporaneous descriptions (Lászlóffy
), as flood levels had already increased (at Szeged between 1830 and 1895 by 270 cm), and the lowest stages dropped (at Szeged by 115 cm, at Mindszent by 105 cm).
Unfortunately, these very early (pre-1876) hydrological data are not available, so we could analyse the hydrological changes of only the last 140 years (since 1876).
Hydrological response to cut-offs and construction of artificial levees
Thefirst hydrologic period (1876–1889) represents the last years of the artificial cut-offs and levee constructions, while the second hydrologic period (1890–1912) reflects the adjustment of the Tisza River to the engineering works. The individual effects of the artificial cut-offs and levee constructions could not be separated, as these changes were made simultaneously.
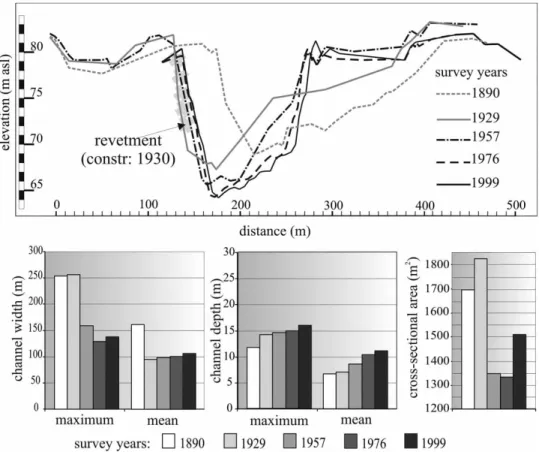
In the downstream section of the Lower Tisza, more cut- offs were made; thus, between Algyo˝ and Szeged, both the channel and the water slope considerably increased between 1876 and the mid-1920s. These changes were coupled with the effect offloodplain constriction; thus, the stream power offloods increased, whereas theflood convey- ance of the river improved. According to our previous study on channel changes along the Lower Tisza, in the late 19th century and at the beginning of the 20th century, the depth, width and cross-sectional area of the channel were greater than they were before the construction of cut-offs (Kiss et al. ). The incision is well reflected by the channel cross section closest to the Mindszent gauging station
(Figure 12), as the section became deeper (by 2.4 m, 20%) and slightly wider (by 10 m, 4%), and its area increased (by 124 m2, 7%). Channel incision is also indicated by the decrease in the lowest water stages on record (by 138 cm at Szeged) and the falling level of exceedance probability curves. The higherflood conveyance of the channel explains the small range of stage fluctuations, the decrease in the highest annual stages, and the shorter floods. However, as floods could not spread over the former floodplain but remained in the confined active one, the peakflood levels increased by 88 cm; thus, the artificial levees had to be heightened (Lászlóffy ), although the reconnection of the former floodplain areas also could be a cost-effective long-term solution to reduce flood levels and flood risk (Guidaet al.). Similar flood level increases caused by artificial levee construction were detected on the Mississippi River (Smith & Winkley;Remoet al.,).
Hydrological response to revetment construction
The widening of the channel was terminated by revetment construction, which had started already in the 1910s because lateral bank erosion had accelerated. Thus, to pro- tect the artificial levees from erosion and to stop the over- widening of the channel, the banks had to be artificially stabilised. The main period of revetment construction was 1930–1960s; however, they have been continually added to mitigate the threat of bank erosion to the levee system.
Therefore, the main period of the response attributed to revetments coincides with the second to fourth hydrological periods (1913–1976). It should be noted that revetments continued to have an impact on river hydraulics through thefifth hydrologic period; however, their hydraulic impacts were combined with and, in part, over-printed by the effects of the downstream dam at Novi Becej.
The channel cross sections indicate that in response to the revetment construction, theflood conveyance decreased dramatically until 1976 (Figure 12). Despite the ongoing incision (by 3.2 m), the channel cross-sectional area decreased considerably (by 11%) because on the side oppo- site the revetments, ongoing point bar accumulation reduced the channel width (by 12–48%;Kiss et al.).
Therefore, the channel parameters decreased: while in 1929, the channel was 263 m wide and 15 m deep
(cross-sectional area of 1,825 m2), it became only 129 m wide and 14.8 m deep, and its cross-sectional area decreased to 1,342 m2by the 1976 survey (Kisset al.). The deterio- ration of the channel is reflected in the changes in water–
surface slope, which slightly decreased since the mid-1920s.
As theflood conveyance of the channel and the water slope decreased, the duration offloods increased, and new peak flood levels were reached. Flood duration increased by 3–6 d/y (to 30–33 d/y) in normal years, although during the wet period of 1941–1945, flood duration tripled (Df: 92 d/y). New record flood levels were detected on four occasions, increasing the peak flood level by 74 cm. Con- siderable upward shifts of the stage–discharge curves also indicate the loss offlood conveyance in the river. Despite the net decrease in conveyance capacity of the Tisza River channel, revetments increased the scour of the channel bed, new minimum water level records were set, and by the end of the period (1976), the duration of low stages increased from 94 d/y to 110 d/y without changes in discharge.
Our results on the effects of revetments on channel geo- metry and corresponding changes in flow capacity of the channel are consistent with previous research. The impor- tance of changes in channel geometry for the increase in flood level (10–70%) has been shown on other rivers (Pinter
& Heine;Remoet al.;Vorogushyn & Merz;
Xia et al. ) in connection with various engineering works (e.g., construction of weirs, wing dams and revetments).
Response to dam construction
In the second half of the 20th century, intensive revetment construction ended, but the Novi Becej Dam started to affect the hydro-morphology of the river during the sixth hydrologic period (1977–2017). After the dam construction, the levels of mean and low stages increased, and the water slope dramatically decreased due to the impounding effect of the dam. The simultaneous decrease in low discharge values (by 15%) is probably attributed to increased water with- drawal and climate variability (Radvánszky & Jacob).
Figure 12|Cross-sectional channel changes close to the Mindszent gauging station based on repeated channel surveys between 1890 and 1990 (Kisset al.2008).
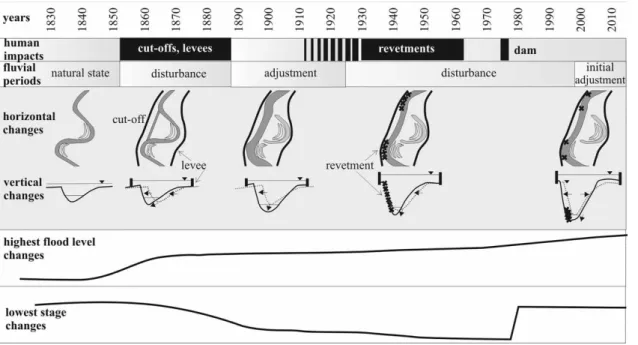
Evaluating the responses and equilibrium state of the river
The hydrological responses of the river to the different engin- eering interventions varied depending on the possibility of river recovery and the duration of the disturbance. For example, the cut-offs had a well-defined period (1850s–
1880s) followed by about 50–70 years without direct human impact. Thus, the Tisza had a chance to adjust to its new state and approach a new equilibrium (Figure 13).
In contrast, the impacts of revetments and dam do not apply only to the time of their construction but throughout their existence; thus, they continuously disturb the mor- phology and hydrology of the river, making it impossible to reach a new equilibrium state. This situation is well reflected by the hydrological changes of the Tisza, i.e., the loss of equi- librium since the beginning of extensive revetment construction. The non-equilibrium state became more obvious since the 1998flood, as indicated by the newflood records, shifts in the stage–discharge curves, and lower water slope. Despite the Novi Becej Dam, the minimum dis- charge values reached new negative records in 2011 and 2013 along the Lower Tisza, suggesting increased and, conse- quently, more extreme hydrologic variability.
However, the non-equilibrium state is not uniformly expressed along the Lower Tisza, as it seems that the upper section was pushed farther from equilibrium than the lower section. This effect became especially obvious after the 1998flood, as since this time, the upper section has experi- enced larger and longer floods than the lower section (at MindszentHRF:þ18 cm,Df:þ11 d/y compared to Szeged), and its water slope has substantially decreased, despite its remote location from the dam. The smaller damming effect is well represented by the fact that during the last period at the upstream Mindszent gauging station, the duration of low stages was 133 d/y, while at Szeged, it was 0 d/y.
In the last (sixth) period, and especially since 1998, in the narrow channel, the powerfulfloods initiated a new pro- cess in the upper section: the erosion of point bars and revetments. Since the mid-19th century, the number and total length of point bars have decreased dramatically (by 60% and 97%, respectively). In addition, because in the narrow and deep channel, the thalweg has moved closer to the point bars (with silty-clayey layers sloping towards the channel), currently, the point bars are affected by land- slides. Furthermore, according to our latest survey, 31% of the total bank line of the Lower Tisza is actively formed by bank failures, and 23.3% of the revetments are eroded
Figure 13|Conceptual model of the morphological and hydrological responses of the river to various human impacts.
by landslides. The fact that both banks are very often affected by slides reflects the response of the Tisza to the flood conveyance decrease: the river tends to increase its width in order to increase the conveyance capacity of the channel. The very deep channel creates favourable con- ditions for bank failures along both channel margins, and the floods with increased stream power effectively erode the channel, which is possible only by bed scour because of the occurrence of revetments at almost all bends. Thus, afterfloods and during low stages, mass movements modify both banks. Based on these results, the natural or artificial widening of the river channel could help to reduce flood levels by improving flood water conveyance, as was con- cluded byJacobsonet al.()on the Missouri River.
CONCLUSIONS
For society, the most important issues are the increasing flood levels and duration of extremely high and low stages (Lóczyet al.); therefore, all over the world, rivers and their floodplains are trained. However, our research suggests that these measures could sway the rivers towards disequilibrium states.
The studied Tisza River provides a unique opportunity to understand the long-term effects of various engineering works on lowland rivers; thus, the results of the study can be applied to other lowland rivers as well. On the Lower Tisza, engineering works started in the early 19th century, and a monitoring network was established to supply data on hydrological and channel changes; thus, the responses to engineering measures could be analysed with a 140 year-long dataset. After late 19th-century artificial cut-offs, the flood conveyance of the channel increased; however, the levee constructions confined the floodplain, and the flood levels thus increased. The hydrological and morpho- logical response to cut-offs lasted until the 1910s or about 40 years. Therefore, the Tisza River reached a new equili- brium, as there was enough time for channel adjustment, and no simultaneous human impact affected the river.
Later, revetments were built, and as long as they exist, they continuously disturb the fluvial system, resulting in decreased flood conveyance of the channel and increased flood levels. As both cut-offs and revetment constructions
increase bed scour, the level of 50% exceedance prob- ability stages have decreased. Thus, the Tisza is currently in a non-equilibrium state, but the hydraulic and hydrologic changes and the morphological channel alterations reflect a transition towards a new equilibrium state. As non-equili- brium systems often give complex (hydraulic) responses to any disturbing factors (e.g., engineering works, climate change), modelling and risk analysis will be very difficult (Seidouet al.).
Based on our study, the increasing extremes in stages and decreasing water slope, together with the morphological alteration of the channel (incision, disappearance of point bars, increasing mass movements), could be related to the engineering works of the previous decades; therefore, in the future, greater attention must be paid to the indirect con- sequences of various river regulation measures, and engineers should revise their existing practices forflood pro- tection and channel and floodplain management. For example, instead of building new revetments, the channel should be artificially widened, and theflood conveyance of thefloodplains should be improved.
ACKNOWLEDGEMENTS
The research was supported by the Hungarian Research Fund (OTKA 119 193) and the Water@Risk HUSRB/
1602/11/0057 project. The authors are very grateful to the anonymous reviewers for their constructive comments that improved this manuscript.
REFERENCES
Biedenharn, D. S., Thorne, C. R. & Watson, C. C.Recent morphological evolution of the Lower Mississippi River.
Geomorphology34, 227–249.
Bormann, H., Pinter, N. & Elfert, S.Hydrological signatures offlood trends on German rivers:flood frequencies,flood heights and specific stages.Journal of Hydrology404, 50–66.
Chow, V. T.Open-Channel Hydraulics. McGraw-Hill, New York, USA.
Delai, F., Kiss, T. & Nagy, J.Field-based estimates of floodplain roughness along the Tisza River (Hungary): the role of invasiveAmorpha fruticosa.Applied Geography90, 96–105.
Guida, R. J., Swanson, T. L., Remo, J. W. F. & Kiss, T.
Strategicfloodplain reconnection for the Lower Tisza River, Hungary: opportunities forflood-height reduction and floodplain-wetland reconnection.Journal of Hydrology521, 274–285.
Guida, R. J., Remo, J. W. F. & Secchi, S.Tradeoffs of strategically reconnecting rivers to theirfloodplains: the case of the Lower Illinois River (USA).Science of the Total Environment572, 43–55.
Hesselink, A. W., Weerts, H. J. T. & Berendsen, H. J. A.
Alluvial architecture of the human-influenced river Rhine, The Netherlands.Sedimentary Geology161, 229–248.
Ihrig, D.History of the Hungarian River Regulations.
Akadémiai Kiadó, Budapest, Hungary (in Hungarian).
Jacobson, R. B., Linder, G. & Binter, C.The role offloodplain restoration in mitigatingflood river, Lower Missouri River, USA. In:Geomorphic Approaches to Integrated Floodplain Management of Lowland Fluvial System in North America and Europe(P. F. Hudson & H. Middelkoop, eds). Springer, New York, USA, pp. 203–243.
James, N. A. & Matteson, D. S.An R package for
nonparametric multiple change point analysis of multivariate data.Journal of Statistical Software62, 1–25.
Kiss, T., Fiala, K. & Sipos, G.Altered meander parameters due to river regulation works, Lower Tisza, Hungary.
Geomorphology98, 96–110.
Kiss, T., Oroszi, V. G., Sipos, G., Fiala, K. & Benyhe, B.
Accelerated overbank accumulation after nineteenth century river regulation works: a case study on the Maros River, Hungary.Geomorphology135, 191–202.
Konyecsny, K.Flood discharge measurements on the Danube between Szob and Vác in August 2002.MHT XXI Conference 2(10), 1–10 (in Hungarian).
Lászlóffy, W.The Tisza. Akadémiai Kiadó, Budapest, Hungary, pp. 610 (in Hungarian).
Lóczy, D., Kis, É. & Schweitzer, F.Localflood hazards assessed from channel morphometry along the Tisza River in Hungary.Geomorphology113, 200–209.
Marriott, S.Textural analysis and modelling of aflood deposit: River Severn, UK.Earth Surface Processes and Landforms17, 687–697.
McEwen, L. J.River channel changes in response toflooding in the upper River Dee catchment, Aberdeenshire, over the last 200 years. In:Floods: Hydrological, Sedimentological and Geomorphological Implications(K. Beven & P. Carling, eds). Wiley, Chichester, UK, pp. 123–140.
Pinter, A. & Heine, R. A.Hydrodynamic and
morphodynamic response to river engineering documented byfixed-discharge analysis, Lower Missouri River, USA.
Journal of Hydrology302, 70–91.
Pinter, N., Ploeg, R. R., Schweigert, P. & Hoefer, G.Flood magnification on the River Rhine.Hydrological Processes20, 147–164.
Radvánszky, B. & Jacob, D.Prospective climate changes in the drainage area of the River Tisza and their effects on the overlandflow. Application of the regional climate model (REMO) and the hydrological discharge model (HD).
Hidrológiai Közlöny88, 33–42 (in Hungarian).
R Core TeamR: A Language and Environment for Statistical Computing. R Foundation for Statistical Computing, Vienna, Austria.https://www.R-project.org/.
Remo, J. W., Pinter, M. & Heine, R.The use of retro- and scenario-modelling to assess effects of 100þyears river of engineering and land-cover change on Middle and Lower Mississippi Riverflood stages.Journal of Hydrology376, 403–416.
Remo, J. W., Carlson, M. & Pinter, N.Hydraulic andflood- loss modeling of levee,floodplain, and river management strategies, Middle Mississippi River, USA.Natural Hazards 61, 551–575.
Remo, J. W., Ickes, B. S., Ryherd, J. K., Guida, R. J. & Therrell, M. D.Assessing the impacts of dams and levees on the hydrologic record of the Middle and Lower Mississippi River, USA.Geomorphology313, 88–100.
Rinaldi, M. & Simon, A.Bed-level adjustments in the Arno River, central Italy.Geomorphology22, 57–71.
Seidou, O., Ramsay, A. & Nistor, I.Climate change impacts on extremefloods: combining imperfect deterministic simulations and non-stationary frequency analysis.Natural Hazards61, 647–659.
Smith, L. M. & Winkley, B. R.The response of the Lower Mississippi River to river engineering.Engineering Geology 45, 433–455.
Surian, N.Channel changes due to river regulation: the case of the Piave River, Italy.Earth Surface Processes and Landforms24, 1135–1151.
Surian, N. & Rinaldi, M.Morphological response to river engineering and management in alluvial channels in Italy.
Geomorphology50, 307–326.
Vágás, I. & Bezdán, M.Floods of the Tisza. ATIVIZIG, Szeged, Hungary, p. 190 (in Hungarian).
Vorogushyn, S. & Merz, B.Flood trends along the Rhine: the role of river training.Hydrology and Earth System Sciences 17, 3871–3884.
Warner, R. F.Gross channel changes along the Durance River, Southern France, over the last 100 years using carthographic data.Regulated Rivers Research and Management16, 141–157.
Wyzga, B.Impact of the channelization-induced incision of the Skawa and Wisloka Rivers, Southern Poland, on the conditions of overbank deposition.Regulated Rivers Research and Management17, 85–100.
Xia, J., Zhou, M., Lin, F., Deng, S. & Lu, J.Variation in reach- scale bankfull discharge of the Jingjiang Reach undergoing upstream and downstream boundary controls.Journal of Hydrology547, 534–543.
First received 27 June 2018; accepted in revised form 20 November 2018. Available online 21 January 2019