An Interaction-based Scenario and Evaluation of Alternative-Fuel Modes of Buses
András Farkas
Faculty of Business and Economics, Óbuda University Tavaszmező utca 17, H-1084 Budapest, Hungary e-mail: farkas.andras@kgk.uni-obuda.hu
Abstract. The problem of alternative-fuel modes of buses used for public transportation in urban areas is considered. Classification and characteristics of these vehicles are discussed in detail. A multi-criteria decision analysis (MCDA) method called MAROM is used to rank and evaluate the alternative-fuel modes of buses for an empirical study taken from the literature. Numerical results are compared to those generated from a classical MCDA method called TOPSIS. Exploring causal effects, cross-impacts between the fuel modes are formulated and trend projections are made using a dynamic simulation model.
Findings for the expected changes in the characteristics of the alternative-fuel modes in the long-run are then analyzed. Finally, the formal description of the scaling method MAROM is also presented.
Keywords: alternative-fuel modes; multi-attribute decision making; cross-impact analysis
1 Introduction
A characteristic feature of the modern age is the issue of ever growing urbanization. A UN World Urbanization Prospects report projected that 60% (4.9 billion people) of the world’s population will live in urban areas by 2030 [37]. As a sharp illustration of this issue, the urban population in India has increased from 62 million (17% of its total population) in 1951 to 285 million (29%) by 2001, and is estimated to grow to around 540 million (37%) by 2021 [23]. Under such circumstances, increasing attention has been given to urban sustainability over the past decades. The sustainable development of cities largely depends upon a sound urban transportation policy that is capable of drastically reducing air and noise pollution in the urban world in order to preserve human health and the environment [15]. Total transport energy use and carbon emission are projected to be approximately 80% higher than current levels by 2030 [12]. Road transport accountsforby23% ofworldenergy-relatedCO2 emissions (e.g., in 2006 it was reported to be 6.3 Giga tons) [19].
This paper focuses on the modern technology and its applicability to mass transit systems as major contributors to sustainable urbanization. The main parameter in defining alternative-fuel solutions is the fuel mode. Worldwide efforts have made for developments and use of alternative-fuels for buses which possess different characteristics than the traditional ones. This issue has attracted immense interest in recent years; see [12], [17], [22], [25] and [34]. Of the various options available for public transportation, efficient bus systems can be effective and affordable.
Tzeng et al. [34] reviewed the most promising developments of alternative-fuel buses suitable for urban areas and compared them to the characteristics of the conventional internal combustion diesel engine bus. They have presented a comprehensive multi-attribute investigation ofthesealternative-fuel modes with a set of data provided by different groups of Taiwanese experts using the method called TOPSIS (Technique for Order Preference by Similarity to Ideal Solution), which is one of the most popular advanced procedures for evaluating and ranking different alternatives, see [13] and [4]. TOPSIS defines the best option as the one that is closest to the ideal option and farthest away from the negativeidealpoint.
The author of the present paper has considered another concept in his MCDA methodology called MultiAttRibute Object Measurement (MAROM) [8].
MAROM requires that non-quantifiable and quantifiable attributes be treated in different manners. Raw data, either elicited from experts’ judgments or arisen from physical measurements, are preserved for the computations in forms of binary variables, rank numbers and quantitative data depending upon their corresponding scale of measurement, i.e. nominal, ordinal, interval or ratio. This way, they are not subject to any arbitrary transformation onto a higher or a lower order scale. Different units of measurement of the attributes are handled by standardization on those types of scale of measurement where it is necessary.
In this paper we will compare the priority rankings and the performance scores of the alternative-fuel buses resulting fromtheuseofthetwo methods MAROM and TOPSIS when they are applied to the same data set that has been provided in the seminal paper of Tzeng et al. [34]. Furthermore, we intend to reveal deterministic interactions between the alternative-fuel modes, i.e., between their constituting attributes. Utilizing these cross-impacts, a dynamic simulation model called KSIM [14] will be used to make trend projections for the alternative-fuel modes in order to estimate the changes in their characteristics and in the resulting new ranking over a long-term perspective.
The organization of the article is as follows. In Section 2, a technical description of the alternative-fuel vehicles is presented. In Section 3, the set of criteria and the criteria weights are described. In Section 4, the derivation of the MAROM ranking and the scores of the fuel modes with their comparison to those generated from the TOPSIS are discussed. In Section 5, a cross-impact matrix is constructed, the dynamic simulation model is run and the evaluation of the results is presented. In the Appendix, the formal description of the method MAROM is provided.
2 Characteristics and Trends of Alternative-Fuel Vehicles
Based on the excellent work of Morita [20], first, we present an overview about the characteristics and the main directions of engineering developments of automotive power sources to be expected over the next two decades. We mention here that one of the best sources of information on the development of alternative- fuels can be found in the U.S. Department of Energy’s Alternative Fuels Data Center (AFDC) which maintains an “Alternative Fuels Data Base” [1].
Additionally, we refer to the excellent book [3] which treats this subject fully. For grouping public vehicles, Morita [20] suggested to consider four categories of the following types: (i) internal combustion engine vehicles (ICEVs), (ii) electric vehicles (EVs), (iii) hybrid electric vehicles (HEVs) and (iv) fuel cell vehicles (FCVs).
(i) ICEV1 ─ Vehicles with gasoline engines
Their heat efficiency exceeds 50%. Main directions of the developments of these conventional vehicles will focus on the drastic reduction of emission pollutants, especially during the cold engine startup and the warm-up periods. For this purpose, they will be installed with three-way catalysts and computerized fuel injection. The adoption of some new technologies, like the use of manifold catalytic converters, the reduction of heat capacity of exhaust systems, the lean- burn operation immediately after engine startup, the use of high precision oxygen sensors and the predictive control of fuel consumption per cylinder have resulted in the production of a series of ultra low emission vehicles whose outputs are only 13% of the current regulation level [20]. Furthermore, a direct-injection engine (e.g. Mitsubishi’s GDI engine through a thinner air fuel mixture) has approached the same efficiency as that of the direct-injection diesel engine under low load conditions [16]. The reduction of nitrous oxide (NOx) occlusion, however, is an issue that seems to be far from resolved.
(i) ICEV2 ─ Vehicles with diesel engines
Professional engineers view diesel engines as the most efficient ones of all internal combustion engines (more than 55% heat efficiency). Large efforts have recently been started to significantly reduce their particulate matter (PM) and nitrogen oxide (NOx) emissions via modifications of the engine mechanism, e.g., by using an inter-cooler turbocharger and cooled exhaust gas recovery (EGR) [20]. New NOx occluding catalysts have already been developed which are capable of reducing PM and NOx emissions by more than 80% [33]. This exhaust after- treatment system requires low-sulfur fuel (a cut to 10% of the present level), since sulfur compounds in the fuel poison the catalyst. Such exhaust processing units in diesel engines are very likely to be installed in the near future. Additionally, the installation of a common-rail computerized high-pressure fuel injector will
enhance the controllability of fuel injection and fuel spray [20]. Improvements for diesel engines are likely in both engine systems and fuels, and thus, the negative image of diesel engines as emitters of dirty and harmful materials and chemicals could be lessened.
(i) ICEV3 ─ Synthetic fuel engine vehicles
There is a variety of research for synthetic fuels which can be used to power diesel engines. For example, dimethyl ether (DME) can reduce the discharge of soot, since it contains oxygen [11]. Methanol can also be made into ether (MTBE), then blended with gasoline to increase octane. Methanol and ethanol are clear, colorless liquids, i.e., alcohols which are made primarily from natural gas, but also from wood, coal and biomass. These fuels are suited to infrastructures for diesel oil and LPG after a slight modification only [31]. Bio-diesel (mono alkyl esters) is made from natural sources such as vegetable oils and animal fats. Their emission properties are better than those of the conventional diesel engines, since they give a substantial reduction of unburned hydrocarbons (HC), carbon monoxide (CO) and PM. Much of the current interest in bio-diesel production comes from soy- bean producers (e.g., Soy Diesel in the US). Their use as a fuel is intended for bus fleets [18]. The synthetic fuel engines reduce vehicle emissions of pollutants and greenhouse gases significantly.
(i) ICEV4 ─ Natural gas engine vehicles
Natural gas (NG) is a mixture of HC, mainly methane (NH4), produced either from gas wells or together with oil production. It has clean-burning qualities, awide resource base and commercial availability to users. NG must be stored on a vehicle’s board as either compressed natural gas (CNG) or liquefied natural gas (LNG). The on-board fuel storage of cylinders is much stronger than gasoline fuel tanks and is subjected to continuous heat, pressure and fires tests. Natural gas is widely distributed in many countries, e.g., in the US, Canada, Japan and Russia, through extensive pipeline systems. In Japan, by using a ceramic combustion chamber, Isuzu Inst. has achieved a heat efficiency of 39% and they aim to further improve by collecting exhaust energy with a turbine generator to shield heat [21].
NG has numerous benefits, e.g. less pollutants, greenhouse gases, safety and general abundance. These vehicles would work best with mass transit vehicles.
Their costs are an average of 15-40% percent less than gasoline and diesel vehicles, including maintenance. The emissions of CO content are 70% and NOx
contents are approximately 88% lower than those of the diesel buses.
(ii) EV ─ Electric vehicles
A zero-emission alternative to petroleum is the electric motor driven vehicle, an option currently used in many towns with electric-cable buses. Recent technology, however, uses electricity independently of a fixed electric cable with a fuel cell or battery storage. Its big appeal is having a clean and quiet operating system. Under low-load conditions some metropolises have begun to employ electric buses, but
their future is uncertain, mainly because of the high costs [6]. The key weaknesses of the EVs are the time needed to recharge the batteries, the lack of support infrastructure and the short cruising distance (~200 km). If, however, much bigger batteries are installed, these would add to the vehicles’ weight considerably. In general, a major shortage is in this respect that batteries are expensive and, therefore, account for a large proportion of vehicle costs. Rapid-charge batteries with vastly improved energy density may appear only in the distant future.
Thereby, battery-electric buses seem to be feasible in low-kilometer circulator routes in the central business district (especially micro EVs) [9].
(iii) HEV1 ─ Series hybrid electric vehicles
A series HEV uses the engine driving force after converting it into electricity via a generator. In general, useful properties of HEVs are regeneration of braking energy, engine shutdown instead of idling, and engine driving under high-load conditions (reduction of low-load driving time) [20]. The main advantage of a series HEV is that the engine driving range can be easily optimized compared to other systems, since the engine and the axle are not linked mechanically.
However, this system has high energy losses, since the system transmits energy through several modules: the engine, the generator, the battery and the electric motor. The fuel efficiency of a series HEV is better than that of a conventional diesel vehicle under low-speed, low-load conditions, whereas engine efficiency is reduced and average speeds are lower. Therefore, this system is suited to urban driving patterns where stop-and-go at low speeds is common. It will be adopted in city buses in the future.
(iii) HEV2 ─ Parallel hybrid electric vehicles
The main attractiveness of a parallel HEV is that it lends itself a better fuel efficiency than a conventional vehicle, regardless of the driving conditions, since it applies the engine’s motive force directly during high-load driving. If engine fly- wheels are replaced with relatively low-powered electric motors, such as in Honda’s Insight, the mechanism becomes simpler, since the conventional starter and alternator can be replaced with an electric motor [27]. Furthermore, itcan utilizetheconventional power transmission system between the transmission and the driving wheels, and the use of heavy, costly batteries is then minimized. These advantages and a standardization of manufacturing parts reduce production costs.
A good example is Toyota’s Crown hybrid which has an extremely simplified hybrid system that uses 42 Voltage for its auxiliary power system (this will be the standard voltage in the European Union).
(iii) HEV3 ─ Series/parallel hybrid electric vehicles
The series/parallel HEV is a combination of the above two hybrid systems and has been actively developed and marketed in Japan and in the US. This system performs efficiently regardless of the driving conditions, since it is powered by the electric motor under low-speed, low-load conditions and by the engine under high-
speed, high-loadconditions. Inmanycases,adedicatedhybrid transmissionhasto be installed (e.g., a CVT that uses a planetary gear system used in Toyota’s Prius, and a belt system CVT that is adopted in Nissan’s Tino hybrid). The system developed by Hino comprises a very simple design in which one engine and two electric motors are arranged concentrically [38]. The design and control of the transmission are regarded as the key to the success of the series/parallel HEV.
(iv) FCV ─ Fuel cell (hydrogen) vehicles
Professionals think of a fuel cell as the ultimate form of public vehicles [20].
Recent interest in hydrogen as a substitute for gasoline and diesel in the transportation market is primarily due to two reasons: (a) hydrogen fuel is essentially limitless, as hydrogen can be gained by electrolyzing water (with the use of renewable energy technologies), and (b) hydrogen fuel is clean-burning, as the oxidation of hydrogen yields only water. Hence, many organizations and governments expect hydrogen to meet a larger share of global energy use in the coming decades [36]. Fuel cells use hydrogen as fuel, but hydrogen is not suitable for on-board storage. Fuel cells generate electricity on board the vehicle in a compact assembly for powering the vehicle from an electrochemical reaction between hydrogen and oxygen under controlled conditions. The only waste in this process is water vapor. The use of indirect hydrogen carriers, such as methanol, gasoline, natural gas and then extracting their hydrogen are currently being studied by researchers [6]. For example, Toyota has introduced a compact methanol reformerwhichcombines an evaporator, an external reformer and a CO eliminator.
The internal reformer, which uses direct methanol fuel cells, has a performance output of 6 kW and an efficiency of 40%. Hydrogen’s energy density is very low when compared to methanol and especially to gasoline. Therefore, it requires very large, heavy tanks on board which is undesirable for a compact, lightweight vehicle. Researchers agree, however, that using hydrogen as a fuel for mass transit would be advantageous in large buses refueling at a central location. Thus, the on- site NG and a system in which the NG is transported through pipelines to independent refueling stations seem to be the most likely technologies in 15-20 years [36]. In the latter, the NG is reformed to H2 using an on-site, stationary steam reformer. The H2 is stored as a compressed gas and dispensed into direct hydrogen FCVs. From a vehicle perspective, this technology configuration is similar to the on-board hydrogen alternative.
Tzeng and his co-authors considered 12 alternative-fuel modes of buses for public transportation in their seminal paper [34]. We will utilize these twelve choices for the types of alternative-fuel vehicles, denoted them as AFV_k, k=1,…,12.
AFV 1: Conventional Diesel Engine—CD
The diesel engine still is one of the major contenders as a power source in the 21st Century. Its main advantages are low purchasing costs, flexibility to the speed of traffic and low sensitivity to road facility. However, it has very high exhaust
emission rates (PM, NOx, CO, CO2). This vehicle is introduced in the set of alternatives in order to compare it with the new fuel modes.
AFV 2: Compressed Natural Gas—CNG
Interest for natural gas as an alternative fuel arises from its clean-burning qualities and its wide resource base. Natural gas has numerous benefits in terms of pollutants, comfort, and general abundance. CNG vehicles emit only slight amounts of CO and CO2, they have high-octane value and they cost less than diesel buses. Meanwhile, natural gas vehicles are saddled with problems in many countries such as supply, distribution and especially risk of explosion.
AFV 3: Liquefied Propane Gas—LPG
There are countries that use this mode of fuel for public transportation. In Japan, Italy and Canada, 7% of transit buses are powered by LPG, and several European countries are planning to employ LPG vehicles, due to pollution considerations.
AFV 4: Fuel Cell (hydrogen) —FC (H)
Research on a fuel cell-hydrogen bus has already been concluded with success.
Test results with the experimental vehicle operating on hydrogen fuel indicate that this vehicle has a broad surface in the burning chamber, low burning temperature, and the fuel is easily inflammable. No detrimental substance is produced and only pure water, in the form of vapor, is emitted. A fully loaded fuel tank can last as far as 250 km.
AFV 5: Methanol—MET
The fuel of methanol is related to vehicles withgasoline engines. The combination rate of methanol inthe fuel is 85% (so-called M85). The engine can runsmoothly with any combination rate of gas with methanol, and methanol will act as an alternative fueland help to reduce the emission of black smoke and NO2 as well as pollutants and greenhouse gases. Fuel stations providing methanol are already available in several countries. The thermal energy of methanol is lower than that of gasoline, and the capability of continuous travel by this vehicle is inferior to that of conventionalvehicles.
AFV 6: Electric Vehicle - opportunity charging—E-OC
The source of power for the opportunity charging electric vehicle is a combination of a loaded battery and fast opportunity charging during the time the bus is idle.
Whenever the bus starts from the depot, its battery will be fully charged. During the 10-20 sec when the bus is stopped, the power reception sensor on the electric bus (installed under the bus) will be lowered to the charging supply plate installed in front of the bus stop to charge the battery. Within 10 sec of a stop, the power supply is done, so that the battery is charged with 0.15 kWh, which is adequate for it to move to the next bus stop.
AFV 7: Direct Electric Charging—E-DEC
The big appeal of electricity is a clean and quiet operating system. This is to be contrasted to its high costs and short cruising distance. The power for this vehicle comes from a loaded battery. Once the battery power is insufficient, the vehicle will have to return to the plant to conduct recharging. The development of a suitable battery is critical for this mode of vehicle.
AFV 8: Electric Bus with Exchangeable Batteries—E-EB
Here, the goals are to accomplish a fast battery charge and achieve a longer cruising distance. The bus is modified to create more on-board battery space, and the number of on-boardbatteriesisadjustedtomeettheneedsofdifferentroutes.
The fast exchanging facility has to be ready to conduct a rapid battery exchange.
AFV 9: Hybrid Electric Bus with Gasoline Engine—HE-G
The electric-gasoline vehicle has an electric motor as its major source of power and a small-sized gasoline engine. When electric power fails, the gasoline engine can take over and continue the trip. The kinetic energy rendered during the drive will be turned into electric power to increase the cruising distance of these vehicles.
AFV 10: Hybrid Electric Bus with Diesel Engine—HE-D
The electric–diesel vehicle has an electric motor and small-sized diesel engine as its major source of power. When electric power fails, the diesel engine can take over and continue the trip, while the kinetic energy rendered during the drive will be turned into electric power to increase the cruising distance of these vehicles.
AFV 11: Hybrid Electric Bus with CNG Engine—HE-CNG
The hybrid electric-CNG vehicle has an electric motor and a small-sized CNG engine as its major source of power. When electric power fails, the CNG engine takes over and provides the power, with the kinetic energy produced converted to electric power to permit continuous travel.
AFV 12: Hybrid Electric Bus with LPG Engine—HE-LPG
The hybrid electric-LPG vehicle has an electric motor and a small-sized LPG engine as its major source of power. When electric power fails, the LPG engine takes over and provides the power, with the kinetic energy produced converted to electric power to permit continuous travel.
3 Weighting of Criteria and Evaluation of Alternative-Fuel Modes of Buses
Tzeng et al. [34] used the following 11 single criteria to evaluate the alternative- fuels of buses:
C 1: Energy supply ─ Annual costs of supply, storage and fuel
C 2: Energy efficiency ─ Energy consumption related to fuel heating value C 3: Air pollution ─ Chemical substance harmful to health
C 4: Noise pollution ─ Noise produced during operation
C 5: Industrial relationship ─ Impact on other locomotive industry branches C 6: Costs of implementation ─ Costs of production, purchase, implementation C 7: Costs of maintenance ─ Annual costs of maintenance
C 8: Vehicle capability ─ Cruising distance, gradeability, speed of vehicle, etc.
C 9: Road facility ─ Necessaryfeaturesofroadforthebus,e.g.pavement, slope C 10: Speed of traffic flow ─ Conformity to traffic flow
C 11: Sense of comfort ─ Traveling comfort and aesthetic appeal
In Table 1, the normalized average weights (relative importance of each criterion) are indicated [34, p.1377]. These weights were determined by several groups of Taiwanese experts using the AHP method [26].
Table 1
Criteria weights and results of the value assessment for the alternative-fuel vehicles [34]
C 1 C 2 C 3 C 4 C 5 C 6 C 7 C 8 C 9 C 10 C 11 Weight 0.0313 0.0938 0.1661 0.0554 0.0629 0.0829 0.0276 0.1239 0.0805 0.1994 0.0761
AFV 1 0.82 0.59 0.18 0.42 0.58 0.36 0.49 0.79 0.81 0.82 0.56 AFV 2 0.77 0.70 0.73 0.55 0.55 0.52 0.53 0.73 0.78 0.66 0.67 AFV 3 0.79 0.70 0.73 0.55 0.55 0.52 0.53 0.73 0.78 0.66 0.67 AFV 4 0.36 0.63 0.86 0.58 0.51 0.59 0.74 0.56 0.63 0.53 0.70 AFV 5 0.40 0.54 0.69 0.58 0.51 0.52 0.68 0.52 0.63 0.60 0.70 AFV 6 0.69 0.76 0.89 0.60 0.72 0.80 0.72 0.54 0.35 0.79 0.73 AFV 7 0.77 0.79 0.89 0.59 0.73 0.80 0.72 0.47 0.44 0.87 0.75 AFV 8 0.77 0.79 0.89 0.59 0.73 0.80 0.72 0.51 0.48 0.87 0.75 AFV 9 0.77 0.63 0.63 0.52 0.66 0.63 0.65 0.67 0.70 0.80 0.74 AFV 10 0.77 0.63 0.51 0.58 0.66 0.63 0.65 0.67 0.70 0.80 0.74 AFV 11 0.77 0.73 0.80 0.48 0.63 0.66 0.65 0.67 0.71 0.62 0.78 AFV 12 0.77 0.73 0.80 0.48 0.63 0.66 0.65 0.67 0.71 0.62 0.78
In Table 1, the averages of the assessed values for the performance of each of the alternative-fuel modes with respect to every criterion are also presented. These values, denoted by uij, 0 ≤ uij ≤ 1, are taken from [34, p.1378]. They have been derived through conducting a survey by applying a Delphi procedure that was repeated twice [34]. The experts represented manufacturing industries, energy committees, governmental departments, research institutes and academic faculties.
4 Comparison of the Results from TOPSIS and MAROM
The following achievements were first published in [7]. The MAROM procedure (see Appendix) requires that nature of the data for each criterion be adequate to the properties of the type of the scale of measurement to which these data correspond. Therefore, as its first step, each criterion should be assigned to the appropriate scaleofmeasurement. Besides, the number of criteria was extended from 11 to 15, because in the article of Tzeng et al. [34] some additional information is presented which were not directly captured by their analysis. This supplementary data relates to a number of relevant engineering and chemical characteristics of alternative fuels which originated from reliable sources (physical measurements) and are presented in [34, p.1382–1383] with their accompanying units of measurement.
To preserve the uniformity of the two data sets as much as possible (which were used by Tzang et al. [34] and the present author; see Table 1 and Table 2) only minimal changes have been made. This way, criteria C4, C5, C9, C10 and C11 of the original data set have been retained, but they were assigned to ordinal scales so that their original performance values, uij,see in Table 1, were converted to rank numbers using a nine-grade ordinal scale [1, 1.5, 2, 2.5,… , 5], where an ideally best performance, if there exists any, would receive grade 5.
Utilizing the technical data collectedby[34], several new criteria were introduced.
As seen in Table 2, these are: ‘Depot’, which can be small or large characterizing the depositary needs of the buses, as a nominal variable [0 or 1],while‘Cruising distance’,‘Number of passengers’,‘Maximumspeed’ for urban/suburban services and ‘Recharge time’ are ratio scale variables with specific units of measurements.
They constitute the extended form of the “old” criterion ‘Vehicle capability’
whose weight has been uniformly allocated to them. The “old” criterion ‘Energy efficiency’ is a dimensionless variable, since it gives the ratio of the alternative- fuel efficiency/fuel heating value related to that of the diesel bus, and hence, it is reasonable to assign it to an interval scale. For some ratio-scaled criteria, i.e., for the different ‘Costs’, ‘Exhaust emission’ and ‘Recharge time’, obviously, the smaller values represent the better performances.
Table 2
Input data of the alternative-fuel vehicles for MAROM [7]
AFV1 AFV2 AFV3 AFV4 AFV5 AFV6 AFV7 AFV8 AFV9 AFV10 AFV11 AFV12
Nominal Aggregated weight of nominal scale 0.0666 scale Criterion weight 0.0248
Best value on nominal scale for criterion C1 1
1.Depot 1 0 0 1 1 0 0 0 0 0 0 0 Ordinal Aggregated weight of ordinal scale 0.3333
scale Criteria weights 0.0805 0.0554 0.0629 0.1994 0.0761
Best values on ordinal scale for criteria C2-C6 4.0 3.0 3.5 4.5 4.0
2.Road facility 4.0 4.0 4.0 3.0 3.0 1.5 2.0 2.5 3.5 3.5 3.5 3.5 3.Noise pollution 2.0 3.0 3.0 3.0 3.0 3.0 3.0 3.0 2.5 3.0 2.5 2.5 4.Indust. rel.ship 3.0 3.0 3.0 2.5 2.5 3.5 3.5 3.5 3.5 3.5 3.0 3.0 5.Speed of traffic 4.0 3.5 3.5 2.5 3.0 4.0 4.5 4.5 4.0 4.0 3.0 3.0 6.Sense of comfort 3.0 3.5 3.5 3.5 3.5 3.5 4.0 4.0 3.5 3.5 4.0 4.0 Interval Aggregated weight of interval and ratio scales 0.6000
scale Criterion weight 0.0938
Best value on interval scale for criterion C7 10.9 Worst value on interval scale for criterion C7 0.7
7.Energy efficiency 1.0 0.8 0.7 1.9 0.8 10.9 5.5 3.2 1.5 1.5 1.5 1.5 [dim.less]
Ratio Criteria weights 0.0313 0.1661 0.0248 0.0248 0.0248 0.0248 0.0248 0.0829 0.0276 scale Best values on scale for criteria C8-C15 3875 0.30 500 80 120 10 100000 10410 Worst values on scale for criteria C8-C15 46600 30.15 80 40 60 360 624000 30720 8.Fuel costs 14000 11450 15000 46600 14495 3875 4000 8000 7880 7450 7250 7300 [1000 NT$]
9.Exhaust 30.15 19.27 8.2 6.78 12.71 0.30 0.35 0.38 9.97 11.25 10.30 10.55 emission (PM+NOx+HC+COx) [%]
10.Cruising 450 500 400 325 225 100 80 220 250 250 350 350 distance [km]
11.Number of 80 70 70 60 60 50 40 40 50 50 55 55 passengers [No]
12..Max speed 120 80 90 75 110 60 65 65 70 70 75 75 [km/h]
13.Recharge time 10 200 100 10 10 360 300 300 360 360 360 360 [min]
14.Costs of 100000 420000 300000 624000 144000 340000 360000 380000 400000 420000 440000 450000 implementation [1000 NT$]
15.Costs of 11400 10410 12500 30720 14700 18495 19600 19200 22200 22400 23500 23800 maintenance [1000 NT$]
It is hoped that using this slightly modified data base for the evaluation problem will provide us more robustandreliable results. Table2presentsthe reformulation
of the original data set that meets the requirements of the theory of measurement.
In this table, the input data for MAROM, i.e., the characteristic values for the 12 alternative-fuel buses, the 15 single criteria weights and the aggregated weights for the different scales of measurement are indicated.
The results of the multi-criteria evaluation of the 12 alternative-fuel buses are shown in Table 3. Here, both the ranks and the evaluation indices called relative standings (scores) yielded by using TOPSIS (basic and compromise solutions) and MAROM (for the individual and the aggregate weighting cases) are indicated. The scores appear on [0 –1] interval scales.
Table 3
Comparison of the rankings and the evaluation scores for TOPSIS [34] and MAROM [7]
TOPSIS MAROM
Rank Score Rank Score Rank Score Rank Score
Basic Compr. Indiv. Aggreg.
Electric bus with exchangeable batteries 1 0.945 1 0.975 5 0.514 4 0.675 Electric bus with opportunity charging 2 0.933 3 0.964 7 0.498 3 0.677 Electric bus with direct charging 3 0.931 2 0.967 4 0.514 2 0.681 Hybrid electric with gasoline engine 4 0.749 9 0.756 9 0.482 7 0.630 Hybrid electric with CNG engine 5 0.700 4 0.889 11 0.449 11 0.599 Hybrid electric with LPG engine 6 0.700 5 0.889 12 0.448 12 0.599 Hybrid electric with diesel engine 7 0.700 11 0.488 8 0.484 8 0.629 Fuel cell (hydrogen) 8 0.563 6 0.865 3 0.733 10 0.601 Methanol 9 0.527 10 0.698 1 0.791 1 0.691 Compressed natural gas engine (CNG) 10 0.399 7 0.830 10 0.467 9 0.611 Liquidate propane gas engine (LPG) 11 0.345 8 0.830 6 0.499 5 0.670 Conventional diesel engine bus 12 0.301 12 0.097 2 0.785 6 0.650
As it does not come as a surprise, the two methods have produced rather different rankings and scores. Comparisons of the findings, however, should be made very carefully. As a remarkable outcome, observe the big differences in the ranks of the conventional diesel engine bus. The last position of the diesel engine in the TOPSIS rankings seems to be rather strange regarding the fact that Tzeng et al.’s investigations refer to the year 2005. It is also striking that there are significant differences in the priority scores of the alternative-fuel modes produced by the two methods. We intend not to go into detailed technical explanations, only to mention that we believe that the MAROM ranking reflects better the situation existing at that time than that of TOPSIS. The relative high positions of the conventional diesel engine bus in the MAROM rankings as opposed to those obtained for the
n
j j i j i
i c qq q i n
dt dq
i 1
, ,..., 1 ,
ln
. ,..., 1 ,
)]
( [ )
(
1
0 f q d i n
q t q
n j
j i
i
alternative-fuel modes follows mainly from the tardiness of the required engineering developments and the limited bus manufacturing capabilities as well as the weak achievements of the civil initiatives concerning environmental protection. However, there is no doubt as urban mass transit technology gets stronger and improves, more buses will be powered by alternative means in the search for more efficient energy use, cleaner air, quieter operation, more safety and more traveling convenience, especially, if they could efficiently serve in suburban areas as well.
5 An Alternative-Fuel Mode Scenario for Buses and Its Evaluation
Hereafter we will consider each alternative-fuel mode as being a quantity Q (a compound construct, as each AFV constitutes 15 variables). These attributes are listed in Table 2. Furthermore, the set of the alternative-fuel buses are regarded an interrelated complex system as it is apparent that in the course of their evolution they interact with one another. At this point, a question of vital importance can be raised. Namely, how the characteristics of these alternative-fuel modes will change and what will their spread in public transportation means look like over the successive two decades. To make technology assessments and study the dynamic behavior of this system, we now attempt to employ a dynamic model based on simulation [14].
Kane procedures for modeling such systems require that we specify a set of quantities Q (AFVs in our case); a set of binary interactions C, between any two pairs (qi,qj), i,j=1,…,n, including possible self-interactions, defined on Q×Q; and a set of initial values for each of the quantities qi, denoted as qi0 (individual scores from MAROM as given in the third column of Table 3). This model conforms well to our problem, since all variables qi are bounded 0 < qi(t) < 1 for all i=1,…,n, and for all t>0, and, thus, no rescaling is needed. The projected trends of the variables (AFVs) are of sigmoidal type as the solution of the following differential equation (for small Δt time increments, i.e., for one iteration in the simulation):
where cij is a binary interaction coefficient of qj upon qi. From this equation, it becomes clear that qi accumulates the effect of qj, since it is easy to see that [2]:
Observe that the structure of the model does not imply that the interaction coefficients were constants. Their behavior is just the contrary, since they are varying with time; see [10] for more details. Properties of theKSIMsimulation model are as follows [14]:
(i) System variables are bounded. In an appropriate set of units these can always be set to one and zero.
(ii) A variable increases or decreases according to whether the net impact of the other variables is positive or negative.
(iii) A variable’s response to a particular impact decreases to zero as that variable approaches its upper or lower bound. Bounded growth and decay processes exhibit a sigmoid type character.
(iv) All other things being equal, a variable will produce greater impact on the system as it grows or it declines larger.
(v) Complex systems are described by a network of binary interactions.
In order to gain insight into the conjectures of pairwise causal relationships of deterministic type between the AFVs, the actual interaction coefficients were revealed following extensive research of related literature and juries of executive opinion. If the cij coefficients are generated through some kind of Delphi procedure, the respondents, in justifying a nonzero assignment to a particular cij
may provide an intuitive argument for, and thus a possible explanation of, the claimed casual relationship. While the cij’s individually are not exploratory in nature, the matrix called cross-impact matrix, C=[cij], as a whole represents a coherent pattern of causality assertions. For our case, it has the form:
CD CNG LPG FC MET ELO DEL HGD HCL OW ↓ ↓ ↓ ↓ ↓ ↓ ↓ ↓ ↓ ↓
C
CD
CNG LPG FC MET ELO DEL HGD HCL
0 0 0
0 0 0 0 0
0 0 0 0 0
0 0 0 0 0 0
0 0 0 0 0 0 0
0 0
0 0
0 0
0
.
To construct matrix C, interviews with several experts’ groups (formed from the researchers of different faculties of transportation engineering at the Technical University of Budapest) were conducted and repeated three times to achieve a compromise decision to confirm structure. To simplify our system we have merged similar AFVs having the same individual scores: Direct electric charges ─ Electric bus with exchangeable batteries (DEL); Hybrid electric bus with gasoline
─ diesel engines (HGD) and Hybrid electric bus with CNG ─ LPG engines (HCL). In matrix C, at each cell, the action of (a positive change in) the column heading upon the row heading is entered. A nonzero diagonal complies with the idea that technology tends to foster its own growth usually (self-interaction).
Notice that the entries of this matrix are combinations of pluses and minuses, rather than numerals to accentuate the subjective nature of the judgmental procedure. For the strength and direction of the interactions they indicate a weak, or a slight, or a moderate, or a firm or a strong positive and/or a negative impact, respectively. Observe that the cross impacts are not necessarily symmetric. As a unique feature of this model, an extra column for expected actions from the outside world (OW) is also added for external interventions, new international standards and regulations,users’acceptance, civilcampaigns,etc. The entries in matrix C can be subjected to debate, and then, one would argue for different choices. Therefore, we stress that our cross-impact matrix C defines only one possible option for a well-established system of interactions of the AFVs.
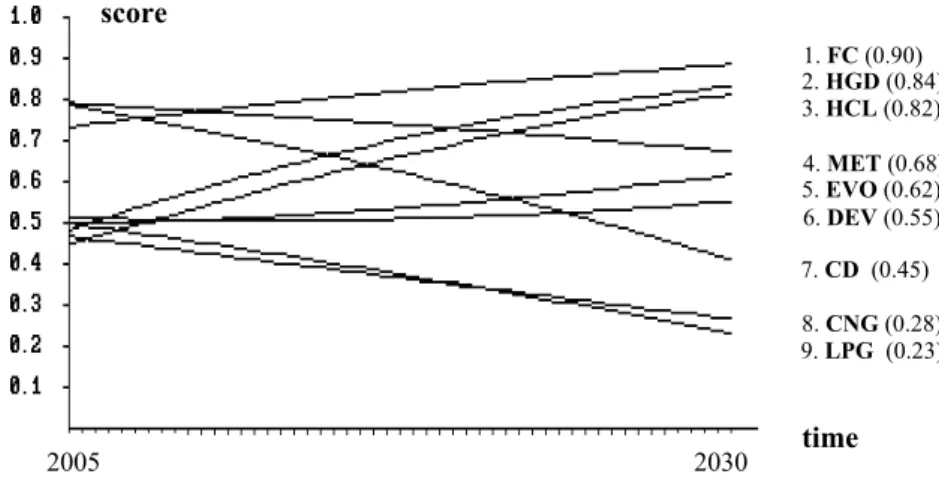
Figure 1 exhibits the projected trends of interactions as given by matrix C over a two decade time horizon after completing 50 simulation runs. Tendency and the changes in the alternative-fuel modes could be analyzed from this scenario by keeping in mind that any change in the behaviour of an impacted AFV is a result in the common effect of its self-development and the changes in its constituting variables caused by the total impact of the changes in the impacting AFVs, as well as different external factors, i.e., new international regulations, users’ concerns, etc. As is seen in Figure 1, by 2030, the Fuel cell (hydrogen) bus will take over the
“lead” before the Hybrid electric buses operating with gasoline/diesel engines and the Hybrids with CNG/LPG engines. The performance score of the diesel bus will decline significantly. Similar decays can be observed for the CNG and LPG buses.
Figure 1
Projected trends and scores from the interactions as given by matrix C
1. FC (0.90) 2. HGD (0.84) 3. HCL (0.82)
6. DEV (0.55) 7. CD (0.45) 8. CNG (0.28) 9. LPG (0.23) 4. MET (0.68) 5. EVO (0.62)
2005 2030 time
score
The projected trends of this model in Figure 1 reflect the international directions in terms of both technological developments and environmental protection fairly well. Japanese manufacturers are seriously investing in hybrids, what they see as a promising market segment. US manufacturers are starting to use hybrids to disguise the environmental impacts of vehicles that consumers want. European manufacturers respond to the market’s need for high performance and less polluting vehicles by investing in diesel technologies and tend to ignore or dismiss hybrid technology as an overly complicated half-solution that introduces excess weight and hampers performance. Instead, they intend to favour fuel cell research as the way forward. In their view, hybrid buses are only a medium-term interim solution filling the gap until a more efficient technology, ideally fuel cell buses mature and become available [32]. It should be mentioned that the struggle to reduce vehicle emission has strongly speeded up recently. As an illustration for this, the bus emission standards for NOx and PM in the US and in the EU have become much more rigorous between 2000 and 2010, i.e., the NOx emission in [g/kWh] should be reduced from 5.8 down to 0.16 and from 5.0 down to 2.0, respectively and the PM emission from 0.075 down to 0.0075 and from 0.1 to 0.02, respectively [35]. Technical limitations of electric and hybrid vehicles are mainly related to capacity, durability and price conditions of the batteries. In summary,ourprojectionsforAFVsarefairlyclosetothosescenariosreportedby the European Commission [24], with the small exception that the CNG vehicles’
performance and thus the popularity of their use in public transport seem to be a little bit under-estimated by the year 2030.
Conclusions
In this paper, current status and future developments of alternative-fuelmodesof buses have been reviewed. Two MCDA scaling methods, TOPSISandMAROM, have been compared by applying them to the same empirical example, the qualification of alternative-fuel buses operating in urban areas. Although the results produced by the two methods were quite different, both approaches have shown that the use of alternative-fuel modes to improve human health and the environmentoffershugeopportunitiesfor ensuring sustainable urban development.
An interaction-based simulation model was applied to the system of alternative- fuel modes of buses to project the expected changes in the main characteristics of these public transportation means. We conclude that the technological developments of hybrids look positive, but their market potential is quite questionable. However, hybrids can be an important supplementary technology.
Policy makers are seeking for long-term technological solution to decrease fuel consumption, dependence on petroleum, carbon dioxide, carbon monoxide and other exhaust fumes emission while seriously investigating the options for the transition to hydrogen-based technologies in the long-term.
Appendix
The formal description of the method MAROM is presented below:
Consider the following data matrix:
A a [ ],
iki 1 2 , .., ; m k 1 ,..., , n
(1) involving n options (alternatives). The n columns give for every option the values of m variables (row vectors) denoting various characteristics (attributes, criteria) of these alternatives. In (1), a value (crisp number) is assigned to each entry aikwhich is either elicited from respondents’ judgments or arisen from physical measurements. Thereby, the nature of a particular data may be of a subjective type (qualitative) and/or an objective type (quantitative). A column vector ak of matrix A represents a composite vector ak=(ak(N), ak(O), ak(I), ak(R)) which is partitioned into four blocks. Thus, A consists of variables of mixed type, where the superscript N refers to nominal (usually binary), O to ordinal, I to interval and R to ratio variables. Of course, in a concrete real-world case, variables of any type may be missing.
An additional column vector, denoted by b, called a reference vector, is to be constructed which represents an ideal (hypothetical) option, entries of which are composed of the “best” values of the set of alternatives with respect to each attribute. It has the same element-wise structure as that of vector ak. Applied numerical scales are: nominal: [0,1]; ordinal: [1,…,5]; (linear) interval and/or ratio scales: [actual data emerging from measurements].
Because the ratio scale (and sometimes interval) variables have usually different units of measurements the row vectors ai(R)T (and ai(I)T) are standardized so that their means are equal to 0 and their standard deviations are equal to 1. E.g., for the ratio variables, these standard deviations can be obtained as
si aik(R) aik , i ,..., ; k ,..., .
i m i
k (R) (R)
(R) (R)
(R) (R)
(R) (R)
n n m n
1 1
2 1
1 1
2 1 1
(2) With (2), the standardized elements are
aikR s a a i ; k
i
R ik
R i
R m n
'( ) ( )
( ) .
(
( ))
, ,..., ,..., . 1
1 1
(3) A representative group of respondents (experts, customers, users, etc.) is then formed. Every committee member should evaluate each alternative by supplying his judgments on each qualitative variable with respect to the nominal and ordinal scaled criteria. It is recommended that the number of voters l, l =1,…,q, to be at least 10 persons.
The multi-attribute decision making model for preference measuring is as follows
dkl w dil k n l q
i m
ki l
k
l
1 , 1,..., ; 1,..., ,
(4)
where ÷kl is the overall distance of alternative k from the “ideal” alternative for the lth voter; wli is the weight of attribute i; dki is the distance of the kth alternative (object) from the reference point on attribute i; k is the value of an error random variable which may include model misspecification, measurement errors and respondents’ uncertainties. To determine the weights of the attributes, wli, i=1,…,m, the analytic hierarchy process (AHP) method is proposed [26]. These weights are then usually normalized, so that nk=1wli =1.
The distance measure dki in Eq. (4) takes on different functional forms for alternativek:
(a) For the nominal vectors, dki(N)(aki(N),b(N)), denoting them simply as x,y є N, the distance measure is the Tanimoto (also called Jaccard) coefficient [29]:
dki( )N ( , )x y ,
1
where
min( , ),x yi
x ,
y , iN.i i i
i i
i
(b) For the ordinal vectors dki(O)(aki(O),b(O)), denoting them simply as x,y є O, the distance measure is the Soergel number [28]:
d x y x y x y
x y x y i O
ki
O i
i i
i i
i i
i i i
i i
i i
( )( , ) min( , )
min( , ) , .
2
(c) For the interval vectors and the ratio vectors, dki(I,R)(aki(I,R),b(I,R)), denoting them as either x,y є I, or x,y є R and introducing the L2 norm of a vector x,
x xi x x i I i R
i 2
2 T , , or ,the distance measure is the well-known Euclidean-metric:
dki( , )I O( , )x y x y 2 (x y ) (T x y ).
Since the metric properties hold for the above distance functions (a), (b) and (c) used in model (4) (see the proofs in [30]), therefore, the additive type composite vector ÷kl is also metric. Furthermore, it is unique and for each of the partial vectors of the distances: 0 dki(ak()T,bT) 1. The distance between any two composite vectors is proportional to the degree of intensity. The proportionality unit is taken to be 1.
Once the pairwise distances between each composite vector and the reference vector have been determined, then, with the (column) vector of the relative standings (scores), denoted as s=(sk), k=1,2,...,n, the overall priority ranking of the alternatives yields as the order given by the components: sk=1─dk. To establish
either a [0─1] or a [1─100] interval scale for the overall priority ranking, a simple normalization procedure should be performed. To aggregate the individual rankings of the decision makers into a compromise ranking, the minimum variance method [5] is employed.
References
[1] Alternative Fuels Data Base. U.S. Department of Energy’s Alternative Fuels Data Center (AFDC). http://www.afdc.doe.gov/amfa
[2] Burns,J.R. and Marcy,W.M., “Causality: Its characterization in system dynamics and KSIM models of socioeconomic systems.” Technological Forecasting and Social Change. 14, (1979), 387-398
[3] Bus System for the Future. Achieving Sustainable Transport Worldwide.
International Energy Agency. OECD/IEA, Paris, 2002
[4] Chen,S.J. and Hwang,C.L., ‘Fuzzy Multiple Attribute Decision Making:
Methods and Applications. Springer Verlag. Berlin, 1992
[5] Cook,W.D. and Seiford,L.M., “On the Borda-Kendall consensus method for priority ranking problems”, Management Science. 28, (1982), 621–63 [6] Dzurik,A., Leszczynska,D. and Brenner,A., ‘Mass Transit and Sustainable
Urban Environments. Urbanicity. 2005.
http://www.urbanicity.org/Site/Articles/Dzurik.aspx
[7] Farkas,A.,”A comparison of MCDA techniques TOPSIS and MAROM in evaluating bus alternative-fuel modes”, Proceedings of the 11th International Conference on Management, Enterprise and Benchmarking, MEB’13, Budapest, Hungary, May 31-June 1. Óbuda University, (2013), 181-194
[8] Farkas,A., “Priority ranking methods: A survey and an extension”, in:
Business Research and Management Challenges. (ed. Peter.S), Intl. Mgmt.
Center, Budapest, (1994), 74-94
[9] Fowler,T.M., Euritt,M.A. and Walton,C.M., ‘Electric Bus Operations: A Feasibility Study. University of Texas Austin, May, 1995, p. 74
[10] Gur,Y., “An extension of structural modeling.” Technological Forecasting and Social Change. 14, (1979), 399-408
[11] Hikino,K., “Research and development of a hybrid bus with a DME fueled engine.” JARI Research Journal. 22, (2000), 35-38
[12] Hu,A.H., Chen,S.H., Fan,C.H., Hsu,C.W. and Tzeng,G-S., “Evaluation framework for alternative fuel vehicles: Sustainable development perspective.” Energy Policy. (under review)
[13] Hwang,C.L. and Yoon,K., ‘Multiple Attribute Decision Making─Methods and Applications. Springer. New York, 1981
[14] Kane,J., “Aprimerforanewcross-impactlanguage─KSIM.” Technological Forecasting and Social Change. 4, (1972), 129-142
[15] Kazimi,C., “Evaluating the environmental impact of alternative-fuel vehicles”. Journal of Environmental Economics and Management. 33, (1997), 163-165
[16] Kimura,S., “Characteristics and improving ways of thermal efficiency on DI diesel engines.” Journal of Society of Automotive Engineers of Japan.
54, (2000), 56-61
[17] Lin,C.W., Chen,S.H. and Tzeng,G.H., “Constructing a cognition map of alternative fuel vehicles using the DEMATEL method.” Journal of Multicriteria Decision Analysis. 16, (2009), 5-19
[18] Lynch,T.A., Eliason, L. and Dzurik,A., ‘Energy and Environmental Performance of Existing Public Transportation Technologies.’ USDOT Research Report. DTRS93-G-0019 – NUT14-FSU4. Florida State University. College of Engineering, Tallahassee, FL, 2004
[19] Metz,B., Davidson,O.R., Bosch,P.R. and Dave,R.,M., “Contribution of Working Group III to the Fourth Assessment Report of the Intergovernmental Panel on Climate Change. Cambridge University Press.
Cambridge, UK and New York, NY, USA, 2007
[20] Morita,K., “Automotive power source in 21st century”. Journal of the Society of Automotive Engineers of Japan. 24, (2003), 3-7
[21] Nakashima,K., Kawamura,H. and Matsuoka,H., “Development of a hybrid vehicle with a hear insulated natural gas engine”. JARI Research Journal.
22, (2000), 23-36
[22] Offer,G.J., Howey,D., Contestabilec,M., Clague,R. and Brandon,N.P.,
“Comparative analysis of battery electric, hydrogen fuel cell and hybrid vehicles in a future sustainable road transport system.” Energy Policy. 38, (2010), 24-29
[23] Padam,S. and Singh,S.K., “Urbanization and Urban Transport in India: The Sketch for a Policy.” Cent.Inst. of Road Transport. Pune, India. World Bank Development Studies, 2002
[24] Proposal for a directive on the deployment of alternative fuels infrastructure. European Commission Staff Working Document. SWD 6.
Part I., Brussels, 2013
[25] Romm,J., “The car and fuel of the future.” Energy Policy. 34, (2006), 2609- 2614
[26] Saaty,T.L., “A scaling method for priorities in hierarchical structures”.
Journal of Mathematical Psychology. 15, (1977), 234-281
[27] Shimada,A., Ogawa,H., Nakajima,M. and Shimada,H., “Development of the ultra-thin DC brushless motor for hybrid car ─ INSIGHT. Honda R&D Technical Review. 12, (2000), 15-20
[28] Soergel,D., “Mathematicalanalysisofdocumentation systems”. Information Storage Retrieval. 3, (1967), 129-173
[29] Sokal,R.R. and Sneath,P.H.A., ‘Principles of Numerical Taxonomy’.
Freeman and Co, San Francisco, 1963
[30] Späth,H., ‘Cluster Analysis Algorithms.’ Wiley, New York, 1985
[31] Sperling,D., ‘Future Drive ─ Electric Vehicles and Sustainable Transportation.’ Island Press. Washington DC. 1995
[32] Status and prospects of hybrid technology and the regeneration of energy in road vehicles. Technical Report, EUR 21743 EN. European Commission.
Joint research Centre (DG JRC) Institute for Prospective Technological Studies of European Communities. 2005
[33] Tanaka,T., “After-treatment systems and fuel properties for controlling engine emissions.” IWPS 2000. (2000), 58-67
[34] Tzeng,G-H, Lin,C-W. and Opricovic,S., “Multi-criteria analysis of alternative-fuel buses for public transportation”. Energy Policy. 33, (2005), 1373-1383
[35] Vehicle Emission Reductions. European Conference of Ministers of Transport, OECD /ECMT, Paris, 2001
[36] Winebrake,J.J. and Creswick,B.P., “The future of hydrogen fueling systems for transportation. An application of perspective-based scenario analysis using the analytic hierarchy process.” Technological Forecasting & Social Change. 70, (2003), 359-384
[37] World Urbanization Prospects, the 2011 Revision. United Nations, Dept. of Economic and Social Affairs. Population Division. Working Paper.
http://www.un.org/esa/population/publications/WUP2011/2011wup.htm [38] Yokota,H. and Kakegawa,T., “Low-emission diesel-electric hybrid truck by
means of new combustion concept and after-treatment technology”.
Journal of the Society of Automotive Engineers of Japan. 56, (2002), 84-89