Geoinformation management 4.
Data and Information Management
Béla Márkus
Geoinformation management 4.: Data and Information Management
Béla Márkus Lector: János Tamás
This module was created within TÁMOP - 4.1.2-08/1/A-2009-0027 "Tananyagfejlesztéssel a GEO-ért"
("Educational material development for GEO") project. The project was funded by the European Union and the Hungarian Government to the amount of HUF 44,706,488.
v 1.0
Publication date 2011
Copyright © 2010 University of West Hungary Faculty of Geoinformatics Abstract
Data management comprises all the disciplines related to managing data as a valuable resource. The module is dealing with the basic issues of data management. The student will learn about the significant characteristics of data which must be understood, when evaluating data utility; the unique kinds of GIS data base; finally the data management needs of an Enterprise.
The right to this intellectual property is protected by the 1999/LXXVI copyright law. Any unauthorized use of this material is prohibited. No part of this product may be reproduced or transmitted in any form or by any means, electronic or mechanical, including photocopying, recording, or by any information storage and retrieval system without express written permission from the author/publisher.
Table of Contents
4. Data and Information Management ... 1
1. 4.1 Introduction ... 1
2. 4.2 Utility of data ... 3
3. 4.3 Geospatial data management ... 7
4. 4.4 Data management in an enterprise GIS ... 10
5. 4.5 Summary ... 15
Chapter 4. Data and Information Management
1. 4.1 Introduction
Data management (DM) comprises all the disciplines related to managing data as a valuable resource. Data management is the development, execution and supervision of plans, policies, programs and practices that control, protect, deliver and enhance the value of data and information assets (DAMA Data Management Body of Knowledge).
Information management (IM) is the collection and management of information from one or more sources and the distribution of that information to one or more audiences. This sometimes involves those who have a stake in, or a right to that information. Management means the organization of and control over the structure, processing and delivery of information. Throughout the 1970s this was largely limited to files, file maintenance, and the life cycle management of paper-based files, other media and records. With the proliferation of information technology starting in the 1970s, the job of information management took on a new light, and also began to include the field of Data maintenance. No longer was information management a simple job that could be performed by almost anyone. An understanding of the technology involved, and the theory behind it became necessary. As information storage shifted to electronic means, this became more and more difficult. By the late 1990s when information was regularly disseminated across computer networks and by other electronic means, network managers, in a sense, became information managers. Those individuals found themselves tasked with increasingly complex tasks, hardware and software. With the latest tools available, information management has become a powerful resource and a large expense for many organizations. In short, information management entails organizing, retrieving, acquiring and maintaining information. It is closely related to and overlapping with the practice of Data Management.
According to Russell Ackoff, the content of the human mind can be classified into five categories:
1. Data: facts or figures;
2. Information: data that are useful; answers to "who", "what", "where", and "when";
3. Knowledge: application of information; answers "how";
4. Understanding: appreciation of "why";
5. Wisdom: evaluated understanding.
The DIKW hierarchy can have many dimensions. One dimension of Ackoff‟s hierarchy is temporal. He says that while information ages rapidly, knowledge has a longer life-span and only understanding has an aura of permanence. It is wisdom that he considers to be permanent.
Understanding principles Understanding patterns Understanding relations
Fig.4.1. Knowledge pyramid (based on Ackoff‟s hierarchy)
Likewise the other organisational assets data, information and knowledge should also be managed. The definition of Knowledge Management (KM) by Oracle Magazine (1998) is the following: "Knowledge Management promotes an integrated approach to identifying, capturing, retrieving, sharing, and evaluating enterprises information assets. These information assets may include databases, documents, policies, procedures, as well as the un-captured tacit expertise and experience stored in individual's heads." Knowledge management involves data mining and some method of operation to deliver information to users.
In the dynamically changing world of business, the competitiveness of companies (and/or universities) depends heavily on the possibility to find, for a given problem, the right knowledge in the right moment. By using a Knowledge Management System (KMS), organisations increase returns, save time and money, are more adaptable, and have a far better understanding of partners, processes, customers, competitors and their business.
To benefit from every customer or partner interaction, corporations must give for employees opportunities to record what was learned. Efficient knowledge management needs not only document knowledge but must provide tools for collaboration to all contributors to the knowledge pool. Then, other employees must have access to the data and the means to understand it in context. Knowledge management helps an organisation to gain insight and understanding from its own experiences. When employees use this KMS, best practices are stored throughout the organization, and each employee accessing the system has similar power to the best employee.
Tabberer (2003) emphasises the need to make organisations not just „data rich‟ but „information rich‟ and
„knowledge rich‟ as well. An organisation might be quite good at organising and using data (e.g. understanding the spread of performance and being able to analyse which departments tend to do worst); it may even be quite good at managing information (e.g. one part of the organisation knows what others are doing and planning).
That does not mean it is good at managing knowledge (i.e. making what people have learned about what works available in a form which others can readily use). Data may help organisations benchmark their performance externally and internally. It may help them ask questions and recognize surface problems. However, without managing information, they will not know exactly who out in the wider world is doing better, and why. Finally, without managing knowledge, they will not be able to learn effectively and put what they learn into practice.
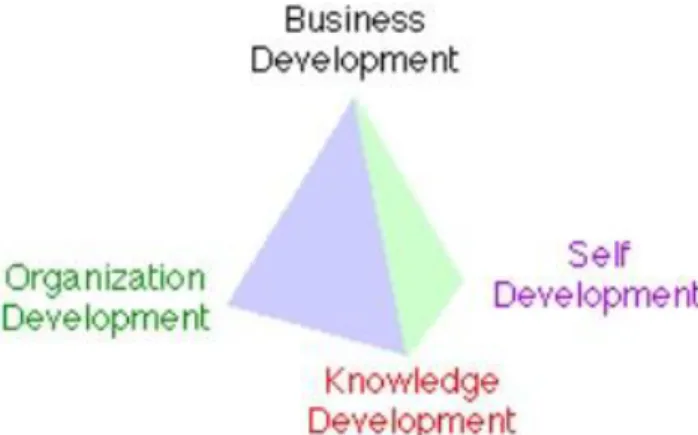
Data and Information Management
Fig. 4.2. Business development pyramid (Source: http://www.mithya.com/home.html)
The module is dealing only with data management. It aims to give a general overview of data management, to highlight that data should be managed similarly to other resources of the organization. The student will learn about the significant characteristics of data which must be understood, when evaluating data utility; the unique kinds of GIS data base; finally the data management needs of an Enterprise.
From the module you become familiar with the:
• Utility of data
• Geospatial data management (for non-surveying students)
• Data management in an enterprise GIS (advanced) After learning of this chapter, you will be able to:
• explain the stages of data utility,
• explain data accessibility,
• define data navigability,
• specify the seven characteristics of data and information,
• the specific issues in geospatial data management,
• explain data sharing culture in GIS,
• describe and compare the basic elements of the old and the new spatial data models,
• identify and explain the basic steps in implementing an enterprise Geodatabase.
2. 4.2 Utility of data
The world is filled with data and information. Some of it is unknowable. Some of it is knowable, but unknown is unknown mainly because it was never deliberately observed, and properly recorded. Of the data and information which are recorded with some accuracy, how do we find what we need for specific uses or decisions? The utility of data is a very specific characteristic, and depends upon the anticipated usage1.
There are a several significant characteristics of data which must be understood, when evaluating data utility.
Any piece of data, in order to be useful, should be:
1. Knowable. Nearly everything is knowable, although sometimes very difficult to learn, discover or discern.
2. Recorded. In some sharable, objective medium and not just in some human brain.
1 This introductory chapter is based on Scofield, Michael: Stages Of Data Utility & Value, The Data Administration Newsletter, 2005 October.
3. Accessible (with the right resources and technology) 4. Navigable (easy to find)
5. Understandable (language, culture, etc.) 6. Of sufficient quality (for the intended use)
7. Topically relevant to needs (perceived needs and unknown needs - otherwise, it is noise)
These characteristics apply to a piece of data, or potential information. These characteristics apply to both a single item of data, and any meaningful grouping of data items.
Please notice that these characteristics are also tests, and seem naturally sequential (1 through 7). Subsequent tests are irrelevant if the previous tests are not passed.
Another important characteristic of information is whether it is structured (or tabular), or unstructured. The tabular-unstructured dimension is orthogonal to these seven. Meaning, that there are really 14 tests (in two columns) possible.
An overview of the stages of data utility is shown below.
Fig. 4.3. Seven utility characteristic questions about data (Source: Scofield, 2005).
So these seven characteristics can also be seen as seven tests, which can be applied in sequence. The exact sequence of the final five can be debated. For example, if a fact (whose value is known or not) is judged to not
Data and Information Management
be relevant, then we probably wouldn't worry about its quality. But the sequence here seems somewhat intuitive, so we use it.
1. Knowable
There is a wealth of potentially knowable data in the universe. Only a very small portion of it has ever been observed or known by humans (or the technology which humans use to extend mankind's observations and senses). And little of that was ever recorded anyway. Slightly more was remembered, but not recorded. Of course, memory fades...and fails. Hence, the need for recording stuff.
2. Recorded
Most of what is knowable is never recorded. People don't feel it is worth recording. Some is recorded by hand (requiring, generally paper and writing instrument) but since 1850, some is recorded through automated or technological means (photography, digital media, etc.).
What we chose to record depends upon our expectations of later utility or interest. Students take notes in academic lectures, but not on what goes on at a football game. More captains of industry and government write memoirs than do postal clerks.
When we discover a need for data, we can adjust behaviour and systems to start recording it. But much of the most crucially needed data is not recorded until it is too late.
3. Accessible
The very availability and access to data can be a major issue. Of all the knowledge and data ever recorded, much (especially in ancient times) was confined to letters and personal journals. There were newspapers, but only late in the history of civilization.
Thus, much of what has been known and recorded is not in the public domain. It is in the personal property of families. In the modern industrial age, a great deal of knowledge is held in the private files of corporations and government agencies (though many of these are destroyed on a regular basis, sometimes to prevent their availability for discovery to aid litigation). These generally are not available to the public. For investigative purposes they can only be subpoenaed if their existence is known.
The public library was a major step forward in making data, knowledge, and information available to a wider readership. The internet is the latest significant mechanism for lowering the cost of access, speeding navigation (see below), and lowering the cost of "publishing".
We often underestimate the value and power of the human brain. Much of contemporary knowledge and data is held solely in human brains. Most people do not even understand or realize how much they know. Mechanisms for recalling that data are sometimes faulty. We may require triggers or clues to remember things. We may remember the route to a particular store if we were driving it ourselves (relying on visual clues along the way which work for us, but which we could not articulate during an interview), but it is more difficult to remember, describe, and organize those clues to give verbal or written directions to someone who wishes to drive the same route.
4. Navigable
Orthogonal to the concepts of structured and unstructured data are issues of navigation; how do we find what we are looking for? Or what is important? ...to us. Or what we need to know?
There is a wide range of "navigability" in data (particularly in unstructured data). The worst case is a collection of personal letters, on paper stationery, (not stacked chronologically) of some individual.
Books are bound pages, with some physical organization (usually chronology); they are designed (except for reference books) to be read serially, front to back. Reference books have topics generally organized alphabetically, or some other meaningful categorization. Then, some non-fiction books have tables of contents which are significant (for example, text books). In these kinds of books (compared to narratives), topics are becoming easier to find. Then, topical indices were added to back of the bound non-fiction book. These are helpful, but reflect the judgement of some editor who decides which topics are important enough to get a reference.
Tabular data was generally stored (at least on paper) in entry sequence. The beauty of automated (electronic, digital) tabular data was that records could be sorted, and we could use several alternate keys or indices to find records. This is a very significant enhancement in navigability of data. Indeed, tabular data has become quite easily managed.
But what about unstructured data? Document imaging systems allowed a document's image to be referenced by a few indices (perhaps name, date, and something else). But the content was not reference-able in its graphic form. Then came the web, and search engines. Wherever unstructured textual data is digitized, and placed on uniquely-identifiable pages, search engines could help us find it. Google has done much to revolutionize the finding of text.
And there appear to be some engines which can find images similar to each other. Whether the next generation of search engines can find meaning (rather than specific words or text strings) remains to be seen.
5. Understandable
Data can be recognized as existing, and the meta-data (source, time of observation, etc.) may be known, but the content of the data may not be understandable. Drawing usable meaning from data requires lingual, technical, and cultural familiarity. The more cryptic (or coded) the data is, the more culture must be "wrapped" around it, often supplied by the analyst or interpreter.
The very existence of data (or communication) may itself be useful even if it is not understood. A friend of mine told of his military experience working at a "listening post" facility high on a mountain in Turkey, with a good radio "view" into the Soviet Union. They listened to VHF radio signals, often voice, and though he spoke no Russian, he could note the time, frequency, duration, number of voices, etc. This kind of "metadata" was useful (known as traffic analysis) even if the content was not understood--although he probably tape recorded what he heard over the radio channel.
A simple definition of information is: "data plus context yields information". The context can make raw data understandable.
The information and data held in the human brain are stored with context--sometimes vital context which makes the fact, out of context, of little value. The human manages to integrate and relate all this data in a variety of intuitive ways--not at all in a tabular manner, thus going far beyond the ways we can relate or process tabular data in the relational model.
6. Of sufficient quality
There are a variety of specific measures of quality. They include:
• Presence of record. Is there a record present for an instance in reality?. If not, then the entire row of data is missing.
• Presence of data in cell. While the row may be present, the cell may not be populated when it ought to be.
• Validity of a fact. Does the value of a fact (a cell in a row) conform to some rules? E.g. if the field is called
"STATE" is the value a valid state code? This concept is sometimes achieved through referential integrity. In tabular data, this is relatively easy to determine through Boolean tests.
• Reasonableness of a fact. While the value in a cell may be valid, it may not be deemed reasonable, in context of peer data, or other facts in the same record. E.g. the zip code is not consistent with the state code on an address.
• Accuracy. A fact may be valid (a proper code), reasonable (in keeping with peer data), and still be flat out wrong--inaccurate. Generally, testing for accuracy can be very expensive.
• Precision. Precision is different from accuracy. A numeric amount can be accurate to the dollar, but not precise to the penny. It is still accurate, in a sense, and useful in some analysis.
• Consistent definition over time. A set of facts (a column) in a set of records (a table) should have consistent definition over the span and scope of the table. If they do not, then the definitional accuracy of the data (or more precisely, the meta-data) is lacking.
Data and Information Management
Ideally, the quality of data is something that can be objectively measured, without reference to an intended use.
And in designing systems and assessing data quality of latent and moving data assets, we do need to strive for that.
But the quality of data or information (as objectively measured) may or may not meet the specific needs of a decision or analysis.
7. Topically relevant to needs
A final issue must be mentioned and that is relevance and usability of data and/or information to a particular need. Data which is not relevant can be distracting, or actually be considered "noise". Advertising is a culturally sanctioned, structured form of noise. (Graffiti, another form of advertising, is generally not sanction by society.) Ideally, we know what is an ad when we see it, and we can choose to "tune it out". But noise can be used deliberately to obscure significant data, as can be dis-information. There were several such situations in World War Two (such as the fake army radio messages just prior to the Normandy invasion), and probably have been many since then we don't know about.
These, when understood and applied as sequential tests, allow us to determine its utility and value for particular business and social needs and expectations.
3. 4.3 Geospatial data management
This chapter provides a very brief introduction to geographic information systems (GIS) technology and the unique kinds of GIS data files that enable such technology2. Most data management professionals are more experienced with "classical" tabular data as found in most business, government and scientific databases.
Geospatial data has a significantly different structure and function. It includes structured data about objects in the spatial universe - their identity, location, shape and orientation, and other things we may know about them.
Geographical data describe an incredibly wide range of objects or business assets - roads, buildings, property lines, terrain, infrastructure, hydrology and ecosystems. All these objects can be described in terms of points, lines and polygons - and tables of these objects constitute the tabular portion of geospatial data.
Geographical information system technology also accommodates some kinds of unstructured data (usually raster imagery) that can be tagged and geocoded (given precise positional characteristics) and integrated by GIS software to the other kinds of map data.
Thus the management of GIS data and metadata is somewhat different. Whereas traditional tabular data could be understood by a human looking at any printed expression of the data (usually in rows and columns, even on paper), raw GIS data is generally meaningless to the human eye until converted into a map. This is what GIS software does.
However, because of the complexity of the storage and expression of GIS data, the software is heavily dependent upon formalized metadata conforming to rigorous metadata standards. Any positional coordinates of geographic objects must be stored in a reference system (e.g., X and Y coordinates) and a projection (remember the distorted maps in your geography atlas?).
The problem (and the powerful opportunity) of GIS technology is that map data from various sources is often fragmented in source and format. The power comes from integrating sources (displaying power lines over terrain, for example) and displaying to the human eye the proximity-based relationships between objects of interest. Proximity can't be "seen" in the data, but it can be seen on a map.
Sources can have different projections and reference points, and the GIS software resolves those. With GIS software, things "fit" or "line up" properly. It is the metadata that makes this happen!
Data sources
Geospatial data can come from many sources. Geospatial data has been digitized by a wide variety of agencies and commercial enterprises at an increasing pace over the past ten years. The first digitization often involved
2 This chapter is a brief and very simple overview of the world of geospatial data for non-surveying students. The chapter is based on Scofield, Michael: Introduction to Geospatial Data Management, The Data Administration Newsletter, 2007 April.
tediously tracing existing paper maps with a digitizing device (similar to a mouse) to record, point-by-point, the shape of roads, rivers, contours, buildings, etc.
More recently, techniques have been developed to ease the in-field gathering of positional and other data.
Utilities have field devices with a global positioning system (GPS) to gather positional information about assets (transformer vaults, utility poles, hydrants, valves, etc.) as well as allowing the entry of other data about the asset. Some even allow you take a photo of the hydrant that is included in the geocoded data record. Mapping companies sometimes drive special vehicles around the street system, taking photographs and noting the exact coordinates - all digitized to make scalable street maps.
Imagery can sometimes be interpreted by specialized software to derive roads and other objects, but this is not as reliable as human, on-the-ground observations.
What results from such data construction is a set of files containing one record for each component of a geographic object. For example, a segment of street (between two connecting streets) would be one record, containing an ID, a single field of geographic data, and certain useful non-spatial attributes (such as the street name, the street width, the surface material, etc.).
This is known as vector data in that all objects on the earth's surface may be represented as points, lines or polygons. The nodes are points, but the streets are lines. A parcel of owned property would be represented by a polygon.
In a geospatial database, each of these objects would be grouped into object classes, and their data would be stored in separate tables.
Data about a street system (table fragment shown above) usually is stored in a separate database from data about the hydrology of the same area or the electrical system in the same city. GIS software integrates these various datasets (often coming from different authorities or sources) into a single desired representation (a map appearing on the screen, ready to be manipulated and/or printed out).
Again, it is the job of the GIS software to successfully integrate these various sources of graphical representation of objects in the desired sequence and scale.
Reference systems
All vector data must be stored in some kind of reference system. The position of any geographic object must always be captured, stored and expressed with reference to other objects or an underlying coordinate grid.
Because the earth is not only ellipsoid, but quite irregular (nearly undulating) in the distance of its surface from the center of the earth, reference systems are complex and varied. In other words, "sea level" is irregular and can vary by as much of 150 meters (vertical) over the space of a few thousand miles (as from Sri Lanka to Borneo).
The water doesn't flow because the force of gravity is equal in those two places. So what we know as "sea level"
is a result of the equal force of gravity.
Therefore, elevation data must take into consideration the issue of an irregular surface of the earth.
Coordinate systems
A second reference issue involves the X and Y coordinates of a point. The traditional geographic coordinate system (that most Americans learned about in school) is the latitude and longitude system where the circumference of the earth is divided into 360 degrees, each degree divided into 60 minutes, and each minute potentially divided into 60 seconds of arc.
Unfortunately, there are different definitions of latitude (because of that ellipsoid), and that must be declared in the metadata of the GIS dataset.
Metadata
What allows all this to come together is the metadata for each dataset that is used by the GIS software to properly overlay each layer coming from each source.
Data and Information Management
This metadata sits in an adjacent dataset, usually in XML format, which is read by the GIS "engine" to understand the coordinate system and projection of each dataset. The software then correctly overlays the data for presentation to one or more users.
The GIS community has created standards for its metadata. These standards include structured fields (absolutely essential for the software to read the data) and unstructured metadata (that is designed for humans to read and evaluate the suitability of the dataset for their needs). The Federal Geographic Data Committee (FGDC) established one metadata standard called the Content Standard for Digital Geospatial Metadata (CSDGM). A similar (and mostly compatible) ISO 19115 standard for geographic information metadata is also widely used.
Advantages of Digital Map Data
The primary result of digitizing geographic data is that the raw data is now separate from the expression of that data. Previously, a paper map was both a repository of data and an (often) artistic expression of that information.
Now they are separate.
Raw data can be reused in a variety of different maps - better return on the investment in the data asset.
Additionally, a wide variety of analysis can be done. For example, optimal retail sites can be evaluated using demographic information down to the census tract and street level of granularity.
Because the data is separate from the expression, the symbols may be altered to suit the audience. Streets, for example, can be any desired colour; and schools, churches and other buildings can be portrayed using a variety of symbols.
Data Sharing Culture in GIS
Unlike most competitive industries, there is a culture of data sharing in the geospatial world, which allows agencies to exchange data freely. Only a few for-profit companies that do mapping or collect imagery (aircraft and satellite) are driven by the revenue of data or imagery sales. Many government agencies freely provide their datasets for a variety of uses.
Data may be shared by the total transfer of a dataset (in bulk) from the source server to a user or through a Web- based "service" where only the data needed (limited to a small geographic subset of the total dataset) is sent to the requesting software (and user).
Finding the datasets or service you want is sometimes difficult - there are many of them out there. There are portals sponsored by various government agencies (such as http://www.geodata.gov/) that allow the user to search for GIS datasets addressing specific topics.
A variety of business and demographic data that has been geocoded is available (at a cost) and, thus, can be integrated into the base map data.
Industry Standard Data Models
Because of this culture of sharing, there are also industry standard data models that allow not only the sharing of data among peer agencies and companies, but also the sharing of analysis tools. This is because some GIS databases not only describe a portion of the earth's surface, but also can be used for behaving in certain ways (such as creeks and streams) supporting certain simulation software. One agency may develop a model for calculating flow through a water supply system, and it can then share that software with another agency covering a different geography.
GIS data faces the same data management challenges as traditional structured (or tabular) data. There must be appropriate versioning of data and archiving. There can be many unknowns regarding data quality and currency of any dataset. This is true especially where data may be integrated from multiple sources, some of which may have unknown reliability. Again, the metadata of original and derivative datasets must reflect all these issues.
Conclusion
This has been only a brief (and very simple) overview of the world of geospatial data. Geospatial software packages can be quite complex, but they provide a host of analysis tools. These software packages are used by nearly every major federal government agency to address geography-related problems.
Raw geospatial data (unreadable by the human eye) is nearly useless without the software to convert it to rich, graphic expression, but this is impossible without precise metadata. The business analytical possibilities of employing proximity and spatial relationships among objects are nearly unlimited.
4. 4.4 Data management in an enterprise GIS
There are many different definitions of the word “Enterprise”. For the purposes of our discussions here, we do not take a very sophisticated, but rather simple “Any organization that needs to support multiple concurrent users accessing a shared information resource.” This may mean a three or four person shop concurrently working on a single project or it may mean several thousand people spread out over the globe networked together with a Wide Area Network or the Internet3.
What are the data management needs of an Enterprise?
The data management needs of an organization change dramatically as soon as any group of users requires multiple concurrent use of any data or information asset. This basic requirement, with its attendant requirements for security, record level locking, edit conflict resolution, etc., is the prime force behind the evolution of the modern Relational Database Management System (RDBMS). It is this need for centralized management of the shared concurrent access to an organizations information assets that we take to be the primary differentiator of an Enterprise from other organizations. In its simplest form, the problem boils down to providing your users with secure, dependable access to centrally managed information for the organization.
The old spatial data models
Up to this point, we have not mentioned Spatial Data specifically at all. This is no oversight. Geographic Information Systems are merely a small subset of the other Information Systems of an Enterprise. The GIS acronym stands for Geographic Information System after all. In many ways, the Spatial Data management needs for an Enterprise are little different than other data management needs. Unfortunately, until very recently, GIS data models have not kept pace with some of their more sophisticated RDBMS cousins and have traditionally been file based. From an Esri perspective, the traditional geographic data models have included:
a. Coverages -- The basic spatial model for ArcInfo. The coverage is a very solid data model that has served us very well for many years. The data model includes internal topology, and is very rigorous about enforcing proper feature construction.
b. Shapefiles -- The basic spatial data model for ArcView. The Shape File model is much less rigorous (some would say sloppy) about enforcing feature integrity and relies on run-time calculation for topology.
i. Librarian -- Librarian layers are collections of coverages which are adjacent to each other. Each coverage is referred to as a 'tile'. The tiles are defined in an index coverage which is a polygon coverage of just the space each tile takes up (such as a USGS map boundary). Tiles do not have to be equal in size or shape, but usually are. All tiles have to conform to the tile boundaries specified by the index coverage. The index coverage contains an item for each layer in the library, the record for each tile is merely the path to that tile. So ArcInfo knows to find the library based on an entry in the system's INFO file, then looks in the library's index coverage to see what layers are in there, then looks for the tiles wherever that is specified. The advantage of libraries is that the whole layer is not rendered as you zoom in, only the tiles within your extent - very similar to SDE's use of spatial index. The disadvantage is that it's still built on the coverage model and thus does not support (very well, anyways) multi-user editing and display. Our tests have shown that library layer display comes to a crawl as more users are added.
a. GeoTIFFs (and other spatially registered images) -- a file based spatial data model for rasters where each pixel has a spatial representation but rather little attribute depth.
b. GRIDs - The ArcInfo representation of a Raster image that allows for greater attribute depth for each pixel in the file.
c. Image Catalogs -- An image catalog is similar to a library layer, but each catalog has its own database file.
The database file is nothing more than a table of minX, minY, maxX, maxY, and image location. It specifies
3 This advanced chapter is based on Rich, Stuart - Das, Amar – Kroot, Christopher: Spatial Data Management in an Enterprise GIS, http://proceedings.esri.com/ library/userconf/proc01/professional/papers/pap742/p742.htm
Data and Information Management
the extent of an image and where it is stored. In this manner, users can bring in image tiles as an apparent mosaic without finding all the tiles and piecing them together. Image catalogs were not supported at ArcMap 8.0.x, but are at 8.1.
There are several significant limitations to any file-based data model. Concurrent user access typically degrades performance dramatically and it is not possible to support multiple concurrent users editing a single file. Further, there are limitations to the size of any physical layer in the file system. The file size limit is largely a function of the density of the data involved, but in many instances it becomes necessary to subset large contiguous spatial datasets in order to obtain adequate performance. The Librarian structure was developed to streamline some of the resulting problems inherent in tiling datasets, but it remains a rather in-complete solution.
The new spatial data models
Over the course of the past five years or so, Esri and most of the major database vendors have begun the process of developing spatial data models based upon Relational and Object-Relational Database Management Systems.
The aim of these development efforts is to take advantage of advances in relational database technology in order to provide the Enterprise features lacking in a file-based data model. Security, multiple concurrent user access, and spatial indexes are dramatic improvements to the traditional spatial data models available through the new Spatial Database models. While many of the major database vendors (Oracle, Informix, IBM) have introduced their own proprietary spatial database formats, for the purposes of this paper, we will concentrate on Esri‟s implementation of Spatial Database Technology.
SDE layers - The Esri Spatial Database Engine (SDE) has been around for several years now and has achieved great performance advantages over file based spatial data models. SDE creates a multi-tiered spatial index scheme on your spatial data allowing a user to extract and render very quickly a subset of a very large spatial data layer. This capability allows a spatial data administrator to move away from the tiled spatial data model and create seamless data layers for the entire geographic extent of interest to the users. While you can load spatial data into SDE from almost any data format with the appropriate software, SDE enforces a much more rigorous spatial data model than shape files, and shape files can sometimes provide trouble when trying to load into SDE.
We recommend that shape files be converted to coverages before being loaded into SDE. SDE is currently the only spatial data format that is visible to all of the Esri clients.
a. The Geodatabase4 - The Geodatabase is, in our humble opinion, the most significant advance in the spatial data model in thirty years. The Geodatabase, as implemented with ArcGIS 8.1, is an object-relational data model that enables tremendous new capabilities in our attempts to model the world around us. For the first time, we can begin to model the behaviors of the spatial objects in the world around us and not just the attributes of those objects. Coupled with the relational database technology that gives these new models their persistence, these new data models will deliver great new flexibility to users of spatial data in the years to come. There is a tremendous amount of confusion currently about this new term “Geodatabase”. While the underlying technology that supports a Geodatabase is a group of relational database tables administered by SDE, the Geodatabase itself exists as a group of COM objects within ArcGIS as it is running on a MS Windows platform. For this reason, technologies that are not running within the MS Windows memory space (ArcIMS, ArcExplorer) or applications that have not been built to see the new Geodatabase objects (ArcView 3.X) will not be able to take advantage of the exciting new opportunities made available by these new data models. It is important to realize that while SDE may manage the storage aspects of a Geodatabase, SDE does not understand any of the custom behaviours that may have been defined for Geodatabase objects or the relationships that have been established within the Geodatabase. Within the Geodatabase, there are several base object classes to enable the storage and management of spatial objects. These base classes include:
i. Feature Classes - This is the most basic type of Geodatabase object. You can think of it as roughly analogous to a shape file or an individual layer of a coverage. A feature class stores a group of features with a shared geographic extent, spatial reference, attribute table, etc. Each individual point, line, or polygon within a feature class is a separate object within the feature class.
4 The geodatabase is the common data storage and management framework for ArcGIS. It combines "geo" (spatial data) with "database"
(data repository) to create a central data repository for spatial data storage and management. It can be leveraged in desktop, server, or mobile environments and allows you to store GIS data in a central location for easy access and management.The geodatabase offers you the ability to• Store a rich collection of spatial data in a centralized location. • Apply sophisticated rules and relationships to the data. • Define advanced geospatial relational models (e.g., topologies, networks). • Maintain integrity of spatial data with a consistent, accurate database. • Work within a multiuser access and editing environment. • Integrate spatial data with other IT databases. • Easily scale your storage solution. • Support custom features and behavior. • Leverage your spatial data to its full potential.
ii. Feature Datasets - A feature dataset is intended to store a group of feature classes that share some sort of spatial relationship. For example, you might create a „Political Boundaries‟ feature data set that included Towns and Counties feature classes where Towns and Counties share some coincident boundaries. You could then establish some editing relationships that determine that whenever a Town boundary is moved, that any shared coincident geometry in the associated County will also be moved. There is no specific requirement of Feature Datasets that the member Feature Classes have spatial relationships. It is technically possible to utilize Feature Datasets as logical data organization mechanisms. For example, you could create a „Hydrography‟ Feature Dataset that included Rivers, Ponds, Lakes and Streams. None of these feature classes would share any spatial relationship, but the Feature Dataset would be used to logically organize the data and make it more easily accessible by the Enterprise users. There is a significant problem associated with this “misuse” of the Feature Dataset, however. Whenever a Feature Class within a Feature Dataset is opened for editing, all of the other Feature Classes within that Feature Dataset are also opened in order to check for spatial relationships. This can create severe performance problems in many cases. We recommend that Feature Datasets be used only to store Feature Classes with shared spatial relationships (for which they were intended after all) and that other mechanisms be developed for data organization and usability purposes. We have developed a custom extension to ArcMap for this very purpose for our clients at the Maine Department of Environmental Protection. Using this tool, the Spatial Data Administrator can create a multi-tiered folder structure to organize the Enterprise feature classes into logical groupings for the user. This approach has the added benefits of allowing the Spatial Data Administrator to include a single Feature Class in several places in the folder structure and it allows the users to view all available Enterprise spatial data from within ArcMap without having to start ArcCatalog or go to the Add Data dialog box.
Fig.4.4. Geodatabase (Source: Esri)
i. Rasters - An SDE Raster represents the capability of storing raster data within a RDBMS. All of the justifications of centralized information management, security, multiple concurrent users of central information assets, and the performance gains inherent in the spatial indexing of very large datasets apply here.
ii. Network objects - Spatial data models that require a network topology (transportation road networks, water distribution networks, electrical distribution networks, etc.) require the Geodatabase to be implemented. SDE alone does not support a network topology data model. (Nor do most of the proprietary RDBMS spatial data solutions). The Geodatabase, however, fully supports the network data model and several Esri business partners (most notably Minor and Minor) have developed custom network data models for water/wastewater distribution and electrical distribution.
iii. Custom objects - As we just mentioned with the Minor and Minor example, it is very possible to create custom data models within the Geodatabase. Much work has already been done to develop a custom hydrography data model by the USGS and others. The EPA is working with Ross Associates to develop a custom data model for regulated facilities. With the new custom data modelling capabilities of the Geodatabase, it is now possible to create spatial data models with much more depth that more accurately represent the objects in the world around us.
Data and Information Management
Implementing an Enterprise Geodatabase
If you have gotten to this point in our discussion and are starting to think that perhaps an Enterprise Geodatabase represents some great advantages for your organization, then the next question you will be asking is “How would I go about implementing an Enterprise Geodatabase within my organization?” You will hear a number of presentations this week at the User‟s Conference that imply that all you have to do is create a Geodatabase, drag and drop a few shape files into it and Presto! you have an Enterprise Geodatabase. While this statement may be technically correct, designing an Enterprise GIS that is appropriate for your organization will require much more thought and planning to get it right. Here are just a few other minor considerations that should go into your planning of an Enterprise GIS for your organization:
a. Architecture Design
i. How would my users like to apply GIS within their daily work flow? Be honest here. Your users would probably like to do a whole lot more with GIS than they are currently doing but are limited by the fact that data is hard to find, tiled in inconvenient ways, hard to get over the network, and they are unsure whether they have the most up to date copy. And, oh by the way, the desktop GIS software (if you are still using ArcView 3.X) doesn‟t give them the kinds of GIS capabilities that they would really like. Before you can develop an Enterprise GIS that fulfills your users‟ needs, you will first have to document what these needs are. This documentation process can be difficult and time consuming and can not be done from the comfort of your office. Get out there and talk to your users and figure out what it is that they really need to do with GIS. Write it down. Don‟t‟ dismiss any of their requests as impossible before you document them. Prioritize their requests.
ii. What kind of bandwidth is available within my organization? GIS datasets can be very large and dense.
Moving even subsets of these datasets across the Enterprise network for manipulation or viewing purposes can have serious network performance implications. If you have a high capacity network and a relatively small number of GIS users each with a relatively powerful workstation, then connecting each workstation directly to the Enterprise Geodatabase over the network is a very viable solution. If, on the other hand, you have a large number of distributed users with less than ideal workstations and shared, modest bandwidth, then you will be better off setting up a central Citrix server on a high capacity network link to your Enterprise Geodatabase and serve your GIS client applications over Citrix connections for those users that need GIS desktop applications. As an example, at our St. George Consulting Group offices in Rockland, we have a 100 Mb switched network and all of our GIS users (about eight) have relatively capable workstations. Running ArcGIS locally on the workstation and connecting to the Enterprise Geodatabase works just fine in this environment. At the Maine DEP where they have over a hundred users in four regional offices throughout the state, many of the regional offices are sharing a 10MB connection to the main office and have less than exciting workstations on the desktop. In this situation, the Citrix deployment model has delivered outstanding access to GIS applications to these distributed users over the Wide Area Network.
iii. What are the capabilities of my users‟ desktop machines? As we have just described, ArcGIS requires a pretty substantial workstation for optimal performance. Don‟t give GIS a bad name by delivering a high performance software package on inadequate hardware.
iv. Do my users need to publish GIS data or services outside our internal network? Internet mapping infrastructure deserves a whole presentation of its own. We will not try to go into all of the considerations for designing an ArcIMS architecture here. There are a few points that we do feel should be made, however.
First of all, it is very important to recognize that ArcIMS is NOT a GIS desktop application, but rather is a tool for publishing pre-defined maps over the internet. Do Not think of ArcIMS as a replacement for ArcView. Secondly, remember that ArcIMS can utilize SDE layers, but will not be able to take advantage of most of the sophisticated capabilities of the Geodatabase. If you need to have access to Geodatabase objects from within ArcIMS, you will need to do some pretty sophisticated programming an utilize ArcGIS 8.1 as a GeoObject server (not something that is handled within the current licensing language of ArcGIS).
b. Capacity planning (hardware)
i. How large and complex is my data? Unfortunately, there are not simple elegant formulas to translate the size of a shape file into an equivalent Feature Class. Spatial database tuning is an interesting blend of art and science and involves a lot of trial and error.
ii. How many concurrent users must I support? There is an excellent white paper available on the Esri web site on System Architecture Design by Dave Peters of Esri. This paper will give you some good guidelines for hardware capacity planning.
iii. What kind of spatial operations do my users want to do? Keep in mind that all users are not created equal.
Users that are concurrently editing a networked data layer will require more hardware resources than those that are selecting and drawing points layers.
c. Security Planning
i. What are the editing needs of my users? Which layers should be visible to which groups of users? Which groups of users should be able to edit which layers? Am I serving any sensitive data? You will need to develop a security plan for your enterprise that takes these issues into consideration.
d. RDBMS Software Selection
The choice of a particular RDBMS vendor for your Enterprise will likely not be determined by a list of required functionality that one vendor supports while others do not. For the most part, all of the major RDBMS vendors will be able to support the majority of your requirements. Your spatial RDBMS vendor selection will therefore fall on several other criteria:
i. Do I have any particular RDBMS skills in house? If you already have RDBMS experience with a particular Enterprise database in house (MS Access is NOT an Enterprise database) then this vendor is most likely your best choice to implement your Enterprise Geodatabase.
ii. How large is my installation likely to get? If your Enterprise Geodatabase is likely to get very large and be distributed among several different offices, then Oracle and IBM probably offer the most scalable RDBMS platforms supporting advanced database replication.
iii. Do I have requirements to integrate spatial data with non-spatial applications? If you have non-spatial database applications within your organization that would be enhanced by GIS integration, then it makes the most sense to keep the RDBMS platform consistent across all applications.
e. GIS Software Selection
If you are going to create an Enterprise Geodatabase, you must remember that the only clients that can view all of the capabilities of this new data model will be ArcGIS clients. There are essentially three different flavors of ArcGIS to choose from each implemented with different capabilities of ArcMap, ArcCatalog, and ArcToolbox.
ArcView 8.1 is able to select and analyze data from an Enterprise Geodatabase, but is unable to edit within this environment. ArcView 8.1 is only able to edit shape files and personal geodatabases. ArcEditor is able to edit data within an Enterprise Geodatabase, but does not have all of the geo-processing tools available with ArcInfo workstation. ArcInfo 8.1 is the full blown, top of the line product.
f. Training
Moving to an entirely new data model, often accompanied by a change in the GIS desktop software obviously will require some user training to help your users make the most of your GIS investments. There is generic training on how to use the software products available through Esri (Introduction to ArcGIS etc.) but Enterprise Geodatabases are very unique installations and you should plan on investing a fair amount of time and energy in developing user training that is specific to your installation.
Planning for the migration
OK, so once you have designed the systems architecture that will eventually house your new Enterprise Geodatabase, how do you start making the migration?
a. Existing spatial data inventory - Start by taking an inventory of all of your existing spatial data. How many duplicate or overlapping datasets are there? If there are differences between duplicate datasets, how will you resolve the editing differences? How much metadata exists for your current data?
b. Creating seamless datasets - For many organizations, the most important advance that a spatial data administrator can deliver to his or her users when implementing an Enterprise Geodatabase is access to
Data and Information Management
seamless layers for the entire geographic extent of the organization‟s area of interest. Moving away from tiled data is usually greeted by great cheers from the users. Getting there, requires a bunch of work, however.
The most dependable process for creating seamless datasets from tiled data is to convert all of the data to coverages, append the data into a single coverage using the appropriate snapping tolerances, resolve any editing problems and then clean and build the seamless coverage.
i. Spatial data loading - Once you have created your source data layers, you can either import these layers into your Enterprise Geodatabase using ArcCatalog or use SDE command line options. For large data loading operations, you will probably want to make some adjustments to the dbtune options in the Geodatabase for the duration of your data loading operations and then change them back to your production settings once the loading is completed.
a. Spatial data tuning - SDE tuning is a bit of a black art. With some of the RDBMS platforms, (Oracle in particular) significant performance gains can be made by adjusting table definitions, indexes, and in some cases the placement of portions of the physical data in different places on the file system. SDE tuning is way beyond the scope of this paper and we will not attempt to do the subject justice here.
Start small and build incrementally
One of the principles of the Unified Software Development process that we have come to believe in very strongly is that of iterative and incremental development and deployment. You don‟t need a pair of Sun 4500‟s to begin your experiences with Enterprise Geodatabases. Start small. Learn the capabilities of the new software.
Learn the strengths and weakness of your data. Roll out your Enterprise Geodatabase to a small number of users initially and test its performance under as many different user conditions as possible. As you gain experience with your users and your data, you will have a better understanding of how additional investments in your infrastructure could most effectively be made.
Looking ahead
So how does an Enterprise Geodatabase fit into the broader future of GIS?
a. LOTS more spatial data is becoming available. -- There is an explosion of new spatial data becoming available and this trend will only increase over the coming years. Your ability to acquire and serve more and better spatial data to your users will increase dramatically in the next ten years. Make not mistake, your users will expect to have access to this data.
b. Network capabilities improving - Though is has not happened as quickly as any of us would like to see, network bandwidth is steadily improving and becoming accessible to more users. As bandwidth barriers fall, expect to hear from more users requesting GIS data and applications.
i. Publishing maps on the Internet - The more sophisticated capabilities are not currently available to our current map publishing software (ArcIMS). But this limitation will not be with us for long. The Arc 8 development team has indicated that with the release of ArcGIS 8.2 that it will be possible to author ArcIMS services with ArcMap. Though the complete functionality to be delivered has not be described yet, we are hopeful that these services will be fully mindful of the entire Geodatabase model.
a. Spatial data services - Your Enterprise Geodatabase will not be the only source of data of interest to your users. New Geographic data services are becoming available that will fill interesting niches particularly in temporally sensitive data (weather for example). There may be requirements for your organization to provide some of these same geographic data services either internally or externally.
b. Integration of GIS into Enterprise Information Systems - As the major RDBMS vendors mature in their ability to deliver integrated spatial data storage capabilities within their databases, the ability to integrate spatial concepts into the rest of our business database applications will become much easier to achieve and the demand for this capability will become much more common.
5. 4.5 Summary
The module was dealt with data management, with the aims to give a general overview of data management, to highlight that data should be managed similarly to other resources of the organization.
From the module the student become familiar with the utility of data, Geospatial data management, Data management in an enterprise GIS.
After learning of this chapter, you are able to:
• explain the stages of data utility,
• explain data accessibility,
• define data navigability,
• specify the seven characteristics of data and information,
• the specific issues in geospatial data management,
• explain data sharing culture in GIS,
• describe and compare the basic elements of the old and the new spatial data models,
• identify and explain the basic steps in implementing an enterprise Geodatabase.
Review questions
1. Explain data accessibility!
2. what is data navigability?
3. Specify the seven characteristics of data and information!
4. What are the specific issues in geospatial data management?
5. Explain data sharing culture in GIS!
6. Describe the basic elements of the old spatial data models!
7. Describe the basic elements of the new spatial data models!
8. Identify and explain the basic steps in implementing an enterprise Geodatabase!
Bibliography:
1. Scofield, Michael: Stages Of Data Utility & Value, The Data Administration Newsletter, 2005.
2. Scofield, Michael: Introduction to Geospatial Data Management, The Data Administration Newsletter, 2007.
3. Rich, StuartDas, AmarKroot, Christopher: Spatial Data Management in an Enterprise GIS, http://proceedings.esri.com/library/userconf/ proc01/professional/papers/pap742/p742.htm
4. BEST-GIS, ESPRIT/ESSI Project n° 21580.: Guidelines for Best Practice in User Interface for GIS, 1998., http://www.gisig.it/best-gis/Guides/main.htm
5. P. Longley, M. Goodchild, et al., Eds.: Geographical Information Systems - Volume 2: Management Issues and Applications., John Wiley & Sons., New York, 1999.