https://doi.org/10.1007/s11064-020-03069-0 ORIGINAL PAPER
Cerebellar Predominant Increase in mRNA Expression Levels of Sirt1 and Sirt3 Isoforms in a Transgenic Mouse Model of Huntington’s Disease
Andras Salamon1 · Rita Maszlag‑Török1 · Gábor Veres1,2 · Fanni Annamária Boros1 · Evelin Vágvölgyi‑Sümegi1 · Anett Somogyi1 · László Vécsei1,2 · Péter Klivényi1 · Dénes Zádori1
Received: 13 January 2020 / Revised: 1 May 2020 / Accepted: 4 June 2020
© The Author(s) 2020
Abstract
The potential role of Sirt1 and Sirt2 subtypes of Sirtuins (class III NAD+-dependent deacetylases) in the pathogenesis of Huntington’s disease (HD) has been extensively studied yielding some controversial results. However, data regarding the involvement of Sirt3 and their variants in HD are considerably limited. The aim of this study was to assess the expression pattern of Sirt1 and three Sirt3 mRNA isoforms (Sirt3-M1/2/3) in the striatum, cortex and cerebellum in respect of the effect of gender, age and the presence of the transgene using the N171-82Q transgenic mouse model of HD. Striatal, cortical and cerebellar Sirt1-Fl and Sirt3-M1/2/3 mRNA levels were measured in 8, 12 and 16 weeks old N171-82Q transgenic mice and in their wild-type littermates. Regarding the striatum and cortex, the presence of the transgene resulted in a significant increase in Sirt3-M3 and Sirt1 mRNA levels, respectively, whereas in case of the cerebellum the transgene resulted in increased expression of all the assessed subtypes and isoforms. Aging exerted minor influence on Sirt mRNA expression levels, both in transgene carriers and in their wild-type littermates, and there was no interaction between the presence of the transgene and aging. Furthermore, there was no difference between genders. The unequivocal cerebellar Sirtuin activation with presumed compensatory role suggests that the cerebellum might be another key player in HD in addition to the most severely affected striatum. The mitochondrially acting Sirt3 may serve as an interesting novel therapeutic target in this deleterious condition.
Keywords Huntington’s disease · Transgenic · Sirt1 · Sirt3 · Sirtuin · Brain
Introduction
Huntington’s disease (HD) is an autosomal dominant neu- rodegenerative disease [66]. HD is caused by expansion of CAG repeats in the IT15 gene encoding Huntington pro- tein (Htt) which has an important role in the maintenance of cellular energy metabolism and mitochondrial function [50]. Previous works demonstrated that mutant Hunting- ton protein (mHtt) inhibits the function of a key metabolic master regulator, namely peroxisome proliferator-activated
receptor-gamma coactivator 1α (PGC-1α), which, amongst others, has an essential role in mitochondrial biogenesis [8, 25].Sirtuins are class III NAD+-dependent deacetylases [38].
Currently there are seven identified mammalian Sirtuin sub- types (SIRT1-7), which are localized in different cellular compartments (nuclear: SIRT1 (the mammalian orthologue of the yeast Silent information regulator 2 protein (Sir2)), -6, -7; mitochondrial: SIRT3, -4, -5; cytoplasmatic: SIRT2) [36]. In addition to the above-detailed subtypes, alterna- tive splicing results in further isoforms of Sirtuins [31, 67].
Several molecular targets of Sirtuins, including the above- mentioned PGC-1α, were identified as participants of the regulation of energy metabolism, circadian rhythm, stress response, apoptosis and aging [38]. The association between SIRTs and neurodegenerative disorders, including HD, has been widely studied using these models [2, 22, 24, 27, 36, 56]. Calorie restriction is capable of increasing SIRT1 pro- tein level in the brain, liver, hearth and white adipose tissue
* Dénes Zádori
zadori.denes@med.u-szeged.hu
1 Department of Neurology, Interdisciplinary Excellence Center, Faculty of Medicine, Albert Szent-Györgyi Clinical Center, University of Szeged, Semmelweis u. 6, Szeged 6725, Hungary
2 MTA-SZTE Neuroscience Research Group of the Hungarian Academy of Sciences, Budapest, Hungary
of mice [39], and also increases the lifespan in the N171- 82Q transgenic (tg) mouse model of HD [11]. In contrast to these findings, exercise, which induces the expression of Sirt3-M1 and -M2 isoforms [47], did not elongate the lifespan in the same mouse model of HD [43]. Regarding Sirt1 mRNA and SIRT1 protein expression changes in HD the results are somewhat inconsistent: SIRT1 protein lev- els were found to be reduced in human brain tissue and in the R6/1 transgenic mouse model of HD as well [18, 41].
Tulino et al. found that SIRT1 activity becomes reduced in R6/2 (with a mean CAG repeat number (MRN) of 204) and HdhQ150 (MRN: 165) mice, in the background of which they hypothesized altered phosphorylation status of SIRT1 via an 5′ AMP-activated protein kinase α1-related mech- anism in the striatum and cerebellum [61]. Although the presence of the transgene did not affect either Sirt1 mRNA, or SIRT1 protein expression in the striatum of R6/2 mice, there was a significant decrease in mRNA expression from 4 to 9 weeks in wild-type (wt) animals [61]. In contrast to these findings, cerebellar Sirt1 mRNA expression increased significantly by 9 and 14 weeks of age in R6/2 mice, whereas SIRT1 protein levels significantly decreased predominantly in wt mice by 14 weeks of age. In HdhQ150 and wt mice the SIRT1 protein level did not show any alteration either in the 2 or in the 22 months old animals [61]. A later whole- brain study reported the elevation of Sirt1 mRNA level in 5, 8 and 11 weeks old R6/2 mice (MRN: 144). However, up-regulation of Sirt1 was only observed in their 8, but not in 12 weeks old counterparts possessing a mean CAG repeat size of 182 [45]. Regarding SIRT1 protein expres- sion, there was a consistent elevation in tg mice with 182 mean CAG repeats in both ages, and when examined at 12 weeks of age, without gender differences [45]. Besides the somewhat inconsistent findings obtained from the above- mentioned studies, the experiments influencing the expres- sion of SIRT1 or of its orthologues from a therapeutic point of view yielded more controversial results. Parker et al.
were the first who demonstrated that Sir2 overexpression and resveratrol (RESV) treatment (one of the most important non-selective Sirtuin inducer) could delay the development of neuronal dysfunction in a Caenorhabditis elegans model of HD (Htt N-terminal fragment, 128Q) in vivo [42]. They also reported that RESV prevented the striatal neuronal cell death in HdhQ111 knock-in mice [42]. To test the potential neuroprotective effect of SIRT1, Jeong et al. crossed a brain- specific Sirt1 knockout mice (BSKO; genotype: Sirt1flox/flox) with the R6/2 HD model mice [22]. They detected the exac- erbation of the neuropathological aspects of HD indicated by lower striatal (neuronal) volume [22], whereas they found the opposite in SIRT1 overexpressing knock-in mice (Sirt1- KI-R6/2). These animals showed longer survival time (30%
extension) and less prominent neuropathological alterations [22]. They proposed that the neuroprotective effect of SIRT1
is exerted through the activation of the cyclic AMP response element binding transcription factor-regulated transcription coactivator 1 factor, which leads to the enhancement of the brain-derived neurotropic factor-mediated neuroprotection [22]. Jiang et al. crossed Sirt1 and N171-82Q or BAC HD transgenic mice which resulted in offsprings with decel- erated disease progression and reduction of brain atrophy probably via the overexpression of Sirt1 [24]. In contrast to these findings, the pharmacological inhibition of SIRT1 by selisistat exerted beneficial effects in both Drosophila and mouse models of HD and was found to be safe in human studies as well [52, 54].
SIRT2, another member of the Sirtuin family, is sus- pected to enhance the disease process in HD. Chopra et al.
reported a beneficial effect of SIRT2 inhibition in R6/2 HD mice [7]. Previously published articles demonstrated that there is an age-dependent SIRT2 accumulation which results in microtubule deacetylation in mouse brain and spinal cord [33]. These alterations lead to the disruption of microtubule- associated cellular transport which is an important compo- nent of the pathogenesis of HD [10, 16]. However, it seems that the ablation of SIRT2 did not prevent the development of HD-related pathological mechanisms in R6/2 mice [5].
Similar to SIRT1, for which most of the results support a protective role in HD, SIRT3 is also proposed to have a beneficial effect regarding the pathogenesis of the disease [38], though the available data are limited. SIRT3 is involved in the regulation of fatty acid oxidation, urea- and amino acid pathways [2]. Striatal administration of a RESV dimer (ε-viniferin treatment) reduced ROS level through SIRT3- mediated superoxide dismutase 2 (SOD2) induction in striatal progenitor cells (Hdh(Q111)) [14]. Some authors suggested that SIRT3 could alleviate the pathological pro- cess in HD through the deacetylation of the mitochondrial complexes (I, II, V) as well [1, 2]. Furthermore, SIRT3 is implicated in autophagy regulation via its effect on chaper- ones [28].
Regarding the role of another Sirtuin isoforms (SIRT4-7) in the pathogenesis of HD, experimental data are lacking.
The aim of the current study was to further elucidate the role Sirt1 and Sirt3 isoforms with presumed beneficial effects in HD, because the available data are somewhat con- troversial regarding Sirt1, and no deep assessment was done regarding the M1, M2 and M3 isoforms of Sirt3. For that purpose the authors applied a multi-dimensional approach to simultaneously assess the effect of the transgene, the time course of the disease and their interaction as well in addition to the screening of regional and possible gender-related dif- ferences in the N171-82Q tg mouse model of HD.
Materials and Methods
Animals8, 12 and 16 weeks old N171-82Q and as their control, B6C3 wt mice with identical genetic background (female and male animals distributed equally) were involved in this study (n = 6–7 in each group). The HD model mice origi- nally came from Jackson Laboratories (USA). They were housed in cages under standard conditions with 12–12 h light-dark cycle. The food and water were freely available.
The experiments were carried out in accordance with Euro- pean Communities Council Directive (86/609/EEC) and were approved by the local animal care committee. All ani- mals were euthanized via isoflurane overdose (Forane; Abott Laboratories Hungary Ltd., Budapest, Hungary).
Sample Handling
The brains were rapidly removed from the skull and both hemispheres were dissected into the following brain areas:
striatum, cortex and cerebellum. The tissue samples were stored at − 80 °C until the RT-PCR analysis.
RT‑PCR Analysis
To perform the RT-PCR analysis, total RNA was isolated from the striatal, cortical and cerebellar samples with Tri- zol reagent according to manufacturer’s protocol (Molecu- lar Research Center, USA). The RNA concentration was determined with MaestroNano spectrophotometer. The RNA integrity was certified by 1% gel electrophoresis. For cDNA synthesis 1 µg of total RNA, random hexamer prim- ers and reverse transcriptase were used (Revert Aid First Strand cDNA Synthesis Kit; Thermo Scientific, USA). The synthesized cDNA was stored at − 20 °C. Real-time PCR analysis (CFX 96 Real Time System; Bio-Rad, USA) with various Sirtuin primers was performed in 20 µl final vol- ume using syber green label (PCR Biosystems, USA) [47].
Primer sequences and the exact thermal cycling conditions are described in our previous work [47]. We used the 18S rRNA as endogenous control (Applied Biosystems, USA).
To calculate the relative mRNA expression levels, we used the 2−∆∆Ct method [30].
Statistics
All statistical calculations were performed with the use of the freely available R software (R Development Core Team).
First, the relative mRNA expression levels were calculated separately regarding each gene (i.e., Sirt1 or Sirt3), but they
were normalized to the striatal level of the main subtype or isoform (i.e., Sirt1-Fl and Sirt3-M1) of 8 weeks old wt mice in each case to allow a time course analysis of the changes of expression patterns. Then we checked the dis- tribution of data populations with the Shapiro–Wilk test and the homogeneity of variances with the Levene’s test.
In several cases the data diverged from Gaussian distribu- tion and the variances were not equal. For that reason, we applied the Sheirer-Ray-Hare test to determine the differ- ences between the investigated factors and their interaction as well. Afterwards, we carried out permutation t-tests as post hoc analysis for pairwise comparison and Type I errors from multiple comparisons were controlled with false dis- covery rate. As some of the possible comparisons would not have yielded meaningful information regarding the a priori decided presumptions, a maximum of 9 pairwise compari- sons were implemented in case of each subtype or isoform analyzed by each brain region. The results were considered significant when the corrected p values were greater than 0.05. The data were presented as median and 1st and 3rd quartiles (Figs. 1, 2, 3, 4, 5).
Results
We could not detect any significant difference between male and female mice regarding the expression of any of the assessed Sirtuin isoforms either in the wt or in the tg groups, so they were pooled for further analyses. Fur- thermore, in respect of Sirt1 and Sirt3 expression, no inter- action was found between the presence of the transgene and aging. Focusing on their separate effects, there was a significant elevation of Sirt1-Fl (full length) expres- sion in all the cortical and cerebellar samples of 8, 12 and 16 weeks old tg animals compared to wt mice (cortex (8 weeks: p = 0.0029; 12 weeks: p = 0.0018; 16 weeks:
p = 0.0029); cerebellum (8 weeks: p = 0.0052; 12 weeks:
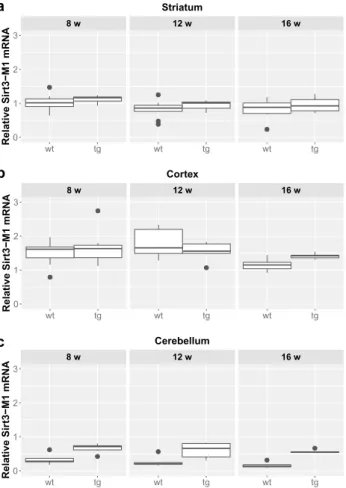
p = 0.0054; 16 weeks: p = 0.0065), but not in the striatum (Figs. 1 and 5). Regarding the effect of aging on Sirt1-Fl expression levels, we detected significant increase only in the cerebellum of tg group at 16 weeks of age (8 vs. 16 weeks: p = 0.0245; 12 vs. 16 weeks: p = 0.0316). There was no detectable change in Sirt3-M1 expression in the striatum and cortex of any age groups (8, 12, 16 weeks).
In contrast, there was a clear elevation of Sirt3-M1 mRNA expression in cerebellar samples of all age groups of tg animals compared to wt mice (8 weeks: p = 0.0024; 12 weeks: = 0.0024; 16 weeks: p = 0.0024; Figs. 2 and 5). We could not observe any age-related effect in the Sirt3-M1 isoform in either group. Regarding Sirt3-M2 we could not detect any difference between wt and tg groups in the stri- atal and cortical samples, but we could identify a signifi- cant elevation in the cerebellum of tg animals in each age
group compared to wt controls (8 weeks: p = 0.0021; 12 weeks: p = 0.0012; 16 weeks: p = 0.0021; Figs. 3 and 5).
When assessing the effect of aging on Sirt3-M2 expression levels, we detected significant decrease only in the cortex of wt group at 16 weeks of age (8 vs. 16 weeks: p = 0.038;
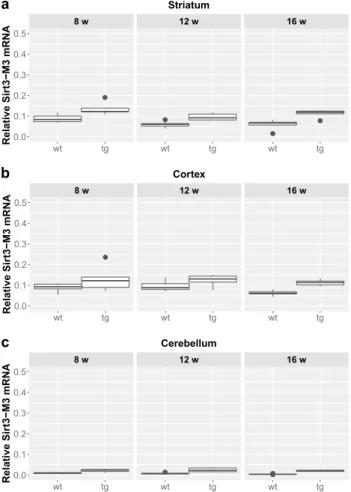
12 vs. 16 weeks: p = 0.038). The expression of Sirt3-M3 elevated in each striatal and cerebellar tg groups, but only in the 16 weeks old group in the tg cortex compared to wt mice (striatum (8 weeks: p = 0.0097; 12 weeks: p = 0.0054;
16 weeks: p = 0.0097); cortex (16 weeks: p = 0.0032);
cerebellum (8 weeks: p = 0.002; 12 weeks: p = 0.0006; 16 weeks: p = 0.0016) (Figs. 4 and 5). In the striatal Sirt3-M3 samples there was detectable decrease of expression by 12 weeks of age in both wt and tg animals (8 vs. 12 weeks (wt-wt): p = 0.0243; 8 vs. 12 weeks (tg–tg): p = 0.036).
Discussion
HD is a neurodegenerative disorder, which has currently no curative treatment, but encouraging clinical trials are ongo- ing (e.g. antisense oligonucleotide treatment) [13, 56]. These therapeutic approaches target the pathological trinucleotide repeat expansion in the mutant hunting in mRNA, the extent of which has been demonstrated to have the strongest asso- ciation with the age of disease onset and severity [12, 26, 37]. However, other important influencing factors of the dis- ease have already been identified as well, which may serve as good candidates for the augmentation of beneficial effects obtained by the currently available therapies [32, 64].
Sirtuins are surely involved in the neurodegenerative pro- cess in HD, however, there are controversial results regard- ing their role [36, 38, 45, 61]. Further studies are needed to clarify these controversies and to better explore the role of
8 w 12 w 16 w
wt tg wt tg wt tg
0.0 0.5 1.0 1.5 2.0 2.5
Relative Sirt1−Fl mRNA
Striatum
a
8 w 12 w 16 w
wt tg wt tg wt tg
0 1 2 3
Relative Sirt1−Fl mRNA
Cortex
b
8 w 12 w 16 w
wt tg wt tg wt tg
0.0 2.5 5.0 7.5 10.0
Relative Sirt1−Fl mRNA
Cerebellum
c
Fig. 1 Relative mRNA expression level of Sirt1-Fl in the striatum (a), cortex (b) and cerebellum (c) of N171-82Q transgenic and B6C3 wild-type mice of three age groups. The Sirt1-Fl level significantly elevated in all cortical and cerebellar samples in each age group of tg animals compared to wt mice. Aging caused a significant increase only in the cerebellum of tg group by 16 weeks of age. For clarity, the levels of significance were indicated separately in Fig. 5 in a special table format. Values are plotted as medians and interquartile ranges;
tg = transgenic, wt = wild-type, w = weeks
8 w 12 w 16 w
wt tg wt tg wt tg
0 1 2 3
Relative Sirt3−M1 mRNA
Striatum
a
8 w 12 w 16 w
wt tg wt tg wt tg
0 1 2 3
Relative Sirt3−M1 mRNA
Cortex
b
8 w 12 w 16 w
wt tg wt tg wt tg
0 1 2 3
Relative Sirt3−M1 mRNA
Cerebellum
c
Fig. 2 Relative mRNA expression level of Sirt3-M1 in the striatum (a), cortex (b) and cerebellum (c) of N171-82Q transgenic and B6C3 wild-type mice of three age groups. The Sirt3-M1 level was signifi- cantly elevated in all cerebellar samples in each age group of tg ani- mals compared to wt mice. For clarity, the levels of significance were indicated separately in Fig. 5 in a special table format. Values are plotted as medians and interquartile ranges; tg = transgenic, wt = wild- type, w = weeks
different Sirtuin subtypes and isoforms obtained by alterna- tive splicing [2, 22, 24, 27, 36, 56]. Accordingly, we aimed at contributing to the clarification of the controversies regarding Sirt1 and Sirt3 mRNA expression patterns by a better characterization of region- and aging-specific changes in the mRNA expression levels of Sirt1 and three Sirt3 iso- forms using the N171-82Q tg mouse model of HD.
Tulino et al. found a significant decrease in striatal Sirt1 mRNA expression from 4 to 9 weeks in the wt group, whereas cerebellar Sirt1 mRNA expression increased significantly by 9 and 14 weeks of age in the same con- trol group in experiments with R6/2 mouse model of HD (MRN: 204) [61]. The presence of the transgene seemingly did not affect Sirt1 mRNA expression. Another research group (Reynolds et al.) measured Sirt1 mRNA levels in the whole-brain samples of 5, 8, 11- (MRN: 144) and 8, 12
weeks old (MRN: 182) R6/2 mice [45]. In the 5, 8 and 11 weeks old mice (MRN: 144) there was a significant increase in mRNA levels of all tg groups. Aging did not affect the values and accordingly there was no significant interaction between age and the presence of the transgene. Regarding the only female cohort with 182 mean CAG repeat size, the significant increase could be observed only in the 8 weeks old group [45]. Due to the different CAG repeats, ages, brain regions and gender composition the comparability of these results is limited. Therefore, we find it important to get closer to the unbiased preclinical modelling of changes in Sirt1 mRNA expression in HD. Thus, we paid a special attention to study design regarding the following points: we used the N171-82Q tg model of HD, because the phenotype of these mice mimics better the majority of human cases with considerable similarities in pathological alterations as
8 w 12 w 16 w
wt tg wt tg wt tg
0.0 0.2 0.4 0.6
Relative Sirt3−M2 mRNA
Striatum
a
8 w 12 w 16 w
wt tg wt tg wt tg
0.0 0.2 0.4 0.6
Relative Sirt3−M2 mRNA
Cortex
b
8 w 12 w 16 w
wt tg wt tg wt tg
0.0 0.2 0.4 0.6
Relative Sirt3−M2 mRNA
Cerebellum
c
Fig. 3 Relative mRNA expression level of Sirt3-M2 in the stria- tum (a), cortex (b) and cerebellum (c) of N171-82Q transgenic and B6C3 wild-type mice of three age groups. The Sirt3-M2 level was significantly elevated in all cerebellar samples in each age group of tg animals compared to wt mice. Aging caused a significant decrease only in the cortex of wt group by 16 weeks of age. For clarity, the levels of significance were indicated separately in Fig. 5 in a special table format. Values are plotted as medians and interquartile ranges;
tg = transgenic, wt = wild-type, w = weeks
8 w 12 w 16 w
wt tg wt tg wt tg
0.0 0.1 0.2 0.3 0.4 0.5
Relative Sirt3−M3 mRNA
Striatum
a
8 w 12 w 16 w
wt tg wt tg wt tg
0.0 0.1 0.2 0.3 0.4 0.5
Relative Sirt3−M3 mRNA
Cortex
b
8 w 12 w 16 w
wt tg wt tg wt tg
0.0 0.1 0.2 0.3 0.4 0.5
Relative Sirt3−M3 mRNA
Cerebellum
c
Fig. 4 Relative mRNA expression level of Sirt3-M3 in the striatum (a), cortex (b) and cerebellum (c) of N171-82Q transgenic and B6C3 wild-type mice of three age groups. The Sirt3-M3 level was signifi- cantly elevated in all striatal and cerebellar samples in each age group of tg animals compared to wt mice. The striatal expression decreased significantly by 12 weeks of age in both wt and tg animals. For clar- ity, the levels of significance were indicated separately in Fig. 5 in a special table format. Values are plotted as medians and interquartile ranges; tg = transgenic, wt = wild-type, w = weeks
well than the R6/2 tg mice, the symptoms of which mainly resemble that of juvenile HD cases. Furthermore, the authors have extensive previous experiences with this model [15, 35, 40, 59, 62, 63, 68, 69], which enables the drawing of indirect correlations between the characteristic features of disease progression with the time course of the changes in mRNA expression patterns. Characteristically, in N171-82Q mice the symptoms begin to develop at approximately 2 months of age and disease progression results in a mean survival time of 110–130 days [68, 69]. Accordingly, the study of mice at the age of 8, 12 and 16 weeks may represent early, moderate and advanced stages of the modelled disease. In addition to the assessment of the presence of transgene on Sirt mRNA expression changes in key structures (striatum, overlying cortex, cerebellum) of the regulation of motor functions, our study design involved the determination of the effect of aging and its interaction with the presence of the transgene with a view on gender-related effects as well. First of all, we found no significant differences between genders regarding either of the above-mentioned aspects, and there- fore gender issues seemingly did not introduce bias into the studies of Tulino et al. and Reynolds et al. [45, 61]. Similarly to the study of Tulino et al. [61], we found no effect of the
transgene in the striatum regarding either age groups, but a marked increase in Sirt1 expression was demonstrated in cortical and cerebellar samples of tg animals compared to wt controls in all age groups similar to that found by Reyn- olds et al. [45] applying whole brain samples. The magni- tude of difference increased only by 16 weeks of age, and again, similarly to the latter study, no significant interaction was found between aging and the presence of the transgene.
Aging-related increase in Sirt1 mRNA expression either in the striatal or cerebellar samples of wt mice, found by Tulino et al. [61], could not be confirmed by the current study.
Although data suggest that the induction of mitochon- drially acting SIRT3 may be capable of exerting benefi- cial effects in a HD model [14], the expression pattern of Sirt3 mRNA isoforms has never been studied in any HD model. Similar to that found in case of Sirt1-Fl, a remark- able increase of cerebellar expression of all Sirt3 isoforms could be observed in tg animals compared to wt controls in the current study. The striatal expression of Sirt-M3 in all age groups and the cortical expression of Sirt3-M3 by 16 weeks of age were found to be increased. However, we have to note here that the relative expression level of Sirt3-M3 mRNA is considerably lower compared to that of the other
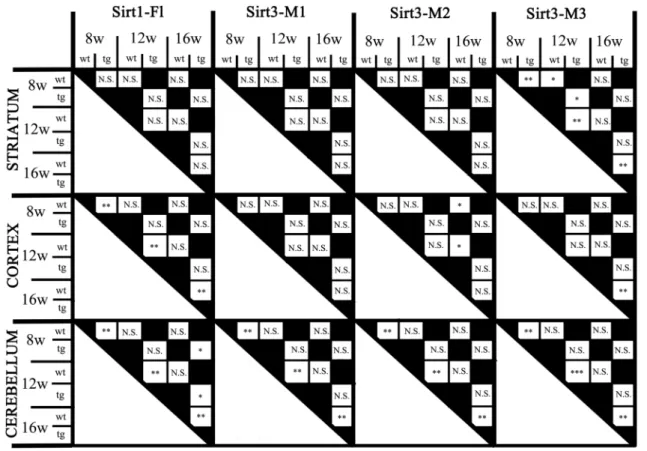
Fig. 5 The statistical delineation of the effect of the transgene and the time course of the neurodegenerative process on the expression pattern of Sirt1 and Sirt3 isoforms. In addition to the presented sta-
tistical differences, there were no significant interactions between the presence of the transgene and age. *p < 0.05, **p < 0.01, ***< 0.001;
N.S. = not significant; tg = transgenic, wt = wild-type, w = weeks
two isoforms. The expression level of cortical Sirt3-M2 in wt mice and striatal Sirt3-M3 in wt and tg mice decreased by 16 and 12 weeks of age, respectively.
The pattern of expression changes in the cerebellum regarding any of the assessed Sirt subtypes and isoforms strongly resembles to that of PGC-1α expression changes (either of its full length or N-terminal fragment) as we have shown in a previous study using the same animal model of HD [58]. The reason behind the same pattern may be that Sirtuins are upstream regulators of PGC-1α expression [8, 25]. Similar cerebellar predominant PGC-1α activation was induced by long-term physical exercise [47] and by 1-methyl-4-phenyl-1,2,3,6-tetrahydropyridine (MPTP) treat- ment in its acute phase [60], but not by cooling, by short- term exercise [47], or by 3-nitropropionic acid (3-NP), the toxin used for modeling HD-associated striatal damage [58, 65].Although the cerebellum is known not to be the primar- ily affected structure in HD, there is increasing evidence of its involvement in the pathomechanism of the disorder [48]. A considerable loss of Purkinje cells was demonstrated in some HD patients with predominant motor symptoms [51], the extent of which may become more pronounced in patients with higher CAG repeat number [19]. However, there is no clear relationship between the disease stage and the degree of Purkinje and granular cell loss, and the degree of cerebellar degeneration is quite variable [17, 23, 46]. The exact background of this variability, involving the sparing of alterations as well in some human cases, is not known and needs further elucidation. Nevertheless, some studies proved cerebellar hypermetabolism in HD [44] with a presumed compensatory role for dysfunction in the fronto-striato- thalamic motor circuit [9, 53]. The significant elevations in cerebellar PGC-1α [58] and Sirt mRNA expressions in the N171-82Q HD model may be considered as an important part of this compensatory cerebellar hypermetabolism. Fur- thermore, the increased Sirt3 mRNA expression indicates the involvement of mitochondrial activation as well. The beneficial role of the Sirt – PGC-1α axis in intact cerebellar functioning may be further supported by the finding that FL-PGC-1α knockout mice demonstrated reactive astroglio- sis in cerebellar nuclei, whereas the striatum and cortex were almost totally spared [55]. Although data obtained from the above-mentioned toxin studies are somewhat controversial, this may be resolved by considering that in case of 3-NP the most vulnerable structures are the striatum and the hip- pocampus, and not the cerebellum [34], whereas MPTP is capable of inducing cerebellar degeneration as well in addi- tion to its well-known deleterious effects on the nigrostri- atal system [57]. However, the mRNA expression changes in Sirt1 and Sirt3 levels following MPTP intoxication were not significant either in its acute or chronic phase (unpub- lished data).
Regarding genotype-phenotype correlations, the first description of the applied N171-82Q transgenic mouse model of HD has already demonstrated that in addition to cortical, hippocampal, amygdalar and striatal involvement, an expressed deposition of intranuclear inclusions were present in cerebellar granule cells as well [49]. It was also verified by the authors, but no remarkable neuronal loss or reactive astrogliosis was found [40]. This may be explained by that the presence of abundant intranuclear inclusions does not compulsorily equals to severe neuronal damage, indeed, it was presumed to exert protective effects [3]. This may further support our hypothesis that coping mechanisms in the cerebellum, including inclusion body formation and enhanced expression pattern of the Sirt – PGC-1α axis, dem- onstrated by the current and previous studies [59] of the authors, may be capable of exerting rather neuroprotective than damaging effects. Accordingly, the progression of the decrease of coordination, which was described as one of the key features of this model and probably attributed to cerebellar dysfunction, could be observed from 3 months of age on [20]. However, the hypokinetic feature of N171-82Q transgenic mice, rather explained by the dysfunction of the basal ganglia, involving the striatum, was still present at 8 weeks of age [69]. The evidence from unbiased anatomi- cal work-ups of the authors also favors the above-detailed hypothesis, i.e., more than 20% of striatal neurons contained intranuclear inclusions at 16 weeks of age, whereas no remarkable neuronal loss, but prominent neuronal atrophy could be detected at this age, responsible for the decrease of striatal volume and brain weight [69]. However, besides the well demonstrated atrophy of striatum, cortex, hippocampus, hypothalamus, thalamus and amygdala, the volume of the cerebellum was still preserved even at 18 weeks of age [6].
The characteristic pattern observed in preclinical findings could not be confirmed on human samples, where Sirt1, -2, and -3 mRNA levels were assessed, demonstrating elevated cortical and striatal Sirt1 and striatal Sirt2 expression in HD patients without any change regarding Sirt3 or the cerebel- lum [4]. However, this gene expression study was carried out on post-mortem samples obtained from multiple centers, and the postmortem delay of sample handling and other char- acteristics of the specimens were not given, so their effect on individual differences in mRNA decay cannot be ruled out introducing a bias into the results. Nevertheless, further human studies are needed to be able to better determine the human relevance of the current preclinical findings.
The major limitation of the current study is the lack of experiments on protein expression changes of the corre- sponding Sirtuins. However, the widely applied antibody- based methods in this topic (e.g. Western blotting) are semi- quantitative at best, mostly lacking appropriate sensitivity and specificity [29]. Although the application of deep pro- teomic analysis by mass spectrometry is appropriate, but
quite challenging [21], especially in case of brain samples with considerably high lipid content. Accordingly, this was out of the scope of the current study. Nevertheless, future experiments are needed to confirm the results of the present work at proteome level.
In conclusion, the current study demonstrates an unequiv- ocal elevation of Sirt1 mRNA expression level in the cortical and cerebellar samples of HD transgenic animals compared to their age-matched wild-type littermates. An increase of these differences with aging could be observed only in the cerebellum of transgenic animals, presumably related to dis- ease progression. Regarding the expression pattern of the mitochondrially acting Sirt3 isoforms (M1, M2, M3), which have not been assessed before in HD, a similar transgene- specific increase of their cerebellar level was observed, and only the striatum showed a likewise elevation of exclusively the M3 isoform regarding the other 2 assessed brain regions.
Accordingly, the observed pattern of changes with a pre- sumed compensatory role may draw attention to that the involvement of cerebellum in HD may be more pronounced than previously thought, yielding a novel target for therapeu- tic approaches aiming at symptom relief in that deleterious condition.
Acknowledgements Open access funding provided by University of Szeged (SZTE). The research was supported by GINOP-2.3.2-15-2016- 00034, EFOP-3.6.1-16-2016-00008, the Ministry of Human Capaci- ties, Hungary [20391-3/2018/FEKUSTRAT] and the Hungarian Brain Research Program [2017-1.2.1-NKP-2017-00002 NAP VI/4] grants.
Compliance with Ethical Standards
Conflict of interest The authors declare that they have no conflict of interest.
Open Access This article is licensed under a Creative Commons Attri- bution 4.0 International License, which permits use, sharing, adapta- tion, distribution and reproduction in any medium or format, as long as you give appropriate credit to the original author(s) and the source, provide a link to the Creative Commons licence, and indicate if changes were made. The images or other third party material in this article are included in the article’s Creative Commons licence, unless indicated otherwise in a credit line to the material. If material is not included in the article’s Creative Commons licence and your intended use is not permitted by statutory regulation or exceeds the permitted use, you will need to obtain permission directly from the copyright holder. To view a copy of this licence, visit http://creat iveco mmons .org/licen ses/by/4.0/.
References
1. Ahn BH, Kim HS, Song S, Lee IH, Liu J, Vassilopoulos A et al (2008) A role for the mitochondrial deacetylase Sirt3 in regulating energy homeostasis. Proc Natl Acad Sci USA 105:14447–14452.
https ://doi.org/10.1073/pnas.08037 90105
2. Ajami M, Pazoki-Toroudi H, Amani H, Nabavi SF, Braidy N, Vacca RA et al (2017) Therapeutic role of sirtuins in
neurodegenerative disease and their modulation by polyphenols.
Neurosci Biobehav Rev 73:39–47. https ://doi.org/10.1016/j.neubi orev.2016.11.022
3. Arrasate M, Mitra S, Schweitzer ES, Segal MR, Finkbeiner S (2004) Inclusion body formation reduces levels of mutant hun- tingtin and the risk of neuronal death. Nature 431:805–810. https ://doi.org/10.1038/natur e0299 8
4. Baldo B, Gabery S, Soylu-Kucharz R, Cheong RY, Henningsen JB, Englund E et al (2019) SIRT1 is increased in affected brain regions and hypothalamic metabolic pathways are altered in Hun- tington disease. Neuropathol Appl Neurobiol 45:361–379. https ://
doi.org/10.1111/nan.12514
5. Bobrowska A, Donmez G, Weiss A, Guarente L, Bates G (2012) SIRT2 ablation has no effect on tubulin acetylation in brain, cho- lesterol biosynthesis or the progression of Huntington’s disease phenotypes in vivo. PLoS ONE 7:e34805. https ://doi.org/10.1371/
journ al.pone.00348 05
6. Cheng Y, Peng Q, Hou Z, Aggarwal M, Zhang J, Mori S et al (2011) Structural MRI detects progressive regional brain atro- phy and neuroprotective effects in N171-82Q Huntington’s disease mouse model. Neuroimage 56:1027–1034. https ://doi.
org/10.1016/j.neuro image .2011.02.022
7. Chopra V, Quinti L, Kim J, Vollor L, Narayanan KL, Edgerly C et al (2012) The sirtuin 2 inhibitor AK-7 is neuroprotective in Huntington’s disease mouse models. Cell Rep 2:1492–1497. https ://doi.org/10.1016/j.celre p.2012.11.001
8. Cui L, Jeong H, Borovecki F, Parkhurst CN, Tanese N, Krainc D (2006) Transcriptional repression of PGC-1alpha by mutant hun- tingtin leads to mitochondrial dysfunction and neurodegeneration.
Cell 127:59–69. https ://doi.org/10.1016/j.cell.2006.09.015 9. Deckel AW (1995) Is Huntington’s disease of cerebellar/brain-
stem origin? Lancet 345:263–264. https ://doi.org/10.1016/S0140 -6736(95)90260 -0
10. Dompierre JP, Godin JD, Charrin BC, Cordelières FP, King SJ, Humbert S et al (2007) Histone deacetylase 6 inhibition compen- sates for the transport deficit in Huntington’s disease by increas- ing tubulin acetylation. J Neurosci 27:3571–3583. https ://doi.
org/10.1523/JNEUR OSCI.0037-07.2007
11. Duan W, Guo Z, Jiang H, Ware M, Li XJ, Mattson MP (2003) Dietary restriction normalizes glucose metabolism and BDNF lev- els, slows disease progression, and increases survival in huntingtin mutant mice. Proc Natl Acad Sci USA100:2911–2916. https ://doi.
org/10.1073/pnas.05368 56100
12. Duyao M, Ambrose C, Myers R, Novelletto A, Persichetti F, Fron- tali M et al (1993) Trinucleotide repeat length instability and age of onset in Huntington’s disease. Nat Genet 4:387–392. https ://
doi.org/10.1038/ng089 3-387
13. Frank S (2014) Treatment of Huntington’s disease. Neurothera- peutics 11:153–160. https ://doi.org/10.1007/s1331 1-013-0244-z 14. Fu J, Jin J, Cichewicz RH, Hageman SA, Ellis TK, Xiang L et al
(2012) Trans-(-)-ε-Viniferin increases mitochondrial sirtuin 3 (SIRT3), activates AMP-activated protein kinase (AMPK), and protects cells in models of Huntington Disease. J Biol Chem 287:24460–24472. https ://doi.org/10.1074/jbc.M112.38222 6 15. Gardian G, Browne SE, Choi DK, Klivenyi P, Gregorio J, Kubi-
lus JK et al (2005) Neuroprotective effects of phenylbutyrate in the N171-82Q transgenic mouse model of Huntington’s disease.
J Biol Chem 280:556–563. https ://doi.org/10.1074/jbc.M4102 10200
16. Gunawardena S, Her LS, Brusch RG, Laymon RA, Niesman IR, Gordesky-Gold B et al (2003) Disruption of axonal transport by loss of huntingtin or expression of pathogenic polyQ proteins in Drosophila. Neuron 40:25–40. https ://doi.org/10.1016/s0896 -6273(03)00594 -4
17. Gutekunst CA, Norflus F, Hersch SM (2002) The neuropathology of Huntington’s disease. In: Bates GP, Harper PS, Jones AL (eds) Huntington’s disease, 4th edn. OUP, Oxford, pp 251–275 18. Hathorn T, Snyder-Keller A, Messer A (2011) Nicotinamide
improves motor deficits and upregulates PGC-1α and BDNF gene expression in a mouse model of Huntington’s disease. Neurobiol Dis 41:43–50. https ://doi.org/10.1016/j.nbd.2010.08.017 19. Hedjoudje A, Nicolas G, Goldenberg A, Vanhulle C, Dumant-
Forrest C, Deverrière G et al (2018) Morphological features in juvenile Huntington disease associated with cerebellar atrophy:
magnetic resonance imaging morphometric analysis. Pediatr Radiol 48:1463–1471. https ://doi.org/10.1007/s0024 7-018-4167-z 20. Ho DJ, Calingasan NY, Wille E, Dumont M, Beal MF (2010)
Resveratrol protects against peripheral deficits in a mouse model of Huntington’s disease. Exp Neurol 225:74–84. https ://doi.
org/10.1016/j.expne urol.2010.05.006
21. Jayasena T, Poljak A, Braidy N, Zhong L, Rowlands B, Muench- hoff J et al (2016) Application of targeted mass spectrometry for the quantification of sirtuins in the central nervous system. Sci Rep 6:35391. https ://doi.org/10.1038/srep3 5391
22. Jeong H, Cohen DE, Cui L, Supinski A, Savas JN, Mazzulli JR et al (2011) Sirt1 mediates neuroprotection from mutant hunting- tin by activation of the TORC1 and CREB transcriptional path- way. Nat Med 18:159–165. https ://doi.org/10.1038/nm.2559 23. Jeste DV, Barban L, Parisi J (1984) Reduced Purkinje cell den-
sity in Huntington’s disease. Exp Neurol 85:78–86. https ://doi.
org/10.1016/0014-4886(84)90162 -6
24. Jiang M, Wang J, Fu J, Du L, Jeong H, West T et al (2011) Neu- roprotective role of Sirt1 in mammalian models of Huntington’s disease through activation of multiple Sirt1 targets. Nat Med 18:153–158. https ://doi.org/10.1038/nm.2558
25. Jodeiri Farshbaf M, Ghaedi K (2017) Huntington’s disease and mitochondria. Neurotox Res 32:518–529. https ://doi.org/10.1007/
s1264 0-017-9766-1
26. Kay C, Collins JA, Miedzybrodzka Z, Madore SJ, Gordon ES, Gerry N et al (2016) Huntington disease reduced penetrance alleles occur at high frequency in the general population. Neurol- ogy 87:282–288. https ://doi.org/10.1212/WNL.00000 00000 00285 27. La Spada AR (2012) Finding a sirtuin truth in Huntington’s dis-8
ease. Nat Med 18:24–26. https ://doi.org/10.1038/nm.2624 28. Liang Q, Benavides GA, Vassilopoulos A, Gius D, Darley-Usmar
V, Zhang J (2013) Bioenergetic and autophagic control by Sirt3 in response to nutrient deprivation in mouse embryonic fibroblasts.
Biochem J 454:249–257. https ://doi.org/10.1042/BJ201 30414 29. Liebler DC, Zimmerman LJ (2013) Targeted quantitation of pro-
teins by mass spectrometry. Biochemistry 52:3797–3806. https ://
doi.org/10.1021/bi400 110b
30. Livak KJ, Schmittgen TD (2001) Analysis of relative gene expres- sion data using real-time quantitative PCR and the 2(-Delta Delta C(T)) method. Methods 25:402–408. https ://doi.org/10.1006/
meth.2001.1262
31. Lynch CJ, Shah ZH, Allison SJ, Ahmed SU, Ford J, Warnock LJ et al (2010) SIRT1 undergoes alternative splicing in a novel auto-regulatory loop with p53. PLoS ONE 5:e13502. https ://doi.
org/10.1371/journ al.pone.00135 02
32. MacDonald ME, Vonsattel JP, Shrinidhi J, Couropmitree NN, Cupples LA, Bird ED et al (1999) Evidence for the GluR6 gene associated with younger onset age of Huntington’s disease. Neu- rology 53:1330–1332. https ://doi.org/10.1212/wnl.53.6.1330 33. Maxwell MM, Tomkinson EM, Nobles J, Wizeman JW, Amore
AM, Quinti L et al (2011) The Sirtuin 2 microtubule deacetylase is an abundant neuronal protein that accumulates in the aging CNS. Hum Mol Genet 20:3986–3996. https ://doi.org/10.1093/
hmg/ddr32 6
34. Mirandola SR, Melo DR, Saito A, Castilho RF (2010) 3-nitropro- pionic acid-induced mitochondrial permeability transition: com- parative study of mitochondria from different tissues and brain regions. J Neurosci Res 88:630–639. https ://doi.org/10.1002/
jnr.22239
35. Molnár MF, Török R, Szalárdy L, Sümegi E, Vécsei L, Klivényi P (2016) High-dose 1,25-dihydroxyvitamin D supplementation elongates the lifespan of Huntington’s disease transgenic mice.
Acta Neurobiol Exp (Wars) 76:176–181. https ://doi.org/10.21307 /ane-2017-017
36. Naia L, Rego AC (2015) Sirtuins: double players in Huntington’s disease. Biochim Biophys Acta 1852:2183–2194. https ://doi.
org/10.1016/j.bbadi s.2015.07.003
37. Nance MA (2017) Genetics of Huntington disease. Handb Clin Neurol 144:3–14. https ://doi.org/10.1016/B978-0-12-80189 3-4.00001 -8
38. Neo SH, Tang BL (2017) Sirtuins as modifiers of Huntington’s disease (HD) pathology. Prog Mol Biol Transl 154:105–145. https ://doi.org/10.1016/bs.pmbts .2017.11.013
39. Nisoli E, Tonello C, Cardile A, Cozzi V, Bracale R, Tedesco L et al (2005) Calorie restriction promotes mitochondrial biogenesis by inducing the expression of eNOS. Science 310:314–317. https ://doi.org/10.1126/scien ce.11177 28
40. Oláh J, Klivényi P, Gardián G, Vécsei L, Orosz F, Kovacs GG et al (2008) Increased glucose metabolism and ATP level in brain tissue of Huntington’s disease transgenic mice. FEBS J 275:4740–
4755. https ://doi.org/10.1111/j.1742-4658.2008.06612 .x 41. Pallàs M, Verdaguer E, Tajes M, Gutierrez-Cuesta J, Camins A
(2008) Modulation of sirtuins: new targets for antiageing. Recent Pat CNS Drug Discov 3:61–69. https ://doi.org/10.2174/15748 89087 83421 492
42. Parker JA, Arango M, Abderrahmane S, Lambert E, Tourette C, Catoire H et al (2005) Resveratrol rescues mutant polyglutamine cytotoxicity in nematode and mammalian neurons. Nat Genet 37:349–350. https ://doi.org/10.1051/medsc i/20052 15556 43. Potter MC, Yuan C, Ottenritter C, Mughal M, van Praag H (2010)
Exercise is not beneficial and may accelerate symptom onset in a mouse model of Huntington’s disease. PLoS Curr 2:RRN1201.
https ://doi.org/10.1371/curre nts.RRN12 01
44. Rees EM, Farmer R, Cole JH, Haider S, Durr A, Landwehrmeyer B (2014) Cerebellar abnormalities in Huntington’s disease: a role in motor and psychiatric impairment? Mov Disord 29:1648–1654.
https ://doi.org/10.1002/mds.25984
45. Reynolds RH, Petersen MH, Willert CW, Heinrich M, Nymann N, Dall M et al (2018) Perturbations in the p53/miR-34a/SIRT1 pathway in the R6/2 Huntington’s disease model. Mol Cell Neu- rosci 88:118–129. https ://doi.org/10.1016/j.mcn.2017.12.009 46. Rodda RA (1981) Cerebellar atrophy in Huntington’s dis-
ease. J Neurol Sci 50:147–57. https ://doi.org/10.1016/0022- 510x(81)90049 -6
47. Salamon A, Török R, Sümegi E, Boros F, Pesei ZG, Fort Molnár M et al (2019) The effect of physical stimuli on the expression level of key elements in mitochondrial biogenesis. Neurosci Lett 698:13–18. https ://doi.org/10.1016/j.neule t.2019.01.003 48. Samson M, Claassen DO (2017) Neurodegeneration and
the cerebellum. Neurodegener Dis 17:155–165. https ://doi.
org/10.1159/00046 0818
49. Schilling G, Becher MW, Sharp AH, Jinnah HA, Duan K, Kotzuk JA et al (1999) Intranuclear inclusions and neuritic aggregates in transgenic mice expressing a mutant N-terminal fragment of huntingtin. Hum Mol Genet 8:397–407. https ://doi.org/10.1093/
hmg/8.3.397
50. Schulte J, Littleton JT (2011) The biological function of the Hun- tingtin protein and its relevance to Huntington’s disease pathology.
Curr Trends Neurol 5:65–78
51. Singh-Bains MK, Mehrabi NF, Sehji T, Austria MDR, Tan AYS, Tippett LJ et al (2019) Cerebellar degeneration correlates with motor symptoms in Huntington disease. Ann Neurol 85:396–405.
https ://doi.org/10.1002/ana.25413
52. Smith MR, Syed A, Lukacsovich T, Purcell J, Barbaro BA, Worthge SA et al (2014) A potent and selective Sirtuin 1 inhibi- tor alleviates pathology in multiple animal and cell models of Huntington’s disease. Hum Mol Genet 23:2995–3007. https ://doi.
org/10.1093/hmg/ddu01 0
53. Squitieri F, Pustorino G, Cannella M, Toscano A, Maglione V, Morgante L (2003) Highly disabling cerebellar presentation in Huntington disease. Eur J Neurol 10:443–444. https ://doi.org/10 .1046/j.1468-1331.2003.00601 .x
54. Süssmuth SD, Haider S, Landwehrmeyer GB, Farmer R, Frost C, Tripepi G et al (2015) An exploratory double-blind, randomized clinical trial with selisistat, a SirT1 inhibitor, in patients with Hun- tington’s disease. Br J Clin Pharmacol 79:465–476. https ://doi.
org/10.1111/bcp.12512
55. Szalardy L, Zadori D, Plangar I, Vecsei L, Weydt P, Ludolph AC (2013) Neuropathology of partial PGC-1α deficiency recapitulates features of mitochondrial encephalopathies but not of neurode- generative diseases. Neurodegener Dis 12:177–188. https ://doi.
org/10.1159/00034 6267
56. Tabrizi SJ, Leavitt BR, Landwehrmeyer GB, Wild EJ, Saft C, Barker RA (2019) Targeting Huntingtin expression in patients with Huntington’s disease. N Engl J Med 380:2307–2316. https ://doi.org/10.1056/NEJMo a1900 907
57. Takada M, Sugimoto T, Hattori T (1993) MPTP neurotoxicity to cerebellar Purkinje cells in mice. Neurosci Lett 150:49–52. https ://doi.org/10.1016/0304-3940(93)90105 -t
58. Torok R, Konya JA, Zadori D, Veres G, Szalardy L, Vecsei L et al (2015) mRNA expression levels of PGC-1α in a transgenic and a toxin model of Huntington’s disease. Cell Mol Neurobiol 35:293–301. https ://doi.org/10.1007/s1057 1-014-0124-z 59. Török R, Kónya JA, Zádori D, Veres G, Szalárdy L, Vécsei L
et al (2015) mRNA expression levels of PGC-1α in a transgenic and a toxin model of Huntington’s disease. Cell Mol Neurobiol 35:293–301. https ://doi.org/10.1007/s1057 1-014-0124-z 60. Török R, Salamon A, Sümegi E, Zádori D, Veres G, Molnár MF
et al (2017) Effect of MPTP on mRNA expression of PGC-1α in mouse brain. Brain Res 1660:20–26. https ://doi.org/10.1016/j.
brain res.2017.01.032
61. Tulino R, Benjamin AC, Jolinon N, Smith DL, Chini EN, Car- nemolla A et al (2016) SIRT1 activity is linked to its brain
region-specific phosphorylation and is impaired in Huntington’s disease mice. PLoS ONE 11:e0145425. https ://doi.org/10.1371/
journ al.pone.01454 25
62. Vamos E, Voros K, Zadori D, Vecsei L, Klivenyi P (2009) Neu- roprotective effects of probenecid in a transgenic animal model of Huntington’s disease. J Neural Transm (Vienna) 116:1079–1086.
https ://doi.org/10.1007/s0070 2-009-0253-6
63. Vamos E, Voros K, Vecsei L, Klivenyi P (2010) Neuroprotec- tive effects of L-carnitine in a transgenic animal model of Hun- tington’s disease. Biomed Pharmacother 64:282–286. https ://doi.
org/10.1016/j.bioph a.2009.06.020
64. van Dellen A, Hannan AJ (2004) Genetic and environmental fac- tors in the pathogenesis of Huntington’s disease. Neurogenetics 5:9–17. https ://doi.org/10.1007/s1004 8-003-0169-5
65. Veres G, Molnár M, Zádori D, Szentirmai M, Szalárdy L, Török R et al (2015) Central nervous system-specific alterations in the tryptophan metabolism in the 3-nitropropionic acid model of Hun- tington’s disease. Pharmacol Biochem Behav 132:115–124. https ://doi.org/10.1016/j.pbb.2015.03.002
66. Vonsattel JP, Myers RH, Stevens TJ, Ferrante RJ, Bird ED, Rich- ardson EP Jr et al (1985) Neuropathological classification of Hun- tington’s disease. J Neuropathol Exp Neurol 44:559–577. https ://
doi.org/10.1097/00005 072-19851 1000-00003
67. Yang Y, Hubbard BP, Sinclair DA, Tong Q (2010) Characteri- zation of murine SIRT3 transcript variants and corresponding protein products. J Cell Biochem 111:1051–1058. https ://doi.
org/10.1002/jcb.22795
68. Zádori D, Geisz A, Vámos E, Vécsei L, Klivényi P (2009) Valproate ameliorates the survival and the motor performance in a transgenic mouse model of Huntington’s disease. Phar- macol Biochem Behav 94:148–153. https ://doi.org/10.1016/j.
pbb.2009.08.001
69. Zádori D, Nyiri G, Szonyi A, Szatmári I, Fülöp F, Toldi J et al (2011) Neuroprotective effects of a novel kynurenic acid analogue in a transgenic mouse model of Huntington’s disease. J Neural Transm (Vienna) 118:865–875. https ://doi.org/10.1007/s0070 2-010-0573-6
Publisher’s Note Springer Nature remains neutral with regard to jurisdictional claims in published maps and institutional affiliations.