Chromatographic Analysis
B Y
W A L T E R G . B E R L
The Applied Physics Laboratory, Johns Hopkins University, Silver Spring, Maryland
CONTENTS
Page
1. Introduction 5 9 1
2. Theory of Chromatographic Analysis 593
2.1. Elution Analysis 594 2.1.1. Formation of Bands 595
2.1.2. Development 596 2.1.3. Complete Separation 596
2.2. Frontal Analysis 597 2.3. Partition Chromatography 600
3. Basic Experiments ^04
4. Apparatus 6 0 7
5. Adsorbents 6 0 7
6. Identification of Solutes 6 1 1
7. Reactions with Adsorbents 6 1 3
8. Resolution of Optical Isomers 6 1 5
References 6 1 6
I. I N T R O D U C T I O N
Chromatographic analysis includes separation techniques based on differential partition of solutes between a moving and a stationary phase.
Included are liquid-solid, gas-solid a n d liquid-liquid systems. T h e difference between chromatographic analysis a n d t h e well-known adsorp- tion from solution a n d partition between solvents is in t h e modification of experimental techniques whereby adsorption a n d desorption a n d partition are repeated a large n u m b e r of times. Thus, chromatographic analysis can be compared t o fractional distillation or crystallization.
Chromatographic analysis is primarily a separation technique. Since it can be readily applied t o microgram quantities of material a n d often permits almost q u a n t i t a t i v e recovery of t h e starting substances, it has become an extremely powerful tool in t h e separation a n d identification of complex mixtures. U n d e r favorable circumstances, positive identifi- cation of particular compounds in a mixture and q u a n t i t a t i v e estimates
591
592
of their concentration can be m a d e . This is particularly useful when dealing with members of homologous series (sugars, amino acids) (41, 43).
M e i n h a r d (34) has given a schematic outline a n d classification of possible interactions between a mobile fluid containing mixtures t h a t are to be resolved a n d a stationary phase on which fractional separation proceeds. B y choosing four physical states in which t h e solutes can be found in t h e mobile or immobile phase, sixteen types of interactions are deduced. Some of these are recognized as well established techniques.
Others are either in a n early stage of development or are not expedient for use. T h e classification into four major sections is not strictly precise.
However, t h e outline serves to separate the field of adsorption analysis into a n u m b e r of logical groups.
TABLE I
Type of Competitive Interaction Primary mode
Class Mobile Solid Representative of action Class
phase phase phenomena Ionic: (solubility prod- 1 Ions Ions Ion exchange
uct, instability con- 2 Complex Ions Ion exchange
stant, etc.) 3 Ions Complex Inorganic chromatography 4 Complex Complex (Not reported)
5 Ions Dispersion Fractional decomposition methods
6 Complex Dispersion Fractional decomposition methods
7 Dispersion Dispersion Diffusion of colloids, mac- romolecules
8 Ions Association Electrokinetics 9 Dispersion Ions (Not reported) 10 Dispersion Complex (Not reported)
Nonionic: H-bonding: 11 Association Association Organic (and partition) dipole, and/or induced chromatography
dipole; geometry of 12 Association Dispersion Catalytic polymerization molecules (partition 13 Association Ions Catalytic dissociation coefficients) 14 Association Complex (Not reported)
15 Complex Association (Not reported) 16 Dispersion Association Salting-out adsorption
I n Table I the following definitions a p p l y :
I o n : A solute particle having a definite electrical charge a n d charac- terized b y a simple structure a n d subcolloidal dimensions.
Complex: T h e product of a reversible interaction between a solute particle of simple structure and a complexing agent t o form a new species.
C H R O M A T O G R A P H I C A N A L Y S I S 593 T h e combination usually involves linkages of an auxiliary, or coordinate, character. T h e complex m a y itself be a simple structure (charged or uncharged), or it m a y be a relatively large a n d complicated aggregation of particles appearing as a colloidal dispersion, as a precipitate, or as an immobile deposit on t h e solid phase.
Dispersion: T h e product of a reversible interaction of a solute with another solute, or with t h e solvent itself, t o produce a species having a decreased association with t h e solvent. This decrease in association becomes evident in t h e aggregation of particles t o form a colloidal dis- persion or a visible precipitate. I n this discussion t h e t e r m dispersion is not intended t o include those dispersions arising from a process of com- plexing as described in t h e preceding p a r a g r a p h . I t does, however, include dispersions of proteins, silicates, soaps, dyes, organic polymers, and other particles which m a y or m a y n o t be ionically charged, depending upon p H , adsorption or occlusion of ions, presence of dissociable groups, etc.
Association: A m u t u a l a t t r a c t i o n between a solute particle a n d another substance (either in t h e liquid or solid phase, or b o t h ) , or between two solute particles of t h e same species, which does not involve t h e establishment of fixed bonds. This interaction is characterized, rather, as a loosely b o u n d complex of indeterminate composition arising from t h e geometry of t h e molecules involved, from dipole a n d induced dipole interactions, from resonating electrostatic attractions, or from other imperfectly understood factors. T h e " b o n d energies" involved, insofar as this t e r m m a y be applied here, lie in t h e neighborhood of two t o eight kilocalories per mole, as contrasted with t h e m u c h greater b o n d energies involved in t h e t y p e s of aggregation discussed previously.
2 . T H E O R Y O F C H R O M A T O G R A P H Y A N A L Y S I S
T h e chromatographic analysis t h a t depends on differences in adsorp- tion of solute between phases (gas-solid, liquid-solid) can be divided into three groups: ( 1 ) frontal analysis; ( 2 ) elution analysis; ( 3 ) displacement analysis. I n frontal analysis solutes a n d solvent are passed through t h e column containing t h e adsorbent a n d t h e effluent is continuously analyzed for t h e appearance a n d concentration of components. I n elution analysis solutes and solvent are introduced into t h e column where a preliminary separation m a y t a k e place as in frontal analysis. Subsequently, one or several solvents of different eluting properties are added t o t h e t o p of t h e column a n d a further separation of solutes is effected thereby. I t is not necessary in this case t o elute until t h e solutes appear in t h e effluent provided means are available t o locate t h e b a n d s into which t h e various solutes are separated. T h e theoretical t r e a t m e n t of this t y p e of separa-
594
tion has been discussed in detail b y Wilson, D e Vault, Weiss a n d Glueckauf (14, 17, 18, 19, 20, 40, 52, 53, 57). These theories have been of great assistance in unravelling t h e various factors t h a t influence t h e resolution of a mixture. T h e main factors entering into t h e discussion are t y p e of adsorption between solute a n d adsorbent (i.e. Langmuir, Freundlich, sigmoid isotherm, etc.), m u t u a l competition between solutes for adsorp
tion sites, influence of incomplete equilibrium, diffusion a n d pore space between adsorbent particles. I n displacement analysis solutes are added t o t h e column as in elution analysis a n d are developed b y a solvent con
taining a n additional solute more strongly adsorbed on t h e column t h a n any of t h e components already present.
2.1. Elution Analysis
Glueckauf has developed a detailed theory of t h e differential equations t h a t can be set u p for a system of multiple components in elution analysis.
T h e simplest case of separation of t w o solutes obeying Langmuir's adsorption law is presented here. Separation is brought about b y differ
ential rates of m o v e m e n t of solutes when eluted with pure solvent.
T h e b a n d s formed originally are of constant intensity. On addition of pure solvent t h e various zones begin t o move. T h e r a t e of m o v e m e n t of the forward edge (Fig l b ) is given b y
X« = (f + 0 o) c iE/ / * D V > + « c2° (1)
where χ = distance from t o p of column (expressed in grams of adsorbent)
v° = volume of solvent in which solutes a t concentration CI°
and c2° are contained.
ν = a m o u n t of solvent added for development a = pore v o l u m e / g r a m of adsorbent
/2(cl C 2) = #2 = equilibrium a m o u n t of substance 2 adsorbed on one gram of adsorbent in presence of concentration CI a n d C2 /2(C lc2) + 0LC2 = a m o u n t of solute 2 contained in volume filled b y one gram
of adsorbent if local concentrations of solutes in t h e solvent are Ci a n d ci
As development proceeds, t h e regions of constant composition a r e changed into regions of varying concentration. In these regions, move
m e n t of fronts proceeds according t o
χ = v/(a + / 1 W 2 ) ) = ν/{jot + / 2 W 2 ) )
A general equation for multiple solutes following Langmuir's isotherm can be developed. F o r t w o solutes
/ I ( cxc2) = Qi β d\Ci/(\ + αφ\θι + αιβιΟζ) / 2 ( cl C, ) = 92 = A 2 C 2/ ( l + AIJSICI + « 2 ^ 2 0 2 )
CHROMATOGRAPHIC ANALYSIS 595 where a = adsorption coefficient
β = a m o u n t of adsorbent required so t h a t one mole of solute covers surface in a m o n o molecular layer.
F r o m (2) a n d (3)
/ i W a > = + &2C2 - O2C1 · dc2/dci){\ + 61C 1 + 62C2)8 (2a) /2,(cl C |) =» «2(1 + O1C1 — biCt · dci/cfc2)(l + biCi -f 62C2)2 (3a) where b = αβ
δ = (α2 — di)/ai
A t a n y point / 1 ' a n d jY are equal a n d relation between coexisting concentrations of t h e two solutes can be calculated.
a2biCi = αιθ2θ2λ — (a% — αι)λ/(1 -f- λ) where λ is an integration constant.
(4)
Γ
ο
- i f -
1+%
υ
y
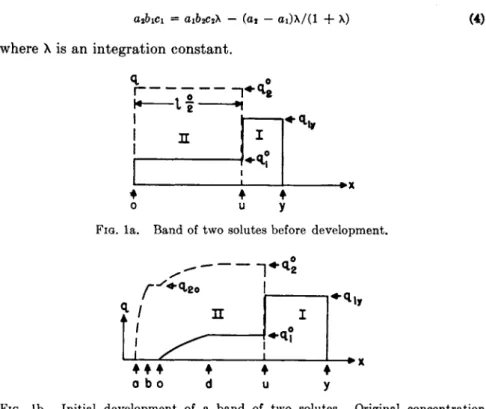
FIG. la. Band of two solutes before development.
* /
/ Ir
^ 1*·* .
*<t2o
0 b 0 u
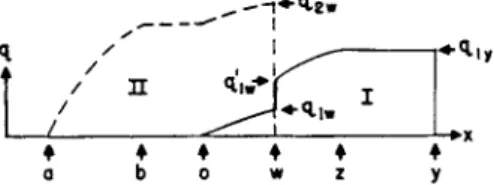
FIG. lb. Initial development of a band of two solutes. Original concentration preserved in forward part of the band.
2.1.1. Formation of Bands. Let v0 of solvent containing ci° a n d c2° of solutes 1 a n d 2 be added t o t h e column t o give a b a n d as shown in Fig. l a . T h e following relations can be w r i t t e n :
X u = Z20 = V 0C2°//2(Cl0C20) = Vo((l + *>iCi° + 6 2C20)/a2 91° = /l(Ci°C,°) = O1C1VCI + 61C10 + 62c2°)
720 = /2(ci°C2°) - a^/il + + &2C20)
Let mi a n d ra2 be the total quantities of solute a d d e d . T h e a m o u n t of solute 1 between ο a n d u is
W i, O _U = rn2qi0/q2° =
m\a\ja
2a n d t h e separated q u a n t i t y of 1
w i i. U- v — mi(a2 — α ι ) / α2
T h e concentration of 1 rises sharply at xu to Civ = Ci°(l 4- λι)/λ·
F r o m (4)
t/iv = aiciv/fl 4- 6iCiy) a n d from (1)
xy = t>°(l 4 6iCiv)/ai
2.12. Development. If a further volume ν of solvent is added t o t h e column t h e bands, dissolving from t h e t o p end a n d moving down t h e column undergo changes.
FIG. lc. Full development of the mixed band. Separated band I has its original concentration.
FIG. Id. Further development and spreading of bands I and II.
A t first, t h e concentration in t h e forward section remains unchanged, followed b y a section in which t h e concentration of b o t h solutes decreases, the less adsorbed going to zero. This is followed b y a constant section of t h e more strongly adsorbed solute, followed b y a variable section (Fig. l b ) .
T h e position of t h e various points of concentration change a r e : c2o = «/6,(l + λ)
Χα = v/f
2f(c
2= 0) = v/a
2xu = v/J
2l{c
2o) = t>(l + b2C
2o)
2/a
2Xv = (v + t>o)c2V/2(ci°C2°) =
(v
+ t>°)(l + 6ici° +b
2c
2Q)/a
2x
v= (v + v
Q)ci
v/fi(ciy) = {v 4- »°)(1 4- bici
v)/ai
CHROMATOGRAPHIC ANALYSIS 597 Xb cannot reach x0 since ~ = 1 + ^ ^ _^ ^ This b a n d shift persists until Xd overtakes xVj when t h e development of solute 2 is complete.
After 2 is fully developed its frontal concentration c2u> begins t o decrease.
Ciw = Λ / 77ls/&St>(l + λ)
T h e concentration of front of solute 1 is
Ciw = \{flibi/ai — bi) Λ/(7712/620(1 + λ ) ) — λ ( α2 — α ι ) / α2δ ι ( ι + λ)
T h e concentration of solute 1 on t h e other side of t h e discontinuity is
CiJ - - λ ί1 ^ - o i) / ( l + λΛαιδι = c i . = (1 + λ ι ) / λ ι
After t h e b a n d of solute 2 h a s been fully developed, t h e concentration of pure solute 1 also changes (Fig. l c ) .
2.1.8. Complete Separation. Development will continue with further addition of solvent, t h e frontal concentration of 1 becoming continually smaller (Fig. I d ) .
Volume V required for complete separation
V = m262( l + λ ) / δ *
2.2. Frontal Analysis
T h e t h e o r y of frontal a n d displacement analysis has been developed by Claesson (8, 9, 10).
Consider a column filled with adsorbent, s a t u r a t e d with p u r e solvent.
T h e solution t o be analyzed is t h e n a d d e d a n d t h e effluent analyzed continuously for content of solute.
T h e volume of pure solvent leaving t h e column before t h e appearance of solute is t h e retention volume (v)a, after correction for t h e pore space between t h e solid particles a n d for t u b e losses, such as volume change of solid due t o adsorption of solutes. T h e retention volume divided b y t h e weight of adsorbent is t h e "specific retention volume (v0)".
Let a = a m o u n t of solute adsorbed c = concentration of solute in solution t h e n a = vc, or, per gram of a d s o r b e n t :
a0 = v°c.
If a0 is plotted against c one obtains t h e adsorption isotherm, since a° is in equilibrium with solution of concentration c.
L e t / ( c ) = adsorption i s o t h e r m / g r a m adsorbent, t h e n a<> = /(c) = v° c.
f(c)
If t h e isotherm is curved t o w a r d t h e abscissa, t h e n v° = will decrease c
as c increases. A n isotherm of this kind allows establishment of a sharp front within t h e column. If t h e front is disturbed (by variation in
598
column packing density, for example) a bulge will form giving rise t o sideways concentration gradients. T h e concentration of this diffused material is less t h a n t h a t in t h e undisturbed solution a n d t h e front will move more slowly and be overtaken eventually b y t h e main front.
Irregularities in t h e rear, on t h e other hand, will tend to amplify. For isotherms curved away from t h e abscina t h e arguments are reversed.
CI
p i.
ι C2,
2
2 C2,
3
3
'Cm-1,
fe p i . m-1 ICH7
|m-1
b :
| C i,
LL
Cm+iJ m + 1 1
C m, | m
Cm+iJ m + 1 1
C m, | m Cm, ,
m il 1
Cm-1, m C i, Π 1
m C i, ι m+1 1
C i- 1 , 1
m
C i, ι m+1 1
C i- 1 , 1
m Ci-1,1 m-l-1 | - - I f | C i,
R I C«. I
m+1 [
|Cn-2,|
n-1 Cn-1,
n-1
C1, n-1 C n, η Cn-1,
η C n- 2 ,
η
C1,
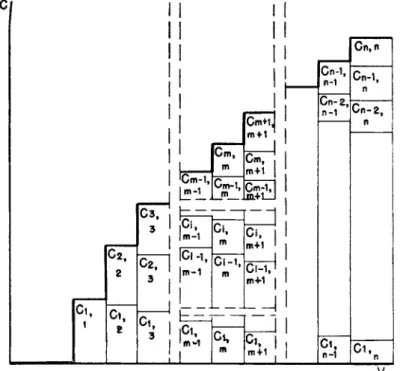
FIG. 2. Volume-concentration diagram for η components in frontal analysis.
If two solutes are present in solution two steps will be observed in t h e effluent if t h e isotherms of t h e two substances are not identical. T h e height of t h e steps is not a direct measure of concentration due t o m u t u a l competition of solutes for adsorption sites.
Let αχ° = a m o u n t of substance 1 adsorbed per gram from solution of concentration C\ of solute 1 and concentration c2 of solute 2, a n d a2° = a m o u n t of substance 2 adsorbed from t h e same solution, t h e n αι° = fi{ch c2)
a2° = /2(ci, c2)
T h e adsorption isotherm f(ci) for t h e case of one solute only is larger t h a n/ ( c i , c2) for t h e same solute in presence of another substance. Thus, in frontal analysis, t h e concentration of substance 1 in t h e first step will
C H R O M A T O G R A P H I C A N A L Y S I S 590 be greater t h a n in t h e original solution due t o t h e substance 2 p a r t l y dis
placing substance 1 from t h e adsorbent. F o r t w o solutes, ax a n d a2 can be calculated from t h e experimental d a t a , a2 = v2c2y since t h e solution passes unchanged t h r o u g h t h e adsorbent after t h e second step. T h e a m o u n t of solute 1 adsorbed equals ai = v2Ci — (v2 — v^)ch where t h e second term expresses t h e a m o u n t of solute 1 adsorbed in t h e first step.
I n case of three or more solutes it is n o t possible t o determine t h e adsorbed a m o u n t s from frontal analysis a n d isotherms cannot be derived from analysis of effluent alone.
F o r t h e general case of a solution containing η solutes in concentration Ci, c2, c3, . . . cn, t h e a m o u n t at° of solute per gram of adsorbent is a function of all components. at° = /»(ci, c2, c3 . . . cn) where t h e function /»· is t h e adsorption isotherm for substance i in presence of substances 1, 2, 3 . . . , c — 1, c + 1, . . . n. I n most c a s e s / , increases with c», b u t decreases when Cj(j j£ i) increases, or when a n additional solute, η + 1 is added. A schematic composition diagram for t h e case of η solutes is shown in Fig. 2.
Consider t h e section of a column where S represents t h e position of a front which on leaving t h e column would cause t h e step having a reten
tion volume vm+i (Fig. 3). A t t h e lower b o u n d a r y , Li, t h e concentration Li
Τ r
FIG. 3 . Schematic cross section through chromatographic column.
of t h e different components in solution between t h e particles is C i ,m, c2,m,
. . . Cm.m, a n d a t t h e u p p e r b o u n d a r y L2, t h e concentrations are C i ,m +i , C2,m+i . . . Cm+i.m+i. Below A S t h e a m o u n t s adsorbed are
CLi,m0 — fi(Ci,mC2,m+l ' ' ' Cm,m)
Above S
di.m+10 = / i ( C i . m+ l C 2. m + l ' * * Cm+ l , m + l )
Let a small volume ν be forced into t h e column. T h e a m o u n t of substance i t r a n s p o r t e d across t h e boundaries L\ a n d L2 is AvCi,m and Avci,m+i. T h e a m o u n t of material added t o t h e section between Li and L2 is Av(ci,m+i — Ci,m). As a consequence t h e front S moves a distance Ax downwards.
600
If there are M0 grams of adsorbent and χ t h e e m p t y volume per u n i t length
Av(Ci,m+l — C t . m ) = AxM0[fi(Ci.m+iC2,m+l ' ' ' Cm+i,m+l) —
fi{Ci.mC2,m ' ' ' Cm.rn)]
+
AXA(Cl,m+l — C\,m)and
AV _ _ Mofi(Ci,mC2.m ' ' ' Cm.rn) ~ / t ( C l . m + l C 2.m + l ' ' ' Cm + l.m+l) AX Ci.m — C t . m+ 1
Δ - is t h e volume of solution t o move front S one centimeter down t h e χ V .
column. For every component i
y 0 fi(Ci,mC2,m * * * Cm.rn) fi{fii,m+lC2.m + l ' ' ' C m + l . r o + l) Ci,m Ci,m ~\~ 1
For components m + 1, giving rise t o front S and found only above S
0 _ / m + l ( C i , m_ ( _ i C 2. m +l ' ' ' Cm + i,m+l) VM+I — -
Cm+l.m+1
I n order t o get results applicable in practice, the isotherm m u s t be known.
If components 1, 2 · · · / — 1, i + 1 · · · η are present
i ( C i, C-2 · ' ' Cn) =
1 + ^ In
so t h a t
0 _ km+lCm+l.m + l
n + 1 1 +
3 = 1
^ IjCj.m + l
2.8. Partition Chromatography
T h e chromatographic analysis t h a t depends on separation b y parti
tion of solutes between two phases is carried o u t b y immobilizing one phase within a solid framework. This framework itself should have no or very limited adsorptive powers for t h e solutes. T h e simplest case is a column filled with a porous solid containing water or organic solvent as t h e fixed phase. Solutes having t h e larger distribution coefficient for the stationary phase will be retained in t h e upper p a r t of t h e column.
Instead of granular materials (silica gel (12, 31), starch (36)) cellulose in form of paper sheets s a t u r a t e d with t h e stationary solvent can be used (33, 51) (Paper C h r o m a t o g r a p h y ) . T h e t h e o r y of separation b y parti
tion assumes t h e existence of "theoretical plates," in analogy with liquid-
CHROMATOGRAPHIC ANALYSIS 601 vapor fractionation t h e o r y (32). T h e height equivalent of a theoretical plate ( H E T P ) is defined as t h e w i d t h of a layer of column so t h a t the solution leaving it is in equilibrium with t h e m e a n concentration of solute in the non-mobile phase within this layer. I t is further assumed t h a t no diffusion of solute takes place between plates a n d t h a t t h e distribution ratio of one solute between two phases is independent of its absolute concentration a n d of t h e presence of other solutes.
Let R = height equivalent of a theoretical plate A = column cross section (A — AL = A8 = A^
As = non-mobile phase cross section AL = mobile phase cross section
Ai = inert solid cross section
ν = volume of solvent used in development
_ . , grams solute in non-mobile phase a = partition coefficient = r -τ—: π r
^ grams solute in mobile phase V = h(AL + A,)
r = serial n u m b e r of plate as measured from t o p Qr = total q u a n t i t y of solute in plate r
R = m o v e m e n t of position of m a x i m u m concentration of solute, divided b y simultaneous m o v e m e n t of surface of developing fluid i n e m p t y p a r t of column above solid
Let unit mass of a single solute be contained in the first plate. P u r e solvent is used for development. Table I I shows t h e q u a n t i t y of solute in each plate after successive infinitesimal volumes dv of mobile phase have passed through t h e column.
TABLE II
Volume of mobile phase nv
Serial number of plate Volume of mobile phase
nv
1 2 3 4
0 1 0 0 0
1 1 - v/V υ IV 0 0
2 (ί - v/vy 2(1 - V/V) y
(*)•
0T h e concentration of solute in each plate can be expressed b y t h e binomial expansion ^ 1 — + ; so t h a t after passage, of η volumes
Qr+ 1= n!( l - | ) " - ( f ) 7 H ( n - , )!
602
where η is large
b u t therefore
1 / dvy
ndv = V
e-ndv/V
* » - a ( f ) ' " '
For r > 10, b y Stirling approximation
• " - V C C T ) ' ' - '
Qr+i
is a m a x i m u m a n d equal t o — ~ = when = 1, so t h a t t h e posi-V27rr
r ytion of m a x i m u m concentration h a s moved a distance ^yt directly propor
tional t o volume ν of developing liquid.
I n t e r m s of m o v e m e n t of solvent in t h e unobstructed p a r t of t h e t u b e
R = vh/V =Ah ^ A = AL + As + 4 /
» / A F A L + A,a AL + <xA8
A useful t e r m in paper chromatography is RF, t h e ratio of t h e distance of m o v e m e n t of m a x i m u m concentration of solute divided b y t h e distance of m o v e m e n t of t h e developing solvent in t h e column.
RF - A
In actual operation t h e assumption of zero diffusion between plates will n o t be valid for low flow velocities. A p a r t from this, H E T P is proportional t o flow velocity a n d t o t h e square of particle diameter.
Diffusion rate in t h e solvent is also i m p o r t a n t , particularly in case of large molecules of low diffusivity. T h e assumption of constancy of dis
t r i b u t i o n r a t i o with concentration is usually n o t strictly true, decreasing with increase in concentration. This leads t o sharpening of t h e front b o u n d a r y a n d weakening of t h e rear, since t h e concentrated p a r t of t h e mixture moves more rapidly. M u t u a l interaction of solutes often leads t o improved separation, t h e more strongly adsorbed eluting t h e less.
T h e presence of inorganic salts in t h e mixture m a y lead t o complica
tions due t o ion exchange on t h e cellulose, giving rise t o zones of high a n d of low pH. These zones m a y interfere with subsequent developing pro
cedures. If t h e sample is sufficiently large t h e salts of strong acids can be removed b y electrodialysis. W h e n this procedure is inapplicable
CHROMATOGRAPHIC ANALYSIS 603 due t o t h e n u m b e r a n d smallness of t h e samples t h e developing procedure m u s t be a d e q u a t e t o overcome these disturbing influences. I n separation of amino acids obtained from hydrolyzed material, chemical development with ninhydrin produces a yellow spot in t h e glycine-alanine region caused b y a n inorganic alkaline zone. T h e alkaline spot interferes with color development of neighboring amino acids. B y use of acidified ninhydrin this interference can be minimized (13).
Distribution m a p s h a v e been prepared giving t h e approximate loca- tion of members of homologous series (amino acids, sugars (42)) in t w o dimensional chromatograms. Extensive tables of RF values for a variety of compounds are also available (sugars (25), pterins (21)). Positive identification is best carried out b y parallel development of unknowns, t h e probable pure substance a n d mixture of t h e two. If t h e position of t h e spots after development are identical, particularly from two different solvent pairs, t h e identification is certain w i+h a high degree of probability.
One of t h e most a d e q u a t e supports for t h e s t a t i o n a r y liquid phase (water) is cellulose in form of filter paper. F o r most compounds t h e adsorption effects are small a n d partition between mobile a n d stationary phase t h e predominant factor. N o supporting t u b e is necessary for small scale experiments, t h e paper hanging from a trough filled with eluant within a large container. T h e latter is s a t u r a t e d prior to t h e chromatographic analysis with w a t e r a n d solvent vapor. Large scale separations on paper are possible b y packing paper strips on t o p of one another in a suitable container.
T h e u n k n o w n is added t o t h e t o p of t h e paper as a single drop. After elution is complete t h e solvent is e v a p o r a t e d a n d t h e position of t h e constituents located b y suitable chemical or physical reactions. If for a given solvent pair some of t h e constituents of a complex mixture are not resolved, it is possible to provide further separation b y eluting with a different solvent at right angle t o t h e first paper chromatogram. F o r this purpose, a square paper is suitable with t h e initial drop placed in one corner. After chromatographing with one solvent pair in t h e usual m a n - ner t h e solvents are removed b y drying, t h e paper t u r n e d t h r o u g h 90°
a n d elution with t h e second solvent pair commenced.
Q u a n t i t a t i v e evaluation of paper c h r o m a t o g r a p h y depends t o a large degree on t h e n a t u r e of t h e substances. T h e location of t h e position of t h e various constituents can be determined b y carrying out two parallel elutions, developing one b y a suitable m e t h o d a n d using t h e p a t t e r n t o locate t h e corresponding spots in t h e parallel chromatograph. These spots are separated a n d tested individually b y a suitable* procedure.
Resolution is difficult if RF values differ b y less t h a n 1 0 % . Repro- ducibility for duplicate analysis is b e t t e r t h a n 4 % in t h e RF values.
604
3. B A S I C E X P E R I M E N T S
A foundation has been laid in t h e theoretical understanding of chroma- tographic analysis by emphasizing t h e essential importance of t h e adsorp- tion isotherms a n d t h e m u t u a l influence of multiple solutes on one another. T h u s , it is possible, in principle, t o predict t h e separation behavior if sufficient information is available on t h e t y p e a n d magnitude of the adsorption isotherms.
A very i m p o r t a n t prerequisite for t h e understanding of the chromato- graphic process is the elucidation of t h e forces responsible for t h e inter- action between solute a n d adsorbent. This is particularly true since t h e usefulness of chromatographic analysis lies in t h e fact t h a t it makes use of very small differences in physical properties between closely related compounds. I n physical adsorption, one can distinguish two essential factors t h a t influence the magnitude of the effect, t h e operation of oriented forces between solute a n d adsorbent a n d a geometrical "fit."
T h e detail understanding of these two factors for a n y b u t t h e simplest molecules is still in its infancy. For this reason t h e accumulation of a considerable body of experimental information is necessary in guiding the understanding. Regarding t h e interaction between adsorbent and solute a close parallel exists with problems encountered in heterogeneous catalysis where the orientation a n d binding forces are of p a r a m o u n t importance in t h e subsequent reactions. Comparatively few systematic experiments h a v e been carried out to establish t h e p r i m a r y factors responsible for adsorption. These can be considered from the standpoint of a) adsorbent, b) structure of solute, c) medium effects.
a) T h e types of adsorbents useful in chromatographic analysis will be discussed more fully in Section 5. T h e y comprise the field of polar hydrophylic solids, principally oxides, h y d r a t e d oxides and salts. F o r some applications, organic adsorbents (sugars, polysaccharides) are useful. I n contrast to ion exchange, t h e bond between adsorbent and adsorbate is of addition adsorption t y p e a n d depends on t h e lattice struc- t u r e of t h e adsorbent and t h e polarizability of t h e solute.
T h e influence of structure of t h e solute is based on either chemical or stereochemical considerations. B r o c k m a n n (4), b y varying t h e side chains on azobenzene has determined t h e sequence of separation indicated in Table I I I .
T h e R o m a n numerals express t h e activity of t h e aluminum oxide adsorbent. Pairs in t h e same horizontal row cannot be separated using benzene as solvont. This difficulty, however, can be overcome b y small changes in the solvent composition. T h u s cyclohexane-ethylacetate (9:1) will separate p-amino azobenzene from t h e p-acetoxy azobenzene.
CHROMATOGRAPHIC ANALYSIS 605 TABLE III
1 RCOOH
V
2 ROH
IV
3 R N H C O C H3
III
4 R N H C O C6H5
III
5 R N H2, ROCOCH3
III
6 RCHO II
7 ROCOC6H6
II
8 R N ( C H3)2, R N H2
I
9 ROCHs I
10 RC1, RCH3, RH
R = azobenzene skeleton.
Roman numerals = degree of activity of aluminum oxide adsorbent,
T h e following deductions are possible: Side chains contribute t o adsorp- tion in t h e order — C O O H , — O H , — N H2, — C O , C O O C H3, C H30 . Esterification of a hydroxyl group decreases adsorption. Carbonyl groups, whether in aldehydes, ketones, esters show approximately t h e same adsorptive effect, — N 02 groups are not effective.
Under favorable conditions compounds of varying hydrocarbon chain length can be separated cleanly if t h e chain differs b y one CH2 group only. T h u s the p-phenyl phenacyl esters of straight chain f a t t y acids from acetic t h r o u g h caproic h a v e been separated on silica gel. I n t h e higher fatty acids partial separation of palmitic (16C) from stearic acid (18C) was achieved. U n s a t u r a t i o n permits separation of com- pounds of t h e same chain length from t h e equivalent s a t u r a t e d compound.
An increase in t h e n u m b e r of functional groups generally represents an increase in t h e strength of adsorption.
T h e importance of structural factors is indicated b y t h e fact t h a t optical isomers can be separated under favorable circumstances. Cis- t r a n s isomers of azobenzene are instructive in pointing out an empirical rule b y Berl a n d Wachendorff, t h a t t h e strength of adsorption on a hydrophylic solid (silica gel) is larger if t h e solvent is hydrophobic and vice versa (2). I n comparing t h e adsorption of cis a n d transazobenzene by alumina a n d charcoal it is found t h a t t h e cis compound is adsorbed most strongly b y A I 2 O 3 from petroleum ether, less strongly from m e t h y l alcohol. T h e t r a n s compound is adsorbed more strongly on carbon from
606
methyl alcohol. T h u s , the more hydrophylic solute (cis isomer) is adsorbed more thoroughly b y hydrophylic adsorbents (A1203) in a hydrophobic medium (petroleum ether). T h e hydrophylic n a t u r e of t h e cis isomer is indicated by its greater water a n d alcohol solubility.
Isomeric molecules containing t h e same n u m b e r a n d kinds of func- tional groups are adsorbed on polar solids roughly proportionally t o t h e magnitude of t h e dipole m o m e n t of t h e structure (1). For example, nitrophenols or nitroanilines are adsorbed in t h e order para-meta-ortho, in agreement with change in dipole m o m e n t . However, this a r g u m e n t cannot be extended to a comparison of compounds having a differing number of functional groups. Picric acid is more strongly adsorbed on
A I 2 O 3 t h a n nitrophenol even though t h e latter has t h e larger dipole.
The strength of adsorption m a y v a r y from practically irreversible adsorption through reversible adsorption t o no adsorption. I n t h e case of irreversible adsorption, elution with solvent will not lead t o m o v e m e n t along t h e column and can only be overcome b y choice of different adsorb- ents or a more active solvent.
T h e n a t u r e of t h e solvent or eluant is of very great importance in successfully carrying out a chromatographic analysis (4). T h e com- petition between solvent a n d solute for t h e various adsorption points on the solid adsorbent and t h e dependence of distribution coefficients between immiscible solvents determine the effectiveness of separation t o a considerable extent. For hydrophylic adsorbents t h e order of solvents in the direction of increasing eluting power is: Petroleum ether (saturated hydrocarbons) —benzene— chlor of orm—di ethyl ether—ethylacetate—ace- tone—propyl alcohol—ethyl alcohol—methyl alcohol—water—pyridene.
This order which runs parallel to t h e dielectric constant of t h e liquids a n d their heats of wetting, has been determined for the adsorption or elution of one solute. I n the case of multiple solute separation, however, inver- sions in t h e adsorption sequence are often observed. Comparatively small changes in t h e properties of the solvent give rise to different adsorption sequences on similar columns. This points u p the importance of effect of mixed solutes on the adsorption isotherm of each component.
Proof of purity of a substance as determined by behavior on chroma- tographic columns m u s t as a consequence be determined by adsorption on a variety of adsorbents a n d from a n u m b e r of solvents. T h e reversing of position is of a d v a n t a g e in frontal analysis where only t h e first com- ponent appears pure in t h e eluate or in elution c h r o m a t o g r a p h y in which the b a n d s are not completely separable. I n either case t h e least adsorbed component will be separated in high state of purity from t h e other components.
Structural effects and overall shapes are of great importance in t h e
C H R O M A T O G R A P H I C A N A L Y S I S 6 0 7
field of long-chain polyene hydrocarbons ( 6 0 ) . Isomerization can be induced in carotenes whereby t h e all-trans configuration is converted into mixtures of stereoisomers containing mono-cis a n d di-cis configurations.
T h e location of t h e cis linkage is i m p o r t a n t with regard to t h e adsorption sequence. If centrally located, so t h a t t h e entire carotene structure assumes a bent configuration, t h e strength of adsorption decreases remarkably. Cis-linkages near t h e end of t h e molecule adsorb above t h e all t r a n s configuration. Poly-cis configurations lead generally t o sub
stantial weakening in adsorptive strength.
4 . A P P A R A T U S ( 5 0 )
T h e a p p a r a t u s necessary in chromatographic analysis is very simple, consisting of circular or straight sided tubes in which t h e adsorbent is maintained. Following a suggestion of Claesson, t h e volume of t h e t u b e is conveniently expressed in multiples of π (pi). Straight sided t u b e s are used when the position of adsorbed b a n d s is to be observed b y t h e technique of t o t a l reflection. W h e n ultraviolet light is used for observa
tion of b a n d position, t h e t u b e material should be quartz.
I t is essential in t h e preparation of columns to introduce the adsorbent as uniformly as possible t o avoid cracks a n d inclusion of air pockets.
Support for t h e adsorbent can be either a dense fritted glass support or a perforated porcelain plate. T h e chosen solvent is introduced a n d t h e adsorbent added in a fine s t r e a m a n d allowed t o settle with repeated tapping. Excess solvent is r u n off b y opening t h e stopcock (greaseless) in case of the porcelain plate assembly or b y applying pressure on t h e fritted glass column until t h e adsorbent is barely covered with solvent.
T h e excess is reintroduced a t t h e t o p a n d allowed t o r u n through several more times until t h e adsorbent is thoroughly settled. An accurately cut piece of filter paper a n d some cotton are added to the top of the adsorbent to prevent disturbance on subsequent use a n d excess solvent is removed to t h e point where t h e t o p of t h e adsorbent remains covered with liquid.
U n d e r no circumstance should t h e column be allowed t o d r y out since cracks are bound to develop. Therefore, when t h e column is not being- used a tight stopper m u s t be employed t o prevent solvent evaporation.
T o obtain a d e q u a t e flow rates it is preferable to apply positive pressure r a t h e r t h a n suction.
5 . A D S O R B E N T S
I n view of t h e pronounced effect of adsorbent structure on t h e shape of t h e adsorption isotherm, a d e q u a t e q u a n t i t a t i v e information of t h e structure of t h e substance is desirable. Activities m a y v a r y widely d u e t o variation of surface structure a n d chemical composition. Reproduci-
608 WALTER G. BERL
ble results can be obtained only b y strictest maintenance of uniformity of t h e adsorbent. As in preparation of catalysts, t h e manipulations during manufacture of t h e adsorbent m u s t be closely controlled.
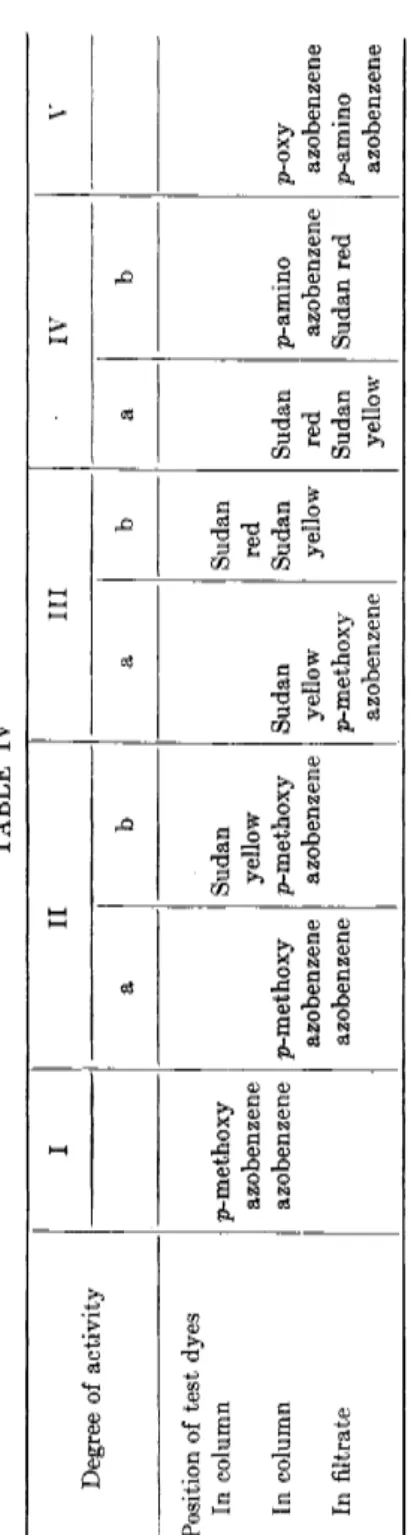
I t is found convenient t o establish a relative scale of activity of adsorbents. Highly active aluminum oxide preparations can be deac- tivated stepwise b y controlled addition of water or exposure t o water vapor (37). This results in a preferred adsorption of water on t h e adsorbent surface having m a x i m u m degree of u n s a t u r a t i o n adsorption strength. B y employing test solutions consisting of a group of azo dyes with different functional groups, t h e degree of activity can be established rapidly b y observing t h e behavior of different adsorbents under condi- tions of uniform adsorption a n d elution. This test gives no indication of the rate of zone m o v e m e n t which is determined b y t h e n u m b e r of active adsorption sites per unit volume of adsorbent, b u t gives a valuable clue concerning t h e strength of bond established between solute and adsorbent.
Test solutions are m a d e u p of a series of azo dyes with similar skeleton
T h e experimental procedure consists in standardized adsorption a n d elution experiments with pairs of t h e azo dyes. T h e activity of t h e adsorbent is measured b y t h e extent to which test pairs are adsorbed and eluted from t h e column. Table IV shows t h e empirical separation of aluminum oxides with 5 degrees of activity. Other adsorbents, like silica gel, magnesium oxide, calcium sulfate, can be ranked in comparison t o alumina on a similar scale b y making use of t h e same test substances (4).
Adsorption activity decreases in t h e order of oxides, sulfate, carbonate, oxalate. As pointed out, however, t h e order of adsorption is not only a function of t h e adsorbent structures b u t of t h e solvent medium. P a r - ticularly for solutes differing only slightly in adsorption inversion in order m a y occur.
H e a t of wetting (38, 39) supplies q u a n t i t a t i v e d a t a of surface charac- ter while t h e adsorption of azo dyes will provide relative rates of b a n d
a n d different substituents (3). I n this series the adsorption sequence is as follows:
p-hydroxyazobenzene p-aminoazobenzene Sudan red
S u d a n yellow p-methoxyazobenzene azobenzene
TABLE IV Degree of activity I II III IV V Degree of activity a b a b a b Position of test dyes In column In column In filtrate
p-methoxy azobenzene azobenzene p-methoxy azobenzene azobenzene Sudan yellow p-methoxy azobenzene Sudan yellow p-methoxy azobenzene Sudan red Sudan yellow Sudan red Sudan yellow
p-amino azobenzene Sudan red p-oxy azobenzene p-amino azobenzene
CHROMATOGRAPHIC ANALYSIS 609
610
motion. H e a t of wetting m a y be determined directly calorimetrically or from t h e t e m p e r a t u r e dependance of adsorption isotherms. T h e t e m p e r a t u r e effect is a function of t h e heat of wetting of t h e surface a n d heat of adsorption of t h e solvent. T h e latter q u a n t i t y is strikingly influenced b y t h e presence of small a m o u n t s of polar impurities.
Measurements of this kind, are not sufficient to specify t h e adsorption behavior of non-homogeneous mixtures of adsorbents, where, for example, extremely active particles are diluted with completely non-active m a t e rial. However, in t h e preparation of graded alumina specimen t h e calorimeter procedure is very adequate to indicate t h e degree of deactiva
tion b y water or other polar solvent.
An i m p o r t a n t technique of characterization of adsorbents is t h e measurement of actual rates of m o v e m e n t of b a n d s along a column (28, 29). Under steady flow conditions an adsorbent can be specified b y three t e r m s : S = length of column containing one unit volume of sol
v e n t / l e n g t h of unfilled t u b e required to contain same volume of solvent;
Vc = rate of flow of the developing solvent through the column ( m m / m i n ) ; Rf = rate of m o v e m e n t of adsorbate zone ( m m / m i n ) / r a t e of flow of t h e solvent (Vc). Tc = time in seconds required for a solvent to penetrate 50 m m into an initially d r y 9 X 75 m m column. S expresses a packing t e r m of t h e column (% of t u b e occupied b y adsorbent = 100(£ — l)/S) a n d is a function of the technique with which columns are prepared, as well as particle size a n d shape. Vc is a function of pressure drop through t h e column and driving force and can be calculated from Darcey's Law.
Vc - k(A/700a) P/yL
where k is permeability in Darceys, y is t h e viscosity in centipoise, a is t h e interstitial volume of t h e column, L is length of column in centimeters and A the cross section in square centimeters. Κ A/760a is most con
veniently measured by determining Vc for one set of conditions for a s t a n d a r d set of packing.
T h e values of Vc, Tb0, and R t h a t are found generally useful are Ve = 10 - 50 m m / m i n , T^o = 20 t o 100 sec; R = 0.10 t o 0.30.
All methods discussed are to be considered guides in t h e selection of adsorbents, permitting general reproducibility of results when different specimen of adsorbents are to be used.
I t has been shown b y Dickey t h a t the activity of an adsorbent can be decidedly influenced in favor of high specificity by its preparation in the presence of t h e substance t o be adsorbed (15). Experiments on silica gel precipitated in t h e presence of methyl orange and its derivatives indicated t h a t t h e structure of t h e silica gel was sufficiently modified by
CHROMATOGRAPHIC ANALYSIS 611 the presence of t h e dye t o yield noticeably increased adsorption. This property proved t o be very specific as shown in T a b l e V.
TABLE V
Adsorptive power for
Methyl orange Ethyl orange Propyl orange Butyl orange
Control gel 84 80 240 320
Specific adsorbent 300 740 5000 5000 6. I D E N T I F I C A T I O N O F S O L U T E S
T h e identification of adsorption zones can be carried out in t h e following m a n n e r :
1) Direct visual inspection
2) Fluorescence in ultraviolet light (27)
3) Color change in stationary indicator (45, 46)
4) M a r k i n g of colorless substances with indicators (radioactive) (6) 5) Fluorescence quenching of adsorbent (4, 49)
6) Optical techniques in t h e effluent a. Refractive index (9)
b . Interferometer (9)
c. T h e r m a l conductivity (9, 44)
7) Coupling t o form colored derivatives (47) 8) Optical t o t a l reflection (11)
If t h e components of interest are colored no identification problem exists. Similarly if t h e adsorbed substances fluoresce in ultraviolet light, identification of zone position can be accomplished in a light tight box with suitable ultraviolet light sources. This technique was first used b y K a r r e r a n d Schopp (27).
T h e use of indicators present in t h e column prior to adsorption of t h e unknown belongs more properly into t h e field of partition chromato- graphy where the indicator is p a r t of the stationary aqueous phase.
Thus, t h e aliphatic acids (Ci-Cio) h a v e been separated on silica gel columns using a stationary phase t o which bromocresol green h a s been added (45, 46).
T h e use of indicators having t h e same adsorption isotherms as t h e compound under investigation applies almost entirely to t h e use of isotopes t h a t can be detected b y characteristic radiations. Location of zones in columns is not convenient. However, absence or appearance of a compound in effluent can be conveniently measured. I n cases where
612
purification is desired, t h e addition of a radioactive substance in dilution sufficient for identification is an extremely delicate tool. Removal of undesirable ions b y an exchange column can be followed with ease. Like- wise, estimates of t h e probable contamination of the eluate are m a d e possible. Auto-radiographic techniques, wherein t h e emitted radiation is used to expose a photographic plate is of very considerable value in paper chromatography which lends itself exceedingly well to t h e m o u n t i n g of plate and development paper. This m e t h o d is of greatest value in determining rapid physiological processes in living organisms by per- mitting insight in the fate of particular radioactive substances under controlled experimental conditions (6).
The conversion of colorless compounds into colored derivatives is a measure t h a t should be of use in those cases where none of the other methods for detection of colorless compounds are applicable. T h e p-phenyl azobenzoyl esters of mono-, di-, a n d trisaccharides on silica a n d magnesol columns, 2, 4, dinitrophenyl hydrazones of aldehydes a n d ketones a n d azobenzoic acid derivatives of amino acids are typical examples of colored derivatives.
If the adsorbent is m a d e fluorescent by adsorption of a fluorescing dye or washing with fluorescing pigment, the presence of strongly adsorbed bands will usually produce a weakened fluorescence emission a t t h e point of fixation. This is due t o a blanketing effect of t h e adsorbed substances which will adsorb a fraction of t h e incident ultraviolet light making it unavailable for reemission. T h e p a r t of t h e column containing t h e adsorbed substance appears as dark b a n d . Another mode of action is t h a t t h e adsorbed substance quenches t h e fluorescence of t h e adsorbed dye (4, 4 9 ) .
Fluorescence can be produced in t h e following w a y s : T h e adsorbent is prepared according to the techniques of luminous phosphors by incor- porating in it a small a m o u n t of a metallic activator. For t h e more common adsorbents this has been accomplished for aluminum oxide where the addition of thallium produces a light yellow fluorescence. A more adequate technique is to add a fluorescent dye which will not react with the solute and not be eluted by t h e solvents used in subsequent analyses or to mix mechanically a fluorescent solid which by itself has no adsorptive capacity. Morin on aluminum oxide, calcium carbonate a n d magnesium oxide gives yellow fluorescence, diphenyl fluorindin sulfonic acid red fluorescence. Berberine is satisfactory on silica gel. For maxi- m u m sensitivity t h e spectral range of the lamp should m a t c h the adsorp- tion maxima of t h e compound being adsorbed.
Characteristic color reactions can be carried out in order to locate t h e position of the b a n d s after colorless substances have been separated and
C H R O M A T O G R A P H I C A N A L Y S I S 613 t h e column is removed from its glass envelope. I n t h e identification of sugars a thin line of p e r m a n g a n a t e d r a w n along t h e column will indicate t h e position of oxidizable b a n d s . T h e m e t h o d suffers from t h e difficulty of not permitting observation of separation during elution a n d of requiring removal of adsorbent from t h e column (30, 31).
If t h e analysis is carried out by frontal or displacement analysis, t h e identification of the appearance of b a n d s in t h e eluate can be carried out by a n y physical m e t h o d which is sufficiently sensitive a n d specific. T h e eluate can be measured continuously for changes in refractive index, density, electrical conductivity, light adsorption, a n d in t h e cases of gases by thermal conductivity determinations. I n order to correlate t h e physical constants with t h e volume of liquid t h a t has passed t h r o u g h t h e adsorption column it is advisable t o m a k e t h e measuring cell as small as possible. A weighing device allows the determination t o become entirely automatic.
An undesirable interference in chromatographic analysis is t h e possi- bility of irreversible reactions taking place on t h e adsorbent. On t h e other h a n d reversible changes in configurations are possible in which t h e adsorbed substance undergoes a structural change which reverts t o t h e original state u p o n elution.
Triarylmethyl halides in benzene solution are colorless. T h e y are known to form colored double salts with ZnCl2, A1C13, etc. similar in structure to t h e heteropolar colored triarylmethyl nitrates, perchlorates, etc. If t h e colorless halides are brought in contact with well dried silica gel or alumina similar color formation is obtained. Elution with solvents containing small a m o u n t s of alcohol, acetone or water restores t h e aryl derivatives to its colorless form. T h u s , t h e bond with the adsorbent acts similarly as t h e complex formation with inorganic halides. T h e behavior is common to a large n u m b e r of similar classes, as for example, unsubsti- t u t e d a n d substituted triphenyl carbinols, as well as a large family of dyes containing chromophoric groups ( C = 0 , = N R , — C = N ,
like — N R2, — O R , —SR. Their color is strongly dependent on t h e n a t u r e (dielectric constant) of t h e solvent. Adsorption on silica gel or alumina generally leads t o deepening of color in t h e same sense as is due to the presence of a polar solvent (alcohol). Elution with alcohol or acetone eliminates t h e color on t h e column (54, 55, 56).
7. R E A C T I O N S W I T H A D S O R B E N T S
conjugation t o auxochrome groups,
T h e effect of t h e adsorbent is not confined t o organic molecules only.
Colored pseudo salts, composed of colorless ions, are decolorized b y adsorp
tion. Mercuric iodide vapor, intensely yellow above 120°, forms a color
less addition complex on silica gel, which on addition of w a t e r is converted back t o t h e colored form. T h a t very considerable polarization forces exist is demonstrated by the observation t h a t when adsorbent and the polarisable substance are crushed together dry, the typical adsorp
tion colors are developed. For example, the green p-nitroso dimethyl N = 0
aniline,
N O H
I
N H2
forms a yellow brown quinonoid hydrochloride,
An aqueous solution has a similar yellow brown color, due to
N H2C 1
N O -
formation of the ion A similar yellow color is formed if the green N H2+
benzene solution is adsorbed on alumina or silica gel. Addition of water or alcohol regenerates t h e green color in solution.
In contrast to t h e simple pseudo salt color changes, t h e color assumed by the types of compounds consisting of chromophores and auxochromes can assume a n u m b e r of forms depending on t h e particular resonance structures t h a t are most stable. T h u s t e t r a m e t h y l diamino fuchsone, C = 0 , is orange in benzene, red in alcohol, olive green
R2N -
y
on silica gel, brown on air dried alumina, violet on well dried alumina.
Similar results are obtained on various adsorbing clays (7). Sudan red B, from diazotized o-amino azotoluol and β naphthol, gives red solu
tion in absence of acids, changing to green in presence of concentrated sulfuric acid. On alumina, calcium carbonate a n d air dried n a t u r a l clays t h e dye is adsorbed moderately strongly from benzene. However, acid treated bleaching earths (frankonite, floridine), bind it strongly with
C H R O M A T O G R A P H I C A N A L Y S I S 615 green color. T h a t this is n o t due t o presence of u n b o u n d mineral acid is shown b y t h e fact t h a t water, which does n p t elute t h e d y e from adsorbents due t o its lack of solubility therein, does n o t affect t h e color complex. T h e color tint depends on t h e water content of t h e clay, t h e rate of salt formation increasing with decrease in non-chemically b o u n d water.
Irreversible changes h a v e been observed particularly on adsorbents of high activity (48). Polymerization, isomerization, ring closure, splitting off of water are possible reactions. Floridine, h e a t e d t o 3 2 5 ° C , poly- merizes all ethylene derivatives of t h e constitution R ( R/) C = C H2 a n d R ( R ' ) C = C H R/ / a t room t e m p e r a t u r e . Singly or symmetrically substi- t u t e d ethylenes are not polymerized. Similarly d e h y d r a t e d frankonite initiates vigorous reaction with ring systems containing u n s a t u r a t e d b a n d s (limonene, pinene) (7). Weakly adsorbed solvents do not prevent this reaction, in t h e presence of methanol or acetone t h e polymerization is entirely suppressed.
Easily deesterified esters are hydrolyzed on alumina (5). However, carotene isomerizations suspected t o be due t o t h e action of alumina columns were shown to be due t o spontaneous reactions on standing, t h e column merely resolving t h e mixture into its components (58, 59).
There is no d o u b t t h a t very sensitive substances m a y undergo irrevers- ible changes on active adsorbents. I t is possible in nearly all cases t o overcome this difficulty b y proper choice of adsorbent or solute so t h a t t h e chemical activity of t h e adsorbent is reduced t o negligible contribution.
8. R E S O L U T I O N O F O P T I C A L I S O M E R S
For t h e separation of t h e two forms of a racemic mixture b y chroma- tographic analysis two techniques h a v e been employed. B y forming the diastereo isomerides b y combination with pure dextro or levo compound selective adsorption on non-active adsorbents will t a k e place, due t o t h e different adsorption isotherms of t h e diastereo isomerides (26). Jamison and T u r n e r were able to partially separate- dZ-mandelic acid through their m e n t h y l esters on alumina columns from petroleum ether. M u c h poorer separations are reported on calcium sulfate, dextrose and magnesium oxide from benzene (22).
Complete separation of a dl mixture on a n optically active adsorbent has been accomplished with p-phenylene bisimino camphor on columns of lactose from petroleum ether-benzene (4:1) (23, 24). T h e separation was carried out b y multiple elution of partially separated mixtures.
T h e d-amino camphor is t h e more strongly adsorbed isomer on D-lactose.
Prolonged contact with lactose or t h e use of a highly purified sugar adsorbent leads to compound formation, probably t h e p-phenylene bisimino derivative.
![When members of the family examined are subsets of [n] :={1,2](data:image/gif;base64,R0lGODlhAQABAIAAAP///wAAACH5BAEAAAAALAAAAAABAAEAAAICRAEAOw==)