Cross-site analysis of perceived ecosystem service benefits in
1
multifunctional landscapes
2
Published in Global Environmental Change 56 (2019) 134–147 3
https://doi.org/10.1016/j.gloenvcha.2019.04.002 4
Received 21 February 2018; Received in revised form 10 April 2019; Accepted 14 April 2019 5
6
Nora Fagerholma,b,* ncfage@utu.fi, Mario Torralbac, Gerardo Morenod, Marco Girardelloe, Felix 7
Herzogf, Stephanie Avirong, Paul Burgessh, Josep Crous-Durani, Nuria Ferreiro-Domínguezj, Anil 8
Gravesh, Tibor Hartelk, Vlad Măcicăsanl, Sonja Kayf, Anastasia Panteram, Anna Vargan, Tobias 9
Plieningerc,o 10
11
aDepartment of Geosciences and Natural Resource Management, University of Copenhagen, 1958 12
Frederiksberg C, Denmark 13
bDepartment of Geography and Geology, University of Turku, 20014 Turku, Finland 14
cFaculty of Organic Agricultural Sciences, University of Kassel, Steinstr. 19, 37213 Witzenhausen, 15
Germany 16
dINDEHESA, Forestry School, University of Extremadura, Plasencia 10600, Spain 17
ecE3c – Centre for Ecology, Evolution and Environmental Changes/Azorean Biodiversity Group 18
and University of the Azores, Açores, Portugal 19
fAgricultural Landscapes and Biodiversity Research Group, Agroscope, 8046 Zurich, Switzerland 20
gUMR BAGAP, INRA Agrocampus ESA, 35042 Rennes cedex, France 21
hSchool of Water, Energy and Environment, Cranfield University, Cranfield, Bedfordshire, MK43 22
0AL, UK 23
iForest Research Centre, School of Agriculture, University of Lisbon, 1349-017 Lisbon, Portugal 24
jDepartment of Crop Production and Engineering Projects, High Polytechnic School, University of 25
Santiago de Compostela, 27002-Lugo, Spain 26
kDepartment of Biology and Ecology in Hungarian and Center of Systems Biology, Biodiversity and 27
Bioresources (Center of ’3B’), Babes-Bolyai University, Str. Clinicilor 5–7, Cluj-Napoca, Romania 28
lFaculty of Environmental Sciences and Engineering, Babes-Bolyai University, 400294, Cluj- 29
Napoca, Romania 30
mAgricultural University of Athens, 36100 Karpenissi, Greece 31
nMTA Centre for Ecological Research, 2163, Vácrátót, Hungary 32
oDepartment of Agricultural Economics and Rural Development, University of Göttingen, Platz der 33
Göttinger Sieben 5, 37073 Göttingen, Germany 34
35
*Corresponding author at: Department of Geosciences and Natural Resource Management, 36
University of Copenhagen, 1958 Frederiksberg C, Denmark.
37 38
Declarations of interest:none 39
Acknowledgements 40
The authors acknowledge funding from the European Community’s Seventh Framework 41
Programme under Grant Agreement No.613520 (project AGFORWARD). We would like to thank 42
the residents in all the study areas for participating in the survey. We also acknowledge the 43
contribution of M. Azevedo Coutinho, I. Balsa da Silva, J. Bódis, V. Caudon, A. Dind, F. Franchella, 44
P. Francon-Smith, E. Galanou, S. García-de-Jalón, J.M. Giralt Rueda, M. Horváth, Q. Louviot, K.
45
Mantzanas, J. Palma, G. Petrucco, A. Sidiropoulou and A. Teixeira to the survey data collection.
46
This research contributes to the Programme on Ecosystem Change and Society (www.pecs- 47
science.org).
48 49
Abstract 50
Rural development policies in many Organization for Economic Co-operation and Development 51
(OECD) member countries promote sustainable landscape management with the intention of 52
providing multiple ecosystem services (ES). Yet, it remains unclear which ES benefits are 53
perceived in different landscapes and by different people. We present an assessment of ES 54
benefits perceived and mapped by residents (n=2,301) across 13 multifunctional (deep rural to 55
peri-urban) landscapes in Europe. We identify the most intensively perceived ES benefits, their 56
spatial patterns, and the respondent and landscape characteristics that determine ES benefit 57
perception. We find outdoor recreation, aesthetic values and social interactions are the key ES 58
benefits at local scales. Settlement areas are ES benefit hotspots but many benefits are also 59
related to forests, waters and mosaic landscapes. We find some ES benefits (e.g. culture and 60
heritage values) are spatially clustered, while many others (e.g. aesthetic values) are dispersed.
61
ES benefit perception is linked to people’s relationship with and accessibility to a landscape. Our 62
study discusses how a local perspective can contribute to the development of contextualized and 63
socially acceptable policies for sustainable ES management. We also address conceptual 64
confusion in ES framework and present argumentation regarding the links from services to 65
benefits, and from benefits to different types of values.
66
Keywords 67
Cultural ecosystem services; landscape management; landscape values; landscape 68
characteristics; PPGIS; Europe 69
70
1. Introduction 71
People perceive a variety of benefits in their everyday landscapes in which they live, work, engage 72
in recreational activities, encounter other people and search for relaxing and restorative 73
experiences (Stephenson, 2008). These perceptions are place-specific (Williams, 2014) and can 74
be defined as the benefits that people derive from the structures and processes generated by 75
nature, i.e. ecosystem services (ES) (Millennium Ecosystem Assessement, 2005). Recently, there 76
has been an increased effort to map ES benefits as perceived by people (Scholte et al., 2015). The 77
existing empirical evidence is, however, typically limited to studies that address specific socio- 78
economic and landscape contexts. Such studies are unlikely to illustrate ES benefits across wider 79
societies and regions. An approach that moves beyond single case studies is necessary to 80
understand the role of common global drivers of landscape change, such as urbanization, 81
agricultural intensification, land abandonment, and landscape simplification in shaping the ways in 82
which people appreciate landscapes (Levers et al., 2015). Increasingly, these drivers of change 83
have raised concerns since they may be linked to a diminishing capacity of the landscape to 84
provide ES, thus compromising human well-being (Wu, 2013).
85
Participatory mapping is a powerful tool for grasping the socio-cultural realities of communities, 86
regions, landscapes, and ecosystems. This method, which often combines surveys with a mapping 87
component, has successfully engaged stakeholders in identifying and mapping a range of ES (e.g.
88
a review of empirical studies by Brown and Fagerholm, 2015; Garcia-Martin et al., 2017; Ridding et 89
al., 2018; Samuelsson et al., 2018). Based on Public Participation Geographical Information 90
Systems (PPGIS) and other participatory methods, such approaches highlight ecosystem benefits 91
to people (Termorshuizen and Opdam, 2009) and the spatial heterogeneity of ES benefits. The 92
relevance of such local knowledge has been particularly emphasized by the Intergovernmental 93
Science-Policy Platform on Biodiversity and Ecosystem Services (IPBES) (Turnhout, 2012).
94
Conceptually, participatory mapping of ES benefits communicates assigned values, i.e. the 95
judgement regarding the appreciation of objects such as places, ecosystems and species 96
(Nahuelhual et al., 2016; Seymour et al., 2010; Van Riper and Kyle, 2014). It focuses on the 97
personal perception, which is typically place-based, that emerges from everyday embodied 98
experience and accumulated knowledge (Stephenson, 2008; Williams and Patterson, 1996), 99
having roots in human geography and post-phenomenological discussions (Brown and Raymond, 100
2007; Hausmann et al., 2016). It is also valuable for understanding broad public benefits of ES and 101
generating insights beyond proxy-based studies that often only address single ES (e.g. Raudsepp- 102
Hearne et al., 2010; Weyland and Laterra, 2014). Globally, PPGIS approaches have been applied 103
for socio-cultural ES assessment and mapping in a variety of contexts such as national forests and 104
parks (Crossman et al., 2013; Sherrouse et al., 2014), agricultural landscapes (Fagerholm et al., 105
2016, 2012; Plieninger et al., 2013) and conservation lands (Brown and Brabyn, 2012; Hausner et 106
al., 2015).
107
Multifunctional landscapes in Europe make an interesting case study for the assessment of ES 108
benefits. Landscape multifunctionality as a normative concept recognizes that rural landscapes 109
have multiple functions beyond agricultural and forest-based commodity production. Accordingly, 110
multifunctional landscapes generate a diverse set of ES that are accessible to a broad range of 111
beneficiaries (Fischer et al., 2017). The concept underpins many agricultural support and rural 112
development policies of the OECD member countries and also the Common Agricultural Policy 113
(CAP) of the EU (OECD, 2001; Renting et al., 2009). Several studies have examined the multiple 114
benefits that people derive from ecosystems in multifunctional landscapes. However, these have 115
either used multiple indicators at local scales (Oteros-Rozas et al., 2018) or a single, coarse 116
indicator at continental scales (van Zanten et al., 2016). An empirical analysis across several 117
landscapes can improve understanding of the linkages between multiple ES benefits as 118
subjectively perceived by different actors, with different socio-demographic characteristics and 119
backgrounds, and multifunctional land use systems, where landscapes and their components have 120
multiple uses and purposes (Sayer et al., 2013; Scholte et al., 2015; Small et al., 2017).
121
Understanding the spatially explicit patterns of ES benefits is crucial for integrated ES 122
assessments and for the development of effective land development policies in the coming 123
decades (Crossman et al., 2013; Maes et al., 2012).
124
The aim of this paper is to analyze ES benefits as perceived by local communities across 125
European multifunctional landscapes. Across 13 study areas in ten countries 2,301 local residents 126
responded to a web-based mapping survey and located (as mapped point locations) subjectively 127
perceived ES benefits in their everyday landscape. The study areas comprise multifunctional 128
farming landscapes in Europe, representing a broad range of land-use systems and varying 129
degrees of rurality and peri-urbanity as well as different levels of landscape protection (Fig. 1 panel 130
a, Supplementary Table A.1). Based on the conceptual framework presented by Scholte et al.
131
(2015), we explore both the role of the characteristics of the survey respondents as well as the 132
characteristics of the landscape as determinants of ES benefit perception (Fig. 2). Our research 133
questions are:
134
1) Do identified ES benefits vary across 13 European sites and are they spatially clustered into 135
landscape-level hotspots?
136
2) Is the type of perceived ES benefits influenced by the respondents’ socio-demographic 137
characteristics and their relationship to the landscape?
138
3) Is the type and intensity of the ES benefits influenced by landscape characteristics such as 139
land cover, accessibility, and the presence of conservation areas?
140
2. Material and methods 141
2.1 Study areas 142
This study was conducted at 13 different study areas in ten European countries: Montaña Oriental 143
Lucense, Spain (SP-MO), Canton de Loudeac, France (FR-CL), the Brecks, United Kingdom (UK- 144
BR), Linköping, Sweden (SE-LI), Franches Montagnes, Switzerland (CH-FM), Schwarzbubenland, 145
Switzerland (CH-SB), Hochkirch-Weißenberg, Germany (DE-HW), Saxon region, Romania (RO- 146
SA), Llanos de Trujillo, Spain (SP-LT), Serena Campiña, Spain (SP-SC), Kassandra, Greece (GR- 147
KA), Montemor-o-Novo, Portugal (PT-MN), and Zala, Hungary (HU-ZA) (Fig. 1). The study areas 148
were identified as landscapes that most residents identify with and/or depend on for their lifestyles 149
and livelihoods based on knowledge of local members of the research team (Brown et al., 2015b).
150
They represent the major types of multifunctional landscapes in Europe and spread across a large 151
gradient of land-use and biogeographic conditions (Kay et al., 2017) and degrees of rurality 152
(Supplementary Table A.1). Following the FARO typology of rurality (van Eupen et al., 2012), our 153
study areas cover situations from “deep rural” (e.g. SP-MO) to “peri-urban” (e.g. CH-SB) and 154
represent a gradient of economic density and accessibility (the key parameters describing the 155
degree of rurality). Conservation areas account for between 0.4% and 84.0% of each study area.
156
Each study area was located within a larger rural area with similar land-uses and socio-economic 157
characteristics. Our approach resembles other cross-site studies (e.g. Billeter et al., 2008; Kleijn et 158
al., 2006; Schneider et al., 2014).
159
160
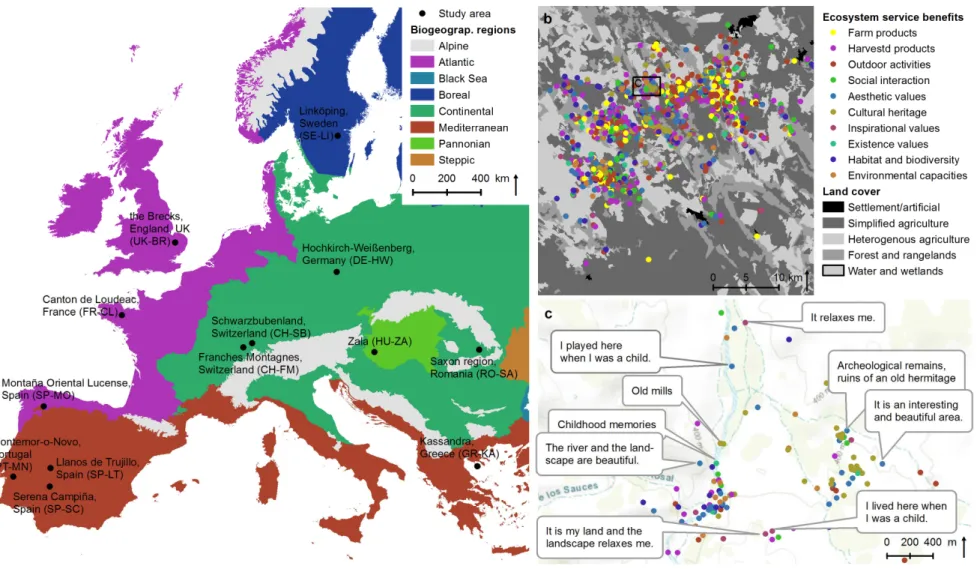
Figure 1. Study areas and example of mapped ES benefits. Panel a shows location of the 13 study areas within five biogeographic 161
regions of Europe. Panel b illustrates the spatial distribution of ES benefits in Serena Campiña, Spain (SP-SC). Panel c visualizes 162
descriptive attributes given to mapped places.
163
164
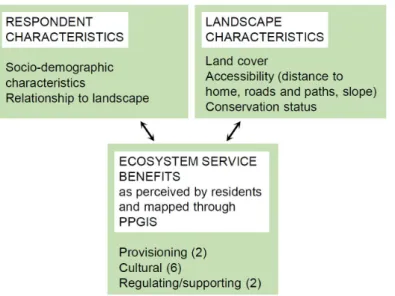
Figure 2. Study design. Framework for analyzing the role of survey respondents’ characteristics 165
and landscape characteristics as determinants of ES benefits.
166
2.2 Typology for mapping ES benefits 167
In our socio-cultural ES assessment, we recognise the links from services to benefits, and from 168
benefits to values (cf. Chan et al., 2012; Haines-Young and Potschin, 2010). We mapped 169
perceived ES benefits (cf. Van Riper et al., 2017) in multifunctional landscapes with local residents 170
and connected these benefits to different ES (Table 1). Based on existing ES frameworks and 171
empirical studies applying participatory approaches (Brown and Reed, 2000; Millennium 172
Ecosystem Assessement, 2005; Raymond et al., 2009; Roy Haines-Young and Potschin, 2013;
173
Vallés-Planells et al., 2014), we developed a typology of ES benefits that aims to capture both the 174
material and symbolic/intrinsic benefits of ES in relation to local actors’ everyday landscape and 175
covers provisioning, cultural, regulating/supporting services and biodiversity. ES benefits were 176
mapped through operationalized statements (Table 1) and include, for example, places where a 177
person practices various outdoor activities, harvests wild products from nature, spends time 178
together with other people or appreciates aesthetic landscapes, culture and heritage or plants, 179
animals and ecosystems. Respondents were always asked about their personal perceptions, not 180
about the general perceptions about a specific ES benefit. This way, when a respondent mapped a 181
place, for example, as a source of inspiration or as a place to practice outdoor activities, he/she 182
referred to his/her personal view. The typology was tested in the ES-LT study area (Fagerholm et 183
al., 2016), where the chosen ES benefits were meaningful for residents and applicable and 184
practical for participatory research.
185
The typology particularly addresses both the subjective perceptions and uses of the landscape 186
(Scholte et al., 2015). It also connects to the on-going discussion on benefit-relevant indicators of 187
“what is valued” by particular beneficiaries (Olander et al., 2018). As we understand that these 188
benefits are provided by perceptions that emerge from the interaction with the landscape (Setten et 189
al., 2012) and from the relationships among the people and between people and the landscape 190
(Pascual et al., 2017), we followed the common approach in PPGIS studies where mapped ES 191
benefits stress the subjective values and activities of respondents in the landscape which are often 192
linked to the cultural ES category (Brown and Fagerholm, 2015). In fact, socio-cultural approaches 193
to ES mapping commonly target landscape level and landscape perceptions (e.g. Brown and 194
Raymond, 2014; Casado-Arzuaga et al., 2013; García-Nieto et al., 2015).
195
Similarly as Nahuelhual et al. (2016) and Van Riper and Kyle (2014), our typology of ES benefits 196
targets a subset of individual anthropocentric self-regarding values, particularly values assigned by 197
a person to the landscape (assigned values) leaving out possible other types of values discussed, 198
for example, by Chan et al. (2012) and Kenter et al. (2015). These anthropocentric values are both 199
instrumental (e.g. the ES benefits related to farm and harvested products) and relational (e.g. the 200
ES benefits related to social interaction and inspiration) but cannot always be placed to one 201
category only (e.g. ES benefit related to harvesting practised both for subsistence, recreation and 202
inspiration) (cf. Pascual et al., 2017). An exception to the anthropocentric values is the inclusion of 203
existence values (appreciation of a place just for its existence regardless of benefits for humans), 204
which is an “other-regarding value” (Kenter et al., 2015) and, similarly as in Raymond et al. (2009), 205
we decided to include it as an intangible ES benefit with potentially interesting place-based 206
character.
207
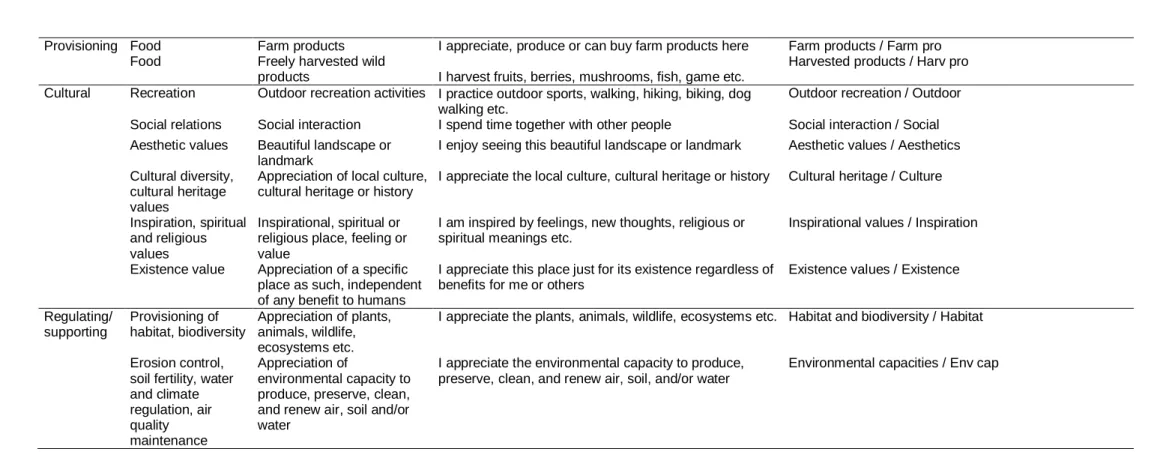
Table 1. ES typology and respective operational definitions (related survey question: Do you find some particular place or area special in 208
this landscape?) applied in the mapping exercise.
209
ES category
ES ES benefit Operational definition ES benefit acronym in figures and tables
Provisioning Food Farm products I appreciate, produce or can buy farm products here Farm products / Farm pro
Food Freely harvested wild
products I harvest fruits, berries, mushrooms, fish, game etc.
Harvested products / Harv pro Cultural Recreation Outdoor recreation activities I practice outdoor sports, walking, hiking, biking, dog
walking etc.
Outdoor recreation / Outdoor Social relations Social interaction I spend time together with other people Social interaction / Social Aesthetic values Beautiful landscape or
landmark
I enjoy seeing this beautiful landscape or landmark Aesthetic values / Aesthetics Cultural diversity,
cultural heritage values
Appreciation of local culture, cultural heritage or history
I appreciate the local culture, cultural heritage or history Cultural heritage / Culture
Inspiration, spiritual and religious values
Inspirational, spiritual or religious place, feeling or value
I am inspired by feelings, new thoughts, religious or spiritual meanings etc.
Inspirational values / Inspiration
Existence value Appreciation of a specific place as such, independent of any benefit to humans
I appreciate this place just for its existence regardless of benefits for me or others
Existence values / Existence
Regulating/
supporting
Provisioning of habitat, biodiversity
Appreciation of plants, animals, wildlife, ecosystems etc.
I appreciate the plants, animals, wildlife, ecosystems etc. Habitat and biodiversity / Habitat
Erosion control, soil fertility, water and climate regulation, air quality maintenance
Appreciation of
environmental capacity to produce, preserve, clean, and renew air, soil and/or water
I appreciate the environmental capacity to produce, preserve, clean, and renew air, soil, and/or water
Environmental capacities / Env cap
2.3 Data collection 210
Our survey covered full or part-time local residents who were recruited through purposive stratified 211
sampling based on the following three stratification criteria: 1) municipality; 2) gender, and; 3) age 212
(young: 15-29 years, middle-aged: 30-59 years, seniors: ≥ 60 years). The first criterion was based 213
on the geographical balance of respondents within each study area, while the latter two were in 214
proportion to local census data (except for RO-SA where local census statistics were unavailable).
215
Respondents were approached in key public locations such as market places, cafés, streets, 216
schools, and health care centers (Bieling et al., 2014; Scolozzi et al., 2014). A crowdsourced 217
sample (allowing any interested person to fill in the survey) through distributing an URL link was 218
additionally included in CH-SB. Data collection was tested in SP-LT and CH-SB in May-August 219
2015 (Fagerholm et al., 2016). At the other study areas, the interviews were carried out in 220
February-September 2016 through a web-based PPGIS survey (Maptionnaire platform) on tablets 221
and laptops. Due to the lack of internet coverage, we performed the surveys using paper 222
questionnaires and maps in RO-SA and then inserted the data to the survey platform. The survey 223
was filled in with the help of facilitators who were trained to use a standardized protocol. In the 224
survey introduction the facilitators stressed the focus on the informant’s personal relationship to 225
nature and landscapes in the everyday surroundings. The survey started by identifying the 226
respondents’ home locations and then subsequently ES benefits as points (Table 1, Fig.1, example 227
survey from ES-SC, accessible at: https://app.maptionnaire.com/fi/869). Respondents could map 228
an unlimited number of ES benefits or choose also not to map a specific ES benefit. The 229
background map was a Bing satellite image with overlaid Open Street Map objects. A minimum 230
zoom level of 1:25 000 was enforced to ensure spatial scale coherence in mapping. After each 231
mapped item, a pop up window opened asking description of the mapped place (these descriptions 232
helped to contextualize the mapped places but are not systematically treated in this paper). ES 233
benefit mapping was followed by an open question “How does this area and the opportunities it 234
offers contribute to your well-being?” (not discussed in this paper). The final survey pages included 235
questions on socio-demographic characteristics (gender, age, education, household income) and 236
relationship to the study area landscape (landownership, self-estimated knowledge of the area, 237
length of residency and field of work in agriculture) addressing the ’personal characteristics’ and 238
’social context’ presented in the Scholte et al. (2015) framework . 239
2.4 Respondents, ES benefits and relationship to personal characteristics 240
Identified ES benefits and respondents’ characteristics were analyzed in SPSS 24 through 241
descriptive statistics and by cross tabulation, where Chi square tests were applied and 242
standardized adjusted residuals explored to identify significant associations. The family-wise error 243
rate in multiple pair wise tests (type I error, 80 tests) was controlled by the Benjamini-Hochberg 244
method (Benjamini et al., 1995) to 5%. The reported p-values are the original ones. Cramer’s V 245
test was applied to measure the strength of association across the cross classification tables.
246
Identified ES benefits were also interpreted in the context of wealth level (GDP/capita), population 247
density, and rurality of the study area (Supplementary table A.1.).
248
2.5 Sample representativeness and comparison of facilitated and crowdsourced sampling in 249
CH-SB 250
Representativeness of the sample for the population of the study areas was assessed with census 251
data on the variables of age and gender. Overall, the difference between the sample and census 252
was good with less than 3.7% difference per age/gender group with the exception of elderly 253
women, who were difficult to reach and 6.8% less represented compared to sample 254
(Supplementary Table A.3). Among individual study areas, men aged 30-59 years were 255
challenging to interview in CH-FM, DE-HW, SP-LT and UK-BR (sample-census difference: -6.3- 256
14.8%) and were compensated by men of other ages. Young people were proportionally less 257
represented in CH-SB (sample-census difference: men -14.8%, women -11.2%), but were more 258
represented in DE-HW (sample-census difference men 11.5%, women 9.2%) and SE-LI (sample- 259
census difference: men 8.3%, women 14.5%).
260 261
CH-SB survey participant profiles were examined for differences in facilitated and crowdsourced 262
sample. There are no statistically significant differences between the facilitated (130 respondents) 263
and open (91 respondents) approach in CH-SB related to gender, age or level of education. The 264
number of mapped places per ES benefit is different depending on the survey approach (X2(10, 265
N=2877)=116.54,p=0.00). In the facilitated approach, respondents mapped more points (16.0 vs.
266
8.7) compared to the crowdsourced approach. Crowdsourced respondents mapped more 267
recreational benefits and facilitated respondents more farm and harvested products, culture and 268
heritage, inspirational, spiritual or religious values, and environmental capacities. This could 269
indicate that facilitation encourages respondents to map a broader range of benefits and not only 270
recreation (Brown, 2012). However, when comparing the distribution of mapped ES benefits in CH- 271
SB to the other Swiss study area (CH-FM) there is a similar trend, and the share of outdoor 272
recreation in CH-SB is the same as the average across all study areas (Fig. 3). Hence, the 273
crowdsourced respondents do not seem to bias the results significantly. The point mapping method 274
also possibly contributes positively to the quality of the crowdsourced data as PPGIS participants 275
tend to find point mapping straightforward (Brown and Pullar, 2012).
276
2.6 Spatial patterns of ES benefits 277
Spatial patterns of mapped ES benefits were analyzed in ArcGIS 10.4. We studied the spatial 278
arrangement of the ES benefit point layers with nearest neighbor statistics (NN) to explore random 279
distribution and clustering (Ebdon, 1985). NN statistics measures the average Euclidian distance 280
between each point and its nearest neighbors and divides this by the average distance in a 281
hypothetical randomly distributed point layer within the analysis area, i.e. the area of smallest 282
polygon enclosing all mapped points for each study area excluding outliers. NN ratio below 1 283
exhibits spatial clustering. Secondly, we calculated the Euclidian distance between respondent 284
home and mapped locations as it was expected that variation in distance might explain spatial 285
patterns (Fagerholm et al., 2012).
286
2.7 Land cover overlay 287
In order to analyse the relationship with land cover, mapped points were buffered with 250 m 288
radius and overlaid with land cover data (CORINE Land Cover 2012 (CLC) version 18.5, available 289
by the European Environment Agency (EEA) at: http://land.copernicus.eu/pan-european/corine- 290
land-cover/clc-2012). CLC data had been reclassified into five major land cover classes: settlement 291
and artificial surfaces (all artificial surfaces, CLC classes 111-142), simplified agricultural land 292
(arable lands, permanent crops and pastures, CLC classes 211-231, 321), heterogeneous 293
agricultural land (heterogeneous agricultural areas, CLC classes 241-244), forest (forests, scrub 294
and herbaceous vegetation associations, open spaces with little or no vegetation, CLC classes 295
311-313, 322-335), and water bodies and wetlands (water bodies and wetlands, CLC classes 411- 296
523). Buffering the mapped point locations acknowledges the landscape context in which the 297
specific benefits are found and also appreciates uncertainty in spatial precision of mapping. Based 298
on the mapping scale, the aims of the survey to address local everyday landscapes and our 299
experience from the surveys, a 250 meter buffer was chosen for our data. The proportional shares 300
(%) of different land cover classes were compared between the different ES benefits and the 301
analysis area. Z scores were calculated for each ES benefits and land cover pair (Supplementary 302
Eq. A.1) to determine whether specific mapped ES benefits were represented statistically 303
significantly more (z score >+1.96) or less (z score <-1.96) frequently than expected (two-tailed 304
test, α=0.05) (Brown et al., 2015a).
305
2.8 Analysis area 306
In order to calculate the nearest neighbor statistics and different land cover classes in each study 307
area, an analysis area was defined for each study area by creating the smallest convex polygon 308
enclosing the mapped points. Single points located on the outskirts of the mapped point pattern 309
were identified visually in each study area and a specific threshold distance from the study area 310
boundary was specified to discard the outliers. Depending on the character of the study area, 311
these threshold distances vary between 15 and 45 km (excluding GR-KA peninsula where the 312
threshold was not applied as it is surrounded by the sea). Mapped points falling within the analysis 313
area represent 95.5% of the original points.
314
2.9 Generalized Linear Mixed Models 315
A linear modelling approach (Bolker et al., 2009) was applied to quantify the relationship between 316
biophysical landscape characteristics and mapped ES benefits. We decided to use a GLMM 317
approach to deal with the potentially confounding effects derived from spatial autocorrelation.
318
Although a variety of spatial regression-methods exist for dealing with spatial autocorrelation 319
(Anselin and Bera, 1997), a GLMM approach was preferred because of the grouped structure of 320
our data. Our dataset consisted of spatially separate sites within which spatially autocorrelated 321
observations exist. GLMMs represent a natural framework for analyzing such data structured in 322
groups or clusters (Gelman and Hill, 2007).
323
The model included the different categories of land cover, with interest in the comparison of 324
simplified vs. heterogeneous agricultural landscapes, and these vs. natural (not agricultural) 325
landscapes. As reported in literature (Hausner et al., 2015; Laatikainen et al., 2017), the use of the 326
landscape is also determined by accessibility. Thus, additional predictors such as distance to 327
home, density of roads, and slope were included. The protection status of the land was also 328
included given that conservation areas can attract people for recreational and habitat-related ES 329
benefits, but also can prohibit the use of the land for provisioning ES. We produced two databases 330
for the modelling. The first one was based on the individual mapped points and a 250 m buffer 331
around each point (n=27952, after removing 19 points as outliers with distance to home > 100 km) 332
as a response variable. The second database was created as a grid with 400 m cell size (n=20497, 333
after removing the outliers) where we calculated as response variables the sum of all mapped ES 334
benefits (i.e. intensity) and ES benefit diversity (based on Shannon diversity index). Study area 335
was included as a random effect to deal with confounding effects of spatial autocorrelation within 336
each study area (n=13).
337
Nine different predictors of landscape characteristics were calculated for each point buffer and grid 338
cell including:
339
· share of each land cover class, 340
· land cover richness (number of different land cover types), 341
· share of conservation area (Natura 2000 data by EEA, available at:
342
https://www.eea.europa.eu/data-and-maps/data/natura-7#tab-metadata and Nationally 343
designated areas by EEA, available at: https://www.eea.europa.eu/data-and- 344
maps/data/nationally-designated-areas-national-cdda-11#tab-metadata), and 345
· accessibility (distance to home (calculated as metres from respondent home point to each 346
mapped point), length of roads and paths (in metres based on OpenStreetMap data 347
downloaded from https://www.geofabrik.de/data/download.html in February 2017), and 348
average slope)).
349
Settlement and artificial surfaces and length of roads and paths were highly correlated (r>0.5) and, 350
therefore, only the latter was retained for modelling. All other variables were weakly or not 351
correlated with each other. There were few significant correlations between the landscape 352
predictors and socio-demographic variables (Supplementary Table A.4).
353
Models were fitted through a Bayesian framework using integrated nested Laplace approximations 354
(INLA, Rue et al., 2009) in R v3.4.0. INLA was chosen as it represents an analytical short-cut for 355
estimating Bayesian regression parameters without the need to employ computationally expensive 356
Markov Chain Monte Carlo algorithms. Details of the fitted models including equations are reported 357
in Eq. A.2 in Supplementary Material. Models were tested for sensitivity to priors for 358
hyperparameters. Varying priors did not alter the results and we, therefore, kept INLA defaults.
359
Models were checked for adequacy using data residuals plots. Moran’s correlogram was computed 360
to assess the degree of spatial autocorrelation. An inspection of residual spatial autocorrelation 361
(SAC) through correlograms indicated that the models effectively removed SAC (Supplementary 362
Fig. A.5).
363
3. Results 364
3.1 Respondent profile 365
Women (49.3% of respondents) and men (50.7%) were equally represented in the sample 366
(Supplementary Table A.2). 21.2% of respondents were younger than 30 years, 48.5% were aged 367
between 30 and 59 years old, and 30.3% were 60 years or older. Of the respondents, 27.2% had a 368
university or polytechnic degree, 68.5% had a lower level of education and 4.3% had no formal 369
schooling. The lowest levels of education were found in DE-HW, SP-LT, SP-MO, SP-SC and PT- 370
MN. Income level varied with 47.8% having income above the median in the region and 52.2%
371
below. 61.6% of respondents were employed, 20.8% were retired, and 18.1% were parenting at 372
home, students, or unemployed. 13.7% were working in agriculture, forestry or fishery (especially 373
in RO-SA, PT-MN and SP-MO >25.0%), while 86.3% were not. 60.2% of respondents were 374
landowners. 78.2% reported having extremely or quite good knowledge of the local area, 17.0%
375
moderate knowledge, and 4.8% poor knowledge. Most people (77.0%) had lived for more than 15 376
years in the area, 9.0% less than 5 years, and 14.0% between 6 and 15 years. Long residency was 377
prominent in SP-MO, SP-SC and RO-SA (>60.0% more than 30 years).
378
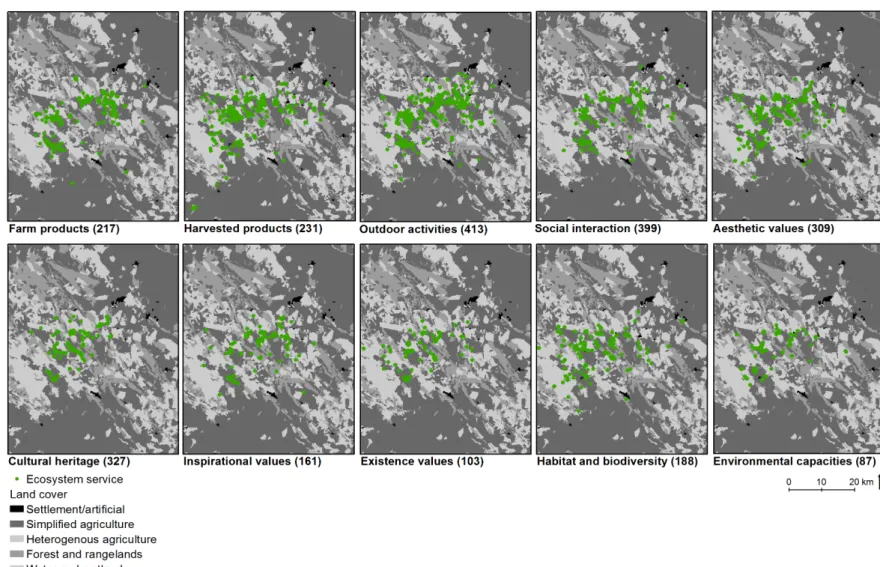
3.2 Identified ES benefits and their spatial patterns 379
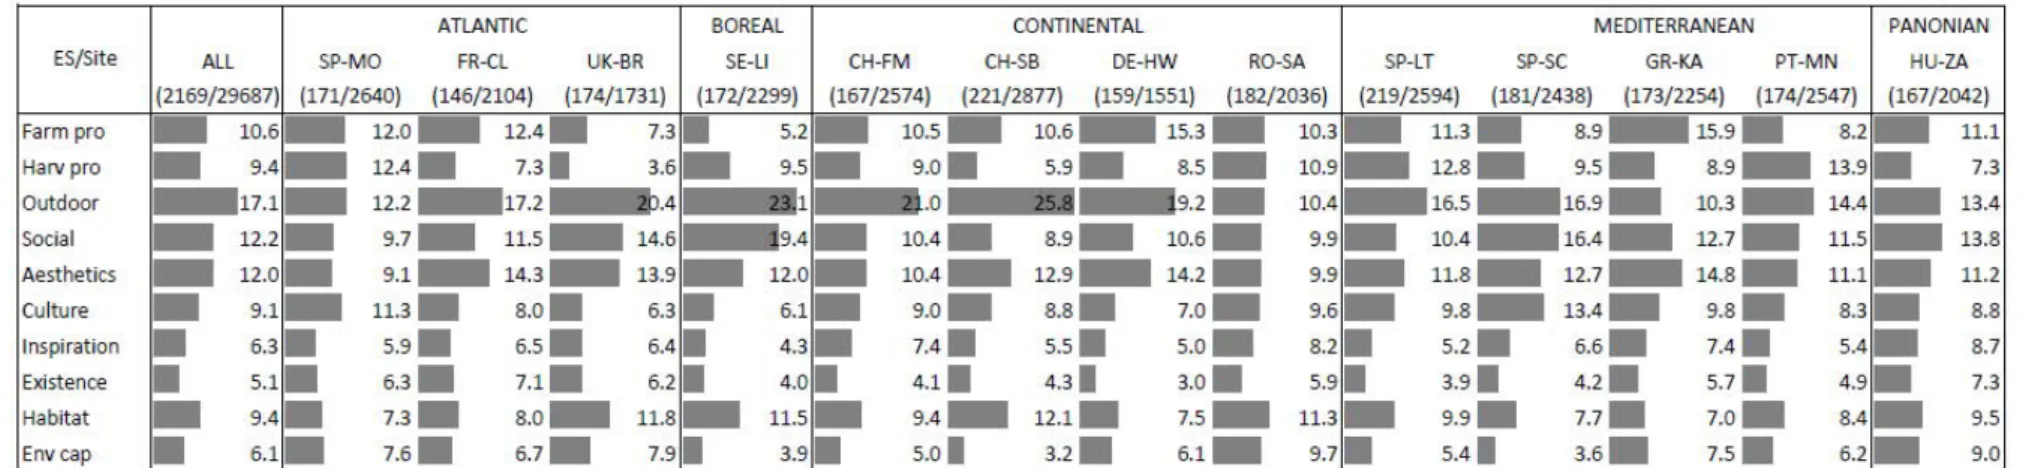
The 2,301 survey respondents mapped 28,878 places indicating ES benefits (Fig. 3). On average 380
(mean±SD), each respondent mapped 12.5±5.2 places (ranging from a minimum in DE-HW of 381
9.4±4.3 to a maximum in CH-FM of 14.8±5.2). Outdoor recreation activities were clearly the most 382
mapped ES benefits with the highest share in eleven out of the thirteen study areas (Fig. 3).
383
Across all study areas, outdoor recreation activities were attributed to 17.1% of places, but most 384
prominently (>20% of mapped places) they were perceived in Central and Northern European 385
study areas (CH-FM, CH-SB, UK-BR, SE-LI). These areas have high GDP/capita, population 386
density and economic density, and high/average accessibility (Supplementary Table A.1). Other 387
commonly mapped ES benefits were aesthetic values and sites for social interaction, representing 388
13.1% and 12.9% of all mapped places respectively. Across all study areas, cultural heritage was 389
related to 9.8% of places. Benefits of farm and harvested products linked to provisioning ES were 390
also frequently mapped (10.6% and 9.5% of mapped places respectively). These benefits, 391
particularly the harvesting of wild products, played an important role in Mediterranean and Eastern 392
European study areas. These areas typically have the highest share of respondents working in 393
agriculture (mostly >20%), and low GDP/capita, population density and economic density, and 394
low/average accessibility (Supplementary Table A.1). Existence values, environmental capacities 395
and, inspirational, spiritual and religious values attracted the least attention, with shares of 5.5%, 396
6.6% and 6.8% out of all mapped places respectively. Across all the study areas, habitat and 397
biodiversity was associated with 10.0% of all places.
398
We found a statistically significant spatial clustering of the mapped places (point patterns) for 399
individual ES benefits in each of the study areas. The most clustered patterns were detected for 400
appreciation of culture and heritage at seven study areas (DE-HW, SP-LT, SP-MO, SP-SC, UK- 401
BR, GR-KA, and RO-SA), for farm products at four study areas (CH-FM, CH-SB, FR-CL, and PT- 402
MN), and for habitat and biodiversity (SE-LI) and social interaction (HU-ZA) at one study area each 403
(Table A.5, Fig. A.1). Patterns were most dispersed for harvesting (SP-SC, UK-BR, GR-KA, SE-LI), 404
habitat and biodiversity (CH-FM, FR-CL, RO-SA), social interaction (DE-HW, PT-MN), outdoor 405
recreation activities (CH-SB), aesthetic values (SP-LT), inspirational, spiritual or religious values 406
(SP-MO), and existence values (HU-ZA). Places for the appreciation of farm products were closest 407
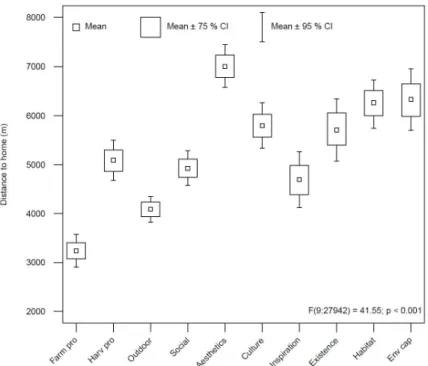
to respondents’ homes at seven study areas and ranked among the three closest at other study 408
areas (range from CH-SB, mean 823±1162 m, to SE-LI, mean 9402±11 232 m) (Supplementary 409
Fig. A.2). At ten study areas, harvested products ranked among the three ES benefits that were 410
perceived closest to respondents’ homes. Outdoor recreation activities and social interaction were 411
also frequently situated close to homes. Aesthetic values were located furthest away from 412
respondents’ homes at four study areas and were among the three most distant ES benefits in six 413
study areas (range from CH-SB, mean 1784±1571 m, to FR-CL, mean 14 193±30 085 m). Benefits 414
linked to regulating/supporting ES were among the three most distant in six study areas.
415
416
Figure 3. Proportion of mapped ES benefits in ten categories across study areas. Relative proportion (%) of ES benefits mapped by 417
survey respondents at each study area and in total. Numbers in brackets refer to number of informants/number of mapped places (points).
418
Study sites in biogeographic regions: SP-MO=Montaña Oriental Lucense, Spain; FR-CL=Canton de Loudeac, France; UK-BR=the Brecks, 419
England, UK; SE-LI=Linköping, Sweden; CH-FM=Franches Montagnes, Switzerland; CH-SB=Schwarzbubenland, Switzerland; DE- 420
HW=Hochkirch-Weißenberg, Germany; RO-SA=Saxon region, Romania; SP-LT=Llanos de Trujillo, Spain; SP-SC=Serena Campiña, 421
Spain; GR-KA=Kassandra, Greece; PT-MN=Montemor-o-Novo, Portugal; HU-ZA=Zala, Hungary.
422
3.3 Respondent characteristics as determinants of ES benefits 423
Respondents’ relationship to the study area was significantly related to the type of mapped ES 424
benefits (Table 2). The differences between the respondent groups in terms of independent 425
variables are, however, mostly between 10 and 20%, expressing a low degree of association.
426
Owning land in the area increased the likeliness of mapping most types of ES benefits (except 427
sites for outdoor recreation and social interaction) and was the most significant respondent 428
characteristic. Land ownership showed the strongest (but still moderate) association with farm 429
products (90.8% of landowners vs. 69.5% of non-landowners mapped these, X2(1, 430
N=2048)=152.01***, V=0.272). The higher the self-estimated knowledge of the landscape, the 431
higher the likelihood that respondents would map a specific ES benefit (except sites for outdoor 432
recreation and social interaction). A similar pattern was also observed for length of residency, 433
where longer residency was related to an increased likelihood of mapping farm products (X2(3, 434
N=2144)=34.00***, V=0.126), harvested products (X2=42.00***, V=0.140), aesthetic values 435
(X2=9.90*, V=0.068), and culture and heritage values (X2=45.30***, V=0.145). Long residency 436
(particularly more than 31 years) is also related to work in agriculture (X2(3, N=2112)=52.6***).
437
Respondents working in agriculture mapped significantly more benefits linked to provisioning ES 438
(farm products X2(1, N=2261)=22.53***, V=0.100, harvested products X2=29.32***, V=0.114), 439
regulating/supporting benefits (provision of habitat X2=6.21*, V=0.052, environmental capacities 440
X2=5.82*, V=0.057), and culture and heritage values (X2=6.32**, V=0.053), but less outdoor 441
recreation (X2=11.56**, V=0.072), compared to respondents in other fields of work. There were few 442
statistically significant relationships between either gender, age, level of education, or household 443
income and the type of mapped ES benefit (Supplementary Table A.6).
444 445
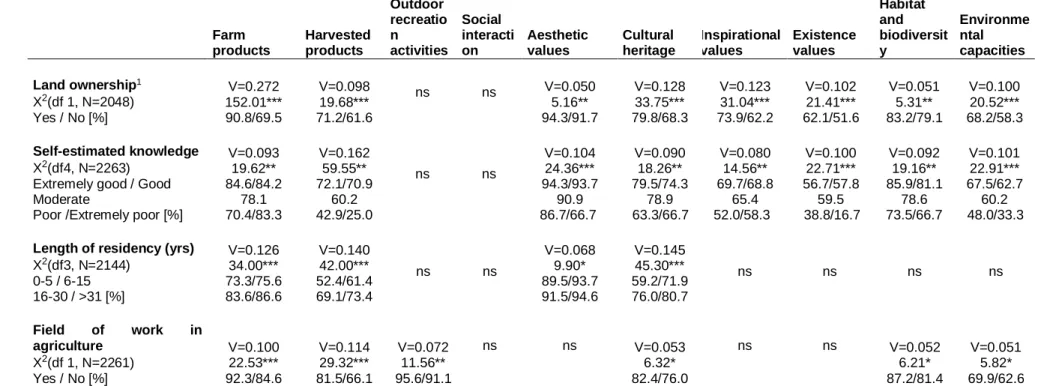
Table 2. Relationship between mapped ES benefits and respondent characteristics related to relationship to landscape. Information is 446
presented as percentage of respondents who mapped specific ES in each category with Chi square test of significance of association 447
(***=p<0.001, **= p<0.01 an *=p<0.05) and Cramer’s V test measuring the strength of association (0.0 to <0.1 negligible, ≥0.1 to <0.2 448
weak, ≥0.2 to <0.4 moderate association (Rea and Parker, 1997)).
449 450
Farm products
Harvested products
Outdoor recreatio n activities
Social interacti on
Aesthetic values
Cultural heritage
Inspirational values
Existence values
Habitat and biodiversit y
Environme ntal capacities Land ownership1
X2(df 1, N=2048) Yes / No [%]
V=0.272 152.01***
90.8/69.5
V=0.098 19.68***
71.2/61.6
ns ns V=0.050
5.16**
94.3/91.7
V=0.128 33.75***
79.8/68.3
V=0.123 31.04***
73.9/62.2
V=0.102 21.41***
62.1/51.6
V=0.051 5.31**
83.2/79.1
V=0.100 20.52***
68.2/58.3 Self-estimated knowledge
X2(df4, N=2263) Extremely good / Good Moderate
Poor /Extremely poor [%]
V=0.093 19.62**
84.6/84.2 78.1 70.4/83.3
V=0.162 59.55**
72.1/70.9 60.2 42.9/25.0
ns ns
V=0.104 24.36***
94.3/93.7 90.9 86.7/66.7
V=0.090 18.26**
79.5/74.3 78.9 63.3/66.7
V=0.080 14.56**
69.7/68.8 65.4 52.0/58.3
V=0.100 22.71***
56.7/57.8 59.5 38.8/16.7
V=0.092 19.16**
85.9/81.1 78.6 73.5/66.7
V=0.101 22.91***
67.5/62.7 60.2 48.0/33.3 Length of residency (yrs)
X2(df3, N=2144) 0-5 / 6-15 16-30 / >31 [%]
V=0.126 34.00***
73.3/75.6 83.6/86.6
V=0.140 42.00***
52.4/61.4 69.1/73.4
ns ns
V=0.068 9.90*
89.5/93.7 91.5/94.6
V=0.145 45.30***
59.2/71.9 76.0/80.7
ns ns ns ns
Field of work in agriculture
X2(df 1, N=2261) Yes / No [%]
V=0.100 22.53***
92.3/84.6
V=0.114 29.32***
81.5/66.1
V=0.072 11.56**
95.6/91.1
ns ns V=0.053
6.32*
82.4/76.0
ns ns V=0.052
6.21*
87.2/81.4
V=0.051 5.82*
69.9/62.6
1Does not include SP-LT.
451 452
3.4 Landscape characteristics as determinants of ES benefits 453
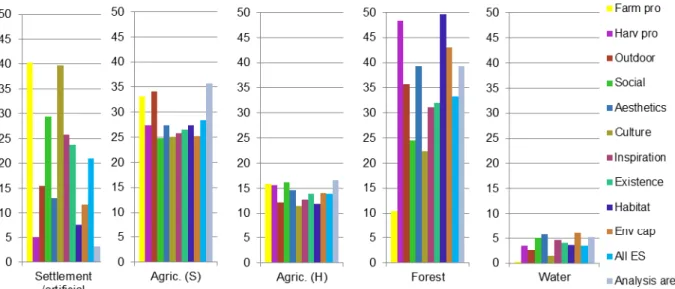
Settlement and other artificial surfaces comprised only 3.1% of the analysis area, but mapped ES 454
points were heavily over-represented in this land cover (20.0% of area in mapped locations, 455
z=173.44, p≤0.05). Settlement and artificial surfaces were particularly related to high amounts of 456
ES benefits related to farm products (40.3% of area in mapped locations, z=119.25, p≤0.05), 457
appreciation of culture and heritage (39.7%, z=108.58, p≤0.05) and sites for social interaction 458
(29.5%, z=90.62,p≤0.05) (Supplementary Fig. A.3 and Fig. A.4).
459
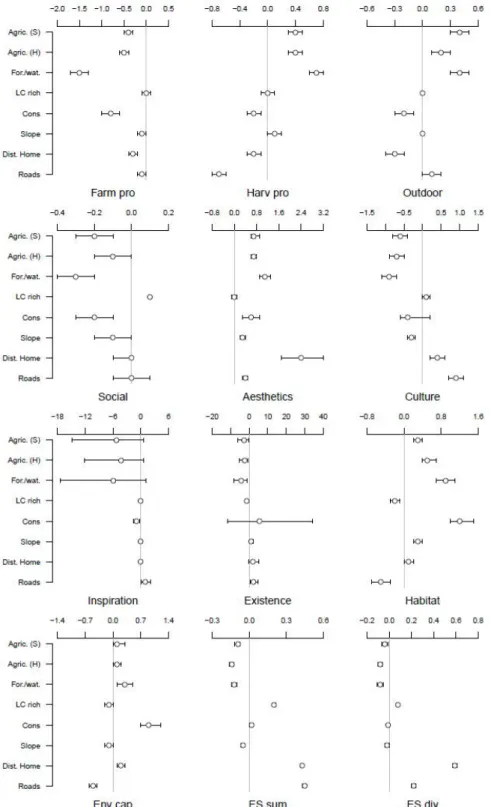
Looking at all predictors of landscape characteristics, the multivariate regression revealed 460
accessibility (distance to home, length of roads and paths, and slope) as the most important 461
predictor of individual mapped ES benefits, ES benefits sum and ES benefits diversity (Fig. 4, Fig.
462
5, Supplementary Table A.7). Benefits linked to provisioning ES and outdoor recreation activities 463
decreased with increasing distance from the respondents’ home. In contrast, aesthetic values, 464
culture and heritage, regulating/supporting benefits (habitat and biodiversity, environmental 465
capacities) and ES benefit sum and diversity showed an increase with greater distance from 466
respondents’ homes. Benefits linked to regulating/supporting and provisioning ES (especially 467
harvesting) decreased with increasing length of roads and paths, while benefits linked to cultural 468
ES increased, as did ES benefit sum and diversity. Slope played a less important role, showing a 469
negative relationship (i.e. connection to flat terrain) with farm products and social interaction, but a 470
positive one (i.e. connection to hilly and mountainous terrain) with aesthetic values, existence 471
values and habitat and biodiversity perception.
472
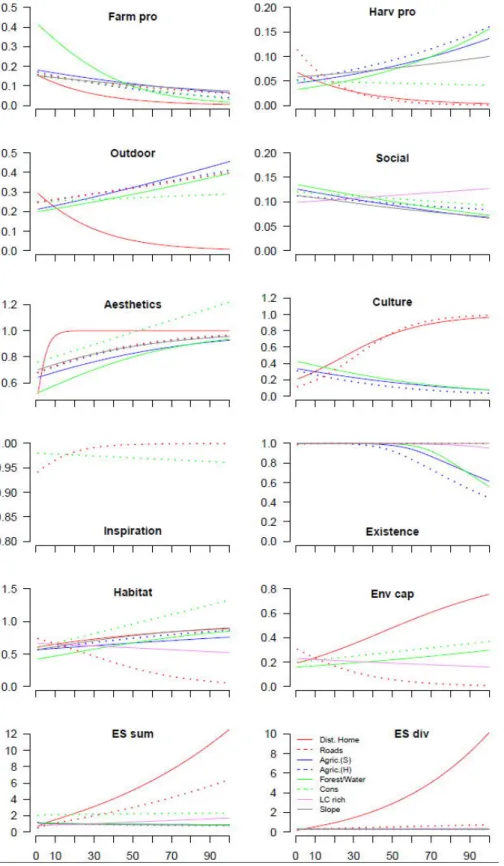
Each ES benefit showed the same general response to the three types of land cover (simplified 473
agricultural land, heterogeneous agricultural land, forests/water) (Fig. 4 and Fig. 5, Supplementary 474
Table A.7). The abundance of forest/water was more positively related to harvesting of wild 475
products than other land covers, while forest/water was the most negative predictor of farm 476
products. Forest/water was also a positive significant predictor of regulating/supporting service- 477
related ES benefits (i.e. habitat and biodiversity and environmental capacities), outdoor activities 478
and aesthetic values. Although land cover richness showed a low explicative power for individual 479
ES benefits, it was positively associated with the sum and diversity of ES. Conservation areas 480
were also relevant determinants of ES benefit perception. While regulating/supporting benefits and 481
aesthetic values as well as the sum of ES benefits increased with a growing proportions of the land 482
designated as conservation areas, a reverse trend was identified for provisioning service-related 483
ES benefits (appreciation of farm products and harvested products), outdoor recreation activities, 484
and social interaction.
485
486
Figure 4. Relationship between predictors of landscape characteristics and ES benefits. Parameter 487
estimates for the GLMM are based on summaries of the marginal posterior distributions of the 488
predictors. Predictors describing landscape characteristics are shown on the vertical axis and 489
include share of land cover class (Agric. (S)=simplified agricultural land, Agric. (H)=heterogeneous 490
agricultural land), land cover richness (LC rich), share of conservation area (Cons), average slope 491
(Slope), distance to home (Dist. Home), and length of roads and paths (Roads). Predictors with 492
horizontal bars (95% credibility intervals) not crossing the zero line are interpreted as significant 493
(with negative values indicating a negative correlation and positive values a positive correlation, for 494
values, see Supplementary Table A.7). For ES benefit acronyms, see Table 1, ES sum=sum of all 495
mapped ES benefits, ES div=diversity of mapped ES benefits.
496
497
Figure 5: Partial dependence plots between ES benefit datasets and landscape characteristics 498
predictors, as obtained from the GLMM analysis. Curves indicate how the probability that the 499
response variables (individual ES (for ES benefit acronyms, see Table 1), ES sum and ES diversity 500
displayed on vertical axis) varies in relation to landscape characteristics (share of land cover class 501
(Agric. (S)=simplified agricultural land, Agric. (H)=heterogeneous agricultural land), land cover 502
richness (LC rich), share of conservation area (Cons), average slope (Slope), distance to home 503
(Dist. home), and length of roads and paths (Roads), displayed on horizontal axis, normalized to 0- 504
100 range). The curves are only presented for the influential predictors (i.e. the bolded ones in 505
Supplementary Table A.7). Partial dependence plots were created following the method suggested 506
by Elith et al. (2005).
507
4. Discussion 508
4.1 ES benefits in multifunctional landscapes 509
This study addresses ES benefits perceived by people in their everyday landscapes across the 510
major types of multifunctional landscapes in Europe. Many studies have addressed PPGIS in the 511
context of national forests and parks (e.g. Brown, 2012; Palomo et al., 2013; Sherrouse et al., 512
2014). In contrast, our study focuses on rural landscapes that are of particular importance in 513
people’s everyday life. Our findings show substantial consistency across the 13 study areas, with 514
outdoor recreation, aesthetic values, and social interactions being the key ES benefits perceived.
515
The importance of these three ES benefits has also been observed in participatory mapping 516
studies performed with residents (Garcia-Martin et al., 2017; Hausner et al., 2015) and tourists 517
(Scolozzi et al., 2014; Zoderer et al., 2016) elsewhere. The importance of recreation (often 518
combined with tourism) and aesthetics is further stressed by the fact that these have received most 519
attention among cultural ES assessments that applied a variety of methods (Hernández-Morcillo et 520
al., 2013; Martínez-Harms and Balvanera, 2012; Milcu et al., 2013). Social interaction has been 521
targeted less often, but our analysis suggests that it is a fundamental ES benefit of multifunctional 522
landscapes.
523
Some variation in ES benefits across the 13 study sites is observed highlighting the economic 524
growth- and wealth-related drivers of these social-ecological systems (Nelson et al., 2006). The 525
economically marginal study areas (common in Mediterranean and Eastern Europe) typically have 526
a high proportion of people working as farmers (partly carrying out subsistence farming), who are 527
more dependent on and invest more in local benefits linked to provisioning ES. In contrast, the 528
study areas with a more peri-urban landscape character and higher GDP usually have fewer 529
subsistence farmers and the proportion of people directly employed on the land (and therefore 530
directly involved in generating provisioning ES) is low. In these study areas the appreciation of 531
landscapes is more related to recreational and other benefits linked to cultural ES, which suggests 532
that this is a sector where rural entrepreneurs should invest as a country becomes wealthier and 533
more urbanized.
534
Our analysis reveals particular spatial patterns in the perception of ES benefits and highlights that 535
settlements in multifunctional landscapes are hotspots for ES benefits perceived by respondents 536
(c.f. Garcia-Martin et al., 2017; Ridding et al., 2018). Sites for social interaction are clustered near 537
respondents’ homes, highlighting the importance of everyday landscape in providing sites for 538
planned and unplanned social encounters. Outdoor recreation activities, in a similar way as the 539
harvesting of wild products, generally take place close to people’s homes. Thus, easy access to 540
nature in multifunctional landscapes seems a key for providing these ES benefits and crucial for 541
people’s well-being, similarly observed by Ridding et al., (2018). An immediately accessible natural 542
environment is not, however, commonly associated with aesthetic values, which are the ES 543
benefits located furthest away from respondents’ homes. Possibly, people find ’unusual’
544
landscapes with less built structures more aesthetically attractive. ES benefits representing cultural 545
and heritage values are highly clustered (typically displaying spot-like features, e.g. an ancient 546
bridge or a wayside shrine), which suggests that there are well-known places which are valued by 547
many people. These places can be easily identified and maintained through landscape planning 548
and conservation efforts. At the same time, however, rural landscapes are intensively appreciated 549
for ES benefits related to individual preferences and experiences such as aesthetic values, 550
harvesting wild products, habitat and biodiversity, outdoor recreation activities, and inspirational, 551
spiritual, religious and existence values. Since these ES benefits are not clustered, but dispersed 552
across the landscape, they cannot be rigorously delineated and, thus, require careful land use 553
planning for multiple types of uses to sustain them and for not to be compromised by development 554
projects.
555
The respondents’ deep-rooted relationship with the study area (rather than more general socio- 556
demographic characteristics, similarly observed by Ode et al., 2009) is significantly linked to the 557
type of ES benefits that they mapped. The appreciation of ES benefits is higher among 558
landowners, agricultural workers, people who know the landscape well and long-term residents, 559
generalizing earlier findings on the role of land ownership (Garcia-Martin et al., 2017) and local 560
ecological knowledge (Barthel et al., 2010; Martín-López et al., 2012) as determinants of ES 561
appreciation. Such understanding is important for those researching and managing rural 562
landscapes, as it allows to identify key beneficiaries of ES. Howley et al., (2012) also suggest that 563
people with overall appreciation of cultural and biological diversity in rural landscapes support 564
actions aimed at landscape protection. To understand these relationships more deeply, future 565
research should address the role of place attachment in the perception of ES benefits, e.g. by 566
including community participation to contextualize the ES framework (Pascua et al., 2017).
567
Our study addresses the important role of accessibility in the perception of ES benefits (Schröter et 568
al., 2014), applying a set of variables available across Europe, and shows that landscape 569
characteristics related to accessibility are particularly important for the presence of perceived ES 570
benefits. This same pattern has also been identified through analysis of geo-tagged social media 571
photos and the pivotal importance of accessibility in terms of outdoor recreation and aesthetic 572
values (van Zanten et al., 2016). The role of accessibility further highlights the settlements as ES 573
benefit hotspots as distances to home are the shortest, and road and path network the densest.
574
Although settlements host many ES benefits, particular benefits in settlement areas include the 575
appreciation of agricultural products from home gardening and local farmers, the presence of 576
culture and heritage sites, and sites for social interaction linked to easy accessibility. It is intuitive 577
that more ES benefits are found in villages and towns where the landscape-people interaction is 578
the most intensive and where heritage is prominently present. This points to the discussion on the 579
co-production of ES, in this case especially of the cultural ES (Palomo et al., 2016). Our results 580
highlight the interactions between biophysical and socio-cultural processes, people and place, as 581
essential for generating these ES benefits (Fischer and Eastwood, 2016). Noteworthy is, though, 582
that people often map places they have access to and are most familiar with and that these sites 583
are not necessarily the most valuable areas in terms of biodiversity or provision of other ES.
584
In terms of farm products sold in villages, settlement land cover is an intermediate for ES benefits 585
provided by the surrounding agricultural land. With our survey, we mapped how people perceive 586
their everyday landscapes. However, our results revealed how these perceptions are driven by 587
personal characteristics and related to cultural and socio-economic conditions as well as to the ES 588
capacity of the landscape to provide these; pointing out to potential mismatches between supply 589
and demand of ES (Bagstad et al., 2014; Wei et al., 2017). This highlights the relevance of ES 590
flows (Palomo et al., 2013, Bagstad et al., 2014, Villamanga et al., 2014) for future research on 591
perceived ES benefits. It also highlights the challenges related to extrapolation and upscaling 592
(Crossman et al., 2013). Nevertheless, PPGIS approaches may successfully complement 593
integrated ES modelling and decision support tools (Grêt-Regamey et al., 2017) by particularly 594
emphasising a wider variety of cultural ES compared to proxy indicators that are often restricted to 595
recreation (Bagstad et al., 2017).
596
Our land cover analysis and regression modeling demonstrate particular appreciation of forest and 597
water bodies which confirms the results from various landscape perception studies (e.g. Brown et 598
al., 2015a; Howley et al., 2012; Petrova et al., 2015; Ridding et al., 2018). Both the ES benefit sum 599
and diversity increase with land cover richness and suggest that mosaic landscapes (e.g. at the 600
interface of settlement and artificial surfaces and other land uses) are favored by people, which 601
highlights the importance of multifunctionality and spatial patterns for generating socio-cultural 602
values (Van Zanten et al., 2014). Conservation areas are predominantly appreciated for benefits 603
linked to regulating/supporting ES and aesthetic values, but less so for benefits linked to 604
provisioning and some cultural ES (i.e. outdoor recreation activities, social interaction and 605
inspirational values). These deficits may be addressed through protected area management and 606
planning strategies that encourage more intensely tangible human-nature interactions (Chan et al., 607
2016).
608
4.2 Considering the method 609
Our limited number of case studies makes it impossible to be representative of multifunctional 610
landscapes in Europe as a whole and hence our study is not a continent-wide study. Rather it is 611
illustrative of the diversity of European multifunctional landscapes. We acknowledge that residents 612
represent a very relevant, but not the only group of stakeholders benefitting from ES in these 613
landscapes. Published studies show that different stakeholders with variable power, interests and 614
worldviews perceive ES benefits differently and at different scales (Martín-López et al., 2012; Van 615
Riper and Kyle, 2014). Participatory mapping provides a means of assessing the less tangible 616
benefits that landscapes and ecosystems provide to humans, the lack of which has been a 617
recurring criticism of the ES framework (Daniel et al., 2012; Setten et al., 2012; Small et al., 2017).
618
In our PPGIS approach the mapped individual benefits are aggregated without group deliberation.
619
However, as these mapped ES benefits are tied to a place, connect to the sense of place, 620
landscape, community and way of life, they are likely to be strongly shared as communal values 621
(Kenter et al., 2015).
622
Our facilitated approach to survey data collection allowed, firstly, better control of respondent 623
population compared to pure random household sampling which is the most common sampling 624
approach applied in PPGIS mapping of ES benefits and frequently leads to samples that include 625
older and male respondents disproportionately (Beverly et al., 2008; Brown and Reed, 2009;
626
Raymond and Brown, 2007). However, as our sampling considered only gender and age, we 627
acknowledge that the sample does not necessarily represent the population in terms of other 628
socio-demographic factors. Secondly, the facilitated approach allowed in-depth discussion with the 629
informants on the meanings and placement of the mapped ES benefits. We observed this 630