SOCIAL INVESTMENT IN THE BALTIC STATES:
BENEFITS AGAINST POVERTY AND THE
DISTRIBUTION OF SOCIAL RISKS OVER THE LIFE COURSE
Daiva Skuciene, Romas Lazutka1
ABSTRACT Prevention against social risks through investment in human capital serves as the main focus of social investment. The social investment perspective suggests that social protection benefits should ensure adequate income maintenance over the life course. The goal of the current study is twofold: to analyze the role of social benefits that protect against poverty and to examine the distribution of social risks over the life course with a focus on social investment in the Baltic States, drawing on microdata from EU-SILC 2015. In addition, the study uses Eurostat data to explore spending on social protection and investment in human capital, classified as “Old” and “New” risks, during 2005-2014. The findings of the study suggest that low spending on social welfare in the Baltic States cannot adequately guarantee income for the population at risk, or reduce dependency on welfare state benefits.
KEYWORDS: social risks, social benefits, at-risk-of-poverty rate, social investment, Baltic States
INTRODUCTION
In 2013, the European Commission introduced a Social Investment Package which posits that the main focus of the social investment policy should be the prevention of social risks via combinations of benefits and services. This policy shift relates to a question addressed by many researchers. The relevant academic
1 Daiva Skuciene is reader, Romas Lazutka is professor at the Vilnius University, e-mails: daiva.
skuciene@fsf.vu.lt, romas.lazutka@fsf.vu.lt. The research was funded by a grant (No.Ger- 009/2017) from the Research Council of Lithuania.
literature explores the concept of social investment and its combination with active and passive welfare, patterns of spending on diverse types of welfare, and the relationship between the social investment paradigm and income inequality and poverty. This paper contributes to what is currently known about the capacity of compensatory welfare to protect against poverty by analyzing data from the Baltic States and explores the distribution of social risks over the life course with a focus on social investment. We hope that these findings will contribute to the comparative literature on welfare states. The three Baltic States have a similar history, hence feature similar stages of welfare state development.
It must be noted that the welfare states of the Baltics used to be classified as distinct post-socialist welfare state regimes (Aidukaitė, 2009).
Therefore, the goal of our study is twofold: to analyze the impact of social benefits on poverty reduction and to examine the distribution of social risks over the life course with a focus on social investment in the Baltic States.
To implement the goal, the following objectives were set: first, to look at the literature on social investment and its relationship with compensatory welfare over the life course; second, to analyze the impact of social benefits on poverty reduction over the life course; third, to explore the distribution of social risk events over the life course; and fourth, to analyze spending on social welfare over previous periods as ex-post investment in the Baltic States.
LITERATURE REVIEW
The social investment paradigm focuses on enhancing human capital in order to prevent future dependency on the welfare state and foster further participation in the labor market (Esping-Andersen, 2002; Bonoli, 2006; 2013; Hemerijck, 2017). According to Cooke and Gazso (2009), the main idea of social investment is to promote the shift from passive social protection to active welfare programs.
Activation refers to any policy that enhances the capabilities of citizens, as proposed by Esping-Andersen (2002). Esping-Andersen (2002) contends that activation encourages one to seek a job more actively, and activation begins in early childhood. Thus, early childhood learning is of primary importance (see Jenson and Saint-Martin, 2005; Jenson, 2010; Bonoli, 2013; Hemerijck, 2017). However, social investment requires learning to increase human capital at all life stages (Jenson, 2010; Bonoli, 2013; Hemerijck, 2017). Jenson and Saint-Martin (2005) state that investments generate dividends in the future, whereas consumption occurs in the present. Furthermore, Hemerijck (2017) defines social investment as serving “stock,” “flow,” and “buffer” functions.
The “stock” function of social investment strengthens people’s skills and capacities. The “flow” function helps to bridge critical life course transitions, from schooling to first job, etc., while income protection serves as a “buffer”
function of social investment; the “buffer” helps to compensate and mitigate social inequity at the micro level and provides the necessary financial security for people to develop their human capital. The same ideas were expressed by Nolan (2013), Pintelon et al. (2013), Kvist (2014), and Kuitto (2016). According to the former, although recently there has been a lot of focus on the development of human capital over the life course, analyses of social investment should include welfare programs which support consumption. In the words of Esping-Andersen (2002), adequate income maintenance is the first precondition for preventive or remedial strategies. And, according to Nolan (2013), investment cannot be understood without current consumption because investment primarily relates to the health of the future labor force. Farrington and Slater (2006) say that cash transfers not only have a consumption effect, but also an effect on demand for food, investment in health, and education. Indeed, social investment as a new welfare policy should combine greater labor market participation and adequate social protection (Pintelon et al., 2013). Kuitto (2016) notes that compensation and social investment policies should be complementary. Traditionally, social welfare has been based on the principles of investment and inclusion (Alcock, 2016), and the outcomes of implementation of such principles, as well as the generosity of social benefits, can be explained using socioeconomic, political, and institutional theories (Brown and Best, 2017). According to these theories, the generosity of welfare state benefits depends on economic conditions and levels of poverty and unemployment (Brown and Best, 2017), while political theories attribute greater generosity of social benefits to increases in the power concentration of left-wing political parties and unions (Brown and Best, 2017).
Institutional theory states that legislation defines the policy and structure or design of policies that influence output (Finlayson, 2007). Thus, institutions are arrangements of rules, and members of institutions behave in response to those basic components of institutional structures (Guy Peters, 2000). Importantly, transfers reflect institutional designs, but they are also shaped by a number of other factors (Jacques and Noël, 2018).
As a result of the multidimensional nature of policy inputs and the complex nature of policy outcomes, social investment is beset by problems with measurement. Since the main task of social investment is to enhance capabilities and the future prospects of human life, it remains unclear what constitutes its major achievements (Dheret and Fransen, 2017; Burgoon, 2017). Begg (2017) states that investment implies spending intended to generate a future return.
Kazepov and Ranci (2017) argue that social investment is a supply-side strategy
and should be related to labor market demand. If such a relationship is weak, social investment will be ineffective. Vandenbroucke (2017) contends that social investment does not readily translate into any operational concept that is applicable in empirical research. Thus, it is better to look at social investment as a policy that acknowledges a number of empirical difficulties, uncertainties and disagreements.
De Deken (2017) distinguishes three kinds of indicators of social investment output. The first kind focuses on changes in the employment performance of a country and is measured as the labor force participation rate. The second indicator, a set of output variables, measures social investment in terms of the reduction of poverty and inequality. The third includes variables that allow us to measure the effectiveness of social investment policies consisting of benefit caseloads. Social investment and traditional welfare rest on the life course perspective. Esping-Andersen (2002) places the focus on investment in children as the main condition for a good life. Childhood poverty is associated with a lower level of education and skills, and later in the life course translates into the low productivity of workers, and unemployment. Thus, the first precondition for the abolishment of childhood poverty is adequate income, while the second one is good access to pre-school and day care that helps develop proper cognitive abilities (Esping-Andersen, 2002). According to Kvist (2014), the generational perspective of social investment means that the welfare state smoothes out resources over the life course. Individuals who invest in other people also invest in themselves because they distribute resources at different points in time over the life course (Kvist, 2014). Moreover, educational attainment is a cumulative process of skill formation that unfolds over the life course (Di Stasio and Solga, 2017), and social policy has to respond to the different needs and circumstances of different age groups, primarily of children and older people (Alcock, 2016;
Klammer, 2004).
Fitzpatrick (2004) stresses the importance of life course policies which reduce poverty strategically by constructing institutional support that helps bridge sensitive periods. Bambra et al. (2010) note that the life course perspective highlights the importance of critical periods and can illuminate the role of public policies or the impact of social policy on the accumulation of disadvantage across the life course (see also Levecque, 2011). Last, Taylor-Gooby (2011) notes the importance of social security coverage over the life course and the benefits of redistribution, from better to worse, by the welfare state.
DATA AND METHOD
In the current study, we focus on the role of social benefits on poverty reduction in order to evaluate the “buffer” function of compensatory welfare over the life course (see Hemerijck, 2017). We drew on the literature on social investment and the idea that compensatory welfare remains an important part (as a social right) of the new policy which emphasizes investment in human capital.
Second, we explored the distribution of social risks over the life course. In this case, we followed the notion of De Deken (2017, as cited in Hemerijck, 2017), who states that “benefit caseload” serves as one possible outcome of social investment.
Third, we used the analysis of spending on welfare as an input variable (De Deken, 2017, as cited in Hemerijck, 2017) for an explanation of the outcome variables of compensatory measures of poverty reduction and the distribution of social risks over the life course. We followed evidence of positive outcomes from interventions in various domains of social investment (education, ALMP, etc.) (see Esping-Andersen, 2002; Bonoli, 2013; Dheret and Fransen, 2017).
In addition, we relied on the assumption that the distribution of social risks is related to ex-post social investment. This notwithstanding, the relationship between investment and the distribution of social risks is not clear because other factors can create risks.
Microdata from the EU-SILC 2015 were used for the evaluation of the role of social benefits on poverty reduction and the distribution of social risks over the life course (the data were obtained under an agreement between Vilnius University and the Eurostat Office).
The concept of life course was operationalized as spanning the age groups of 0-2 years, 3-6 years, 7-17 years, 18-24 years, 25-35 years, 36-45 years, 46-55 years, 56-65 years, 66-75 years and 76-100 years. The period of childhood was divided into age groups of less than ten years because our assumption was that social benefits during this period of life are unequally distributed and cannot ensure sustainable welfare for children.
Our analysis of social benefits for poverty reduction covered the whole life course, which is in line with the sequential approach. We started with the income package from market income and calculated the at-risk-of-poverty rate; then we added every type of social benefit to the income package, after which the at- risk-of-poverty rates and their reductions were calculated. This allowed us to establish the extent of poverty reduction for each benefit over the life course separately, and all benefits in total, as well as the at-risk-of-poverty rates after social benefits.
The distribution of social risks over the life course was calculated as a part of the social benefits received by the total number of persons in each group
over the life course. Finally, we evaluated spending on welfare in the Baltic States. For that purpose we used Vandenbroucke and Vleminckx’s (2011) framework of classification in order to differentiate compensatory (“Old”) and social investment (“New”) welfare. New risks include child care, education, parental leave, ALMP, elderly care, and healthcare, whereas Old risks include all spending on social protection benefits by type. Data on spending on New and Old social risks were evaluated in terms of GDP shares and based on the Eurostat data for 2005-2014. The data for each Baltic State were compared with EU27-level data in order to thoroughly analyze the trends and levels of spending according to each category.
The role of social benefits in poverty reduction in the Baltic States
The redistribution of resources and poverty reduction lie at the centre of compensatory welfare. Social investment recognizes poverty reduction as its main aim too, only this is achieved with the help of other tools: investment in education and skills over the life course that promote participation in the labor market. Thus, traditional welfare should ensure an adequate minimal income because cognitive inequalities are strongly correlated with poverty and income inequalities (Esping-Andersen, 2002). On the other hand, adequate income allows for the improvement of skills for the return to the labor market during other risky events over the life course and ensures “flows” (Hemerijck, 2017).
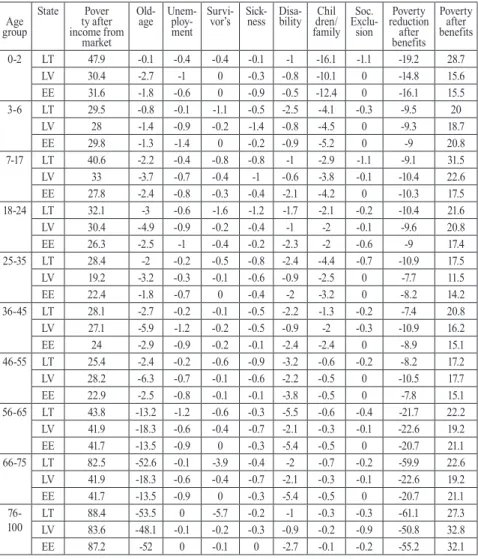
Data in Table 1 show that social benefits have the largest impact on poverty reduction at the beginning and end of the life course. However, while child or family benefits have a higher impact on poverty reduction at the first stage of life (0-2 years), later on (starting from age 3 and up to age 18) the impact of such benefits decreases by half. The reason for this is that parental leave benefit, which is relatively generous in the Baltic States, is attached solely to the former life stage (0-2 years).
The generous and relatively long parental leave in the Baltic States can be evaluated both positively and negatively from the social investment perspective.
Negatively, because the interruption of the careers of mothers is quite long, and from the point of view of activation policy, it is too generous – more optimal would be a 12-month parental leave (Bonoli, 2013). However, the current design of parental leave is favorable from the children’s perspective: the mother can invest all her time into early care and the human capital of her baby when she/
he is too young to participate in institutional education. Overall, the generosity of the benefit ensures income adequacy for children. Yet, despite the generous
parental leave, the at-risk-of-poverty rate remains high in Lithuania after social benefits: it affects about one-third of children aged 0-2 years (see Table 1). This may be related to insufficient coverage of social insurance and parents not being entitled to parental leave (see Table 2). If we look at the childhood period of up to 18 years, the poverty rate indicators after social benefits in all the Baltic States are high, especially in Lithuania (see Table 1). The main social policy means that, for that life stage, child benefit is awarded, though means-tested benefits could be available for families and unemployment benefits for parents in cases of social risk. In 2015, the rules for providing child benefit differed in the Baltic States: Lithuania had a means-tested child benefit, while in Estonia and Latvia it was universal. Despite that difference, we did not observe any notable differences in the impact of that benefit on poverty reduction for individuals of up to age 18 in all the Baltic States (see Table 1). The main source of difference in poverty rates after social benefits during childhood in all the Baltic States is due to the at-risk-of-poverty rate of market income (see Table 1). This requires further analysis of the distribution equality of wages and other market incomes.
The poverty rate after social benefits during childhood was highest in Lithuania compared with the other two Baltic States.
The life stage of transition to the labor market, family creation, and further studies (18-24 years) is also associated with about one-fifth of the population at risk of poverty after social benefits (see Table 1). A similar rate of poverty after social benefits was observed continuously in all the working-age brackets of the Baltic populations. Starting from 56-65 years, the old-age pension starts playing a major role in poverty reduction (see Table 1). A part of the population in the 56-65 age group is retired. Despite the greater reduction of poverty due to old-age pensions, more than one-fifth of the population remains at risk of poverty. This could be related to unemployment before the retirement age, or the insufficiency of old-age pensions. An extremely high at-risk-of-poverty rate was observed for the oldest population group (76-100 years) because this group mostly relies on old-age pensions and has no other source of income. The at- risk-of-poverty rate in relation to market income had nearly reached 90% for the oldest population in the Baltics (see Table 1).
The indicators of poverty are even worse if we look at individual groups by their status. In 2015, an extremely high at-risk-of-poverty rate was observed among the unemployed in the Baltic States: 54.8% in EE, 54.9% in LV, and 62.3% in LT. The at-risk-of-poverty rate of the disabled was 24.7% in EE, 31%
in LV and 29.1% in LT. Finally, the same indicator for retirees was 42% in EE, 32.9% in LV, and 35.6% in LT (source: Eurostat).
These findings suggest that the population in the Baltic States that experiences social risks over the life course does not have an adequate income guarantee,
which is a main prerequisite for social investment. Even in childhood about one-fifth of the population are at risk of poverty. This means that this part of the population is likely to move through the life course with cumulative disadvantages up to retirement, and this will be associated with higher unemployment costs, probably poorer health, and greater demand for long-term care after retirement.
Table 1. At-risk-of-poverty rate reduction after different types of social benefits in the Baltic States, 2015 (%)
groupAge
State Pover ty after income from
market
Old-age Unem- ploy- ment
Survi- vor’s Sick-
ness Disa- bility Chil
dren/
family Exclu-Soc.
sion
Poverty reduction after benefits
Poverty after benefits
0-2 LT 47.9 -0.1 -0.4 -0.4 -0.1 -1 -16.1 -1.1 -19.2 28.7
LV 30.4 -2.7 -1 0 -0.3 -0.8 -10.1 0 -14.8 15.6
EE 31.6 -1.8 -0.6 0 -0.9 -0.5 -12.4 0 -16.1 15.5
3-6 LT 29.5 -0.8 -0.1 -1.1 -0.5 -2.5 -4.1 -0.3 -9.5 20
LV 28 -1.4 -0.9 -0.2 -1.4 -0.8 -4.5 0 -9.3 18.7
EE 29.8 -1.3 -1.4 0 -0.2 -0.9 -5.2 0 -9 20.8
7-17 LT 40.6 -2.2 -0.4 -0.8 -0.8 -1 -2.9 -1.1 -9.1 31.5
LV 33 -3.7 -0.7 -0.4 -1 -0.6 -3.8 -0.1 -10.4 22.6
EE 27.8 -2.4 -0.8 -0.3 -0.4 -2.1 -4.2 0 -10.3 17.5
18-24 LT 32.1 -3 -0.6 -1.6 -1.2 -1.7 -2.1 -0.2 -10.4 21.6
LV 30.4 -4.9 -0.9 -0.2 -0.4 -1 -2 -0.1 -9.6 20.8
EE 26.3 -2.5 -1 -0.4 -0.2 -2.3 -2 -0.6 -9 17.4
25-35 LT 28.4 -2 -0.2 -0.5 -0.8 -2.4 -4.4 -0.7 -10.9 17.5
LV 19.2 -3.2 -0.3 -0.1 -0.6 -0.9 -2.5 0 -7.7 11.5
EE 22.4 -1.8 -0.7 0 -0.4 -2 -3.2 0 -8.2 14.2
36-45 LT 28.1 -2.7 -0.2 -0.1 -0.5 -2.2 -1.3 -0.2 -7.4 20.8
LV 27.1 -5.9 -1.2 -0.2 -0.5 -0.9 -2 -0.3 -10.9 16.2
EE 24 -2.9 -0.9 -0.2 -0.1 -2.4 -2.4 0 -8.9 15.1
46-55 LT 25.4 -2.4 -0.2 -0.6 -0.9 -3.2 -0.6 -0.2 -8.2 17.2
LV 28.2 -6.3 -0.7 -0.1 -0.6 -2.2 -0.5 0 -10.5 17.7
EE 22.9 -2.5 -0.8 -0.1 -0.1 -3.8 -0.5 0 -7.8 15.1
56-65 LT 43.8 -13.2 -1.2 -0.6 -0.3 -5.5 -0.6 -0.4 -21.7 22.2
LV 41.9 -18.3 -0.6 -0.4 -0.7 -2.1 -0.3 -0.1 -22.6 19.2
EE 41.7 -13.5 -0.9 0 -0.3 -5.4 -0.5 0 -20.7 21.1
66-75 LT 82.5 -52.6 -0.1 -3.9 -0.4 -2 -0.7 -0.2 -59.9 22.6
LV 41.9 -18.3 -0.6 -0.4 -0.7 -2.1 -0.3 -0.1 -22.6 19.2
EE 41.7 -13.5 -0.9 0 -0.3 -5.4 -0.5 0 -20.7 21.1
76-100 LT 88.4 -53.5 0 -5.7 -0.2 -1 -0.3 -0.3 -61.1 27.3
LV 83.6 -48.1 -0.1 -0.2 -0.3 -0.9 -0.2 -0.9 -50.8 32.8
EE 87.2 -52 0 -0.1 0 -2.7 -0.1 -0.2 -55.2 32.1
Note: Calculations performed by the author.
Distribution of social risks over the life course
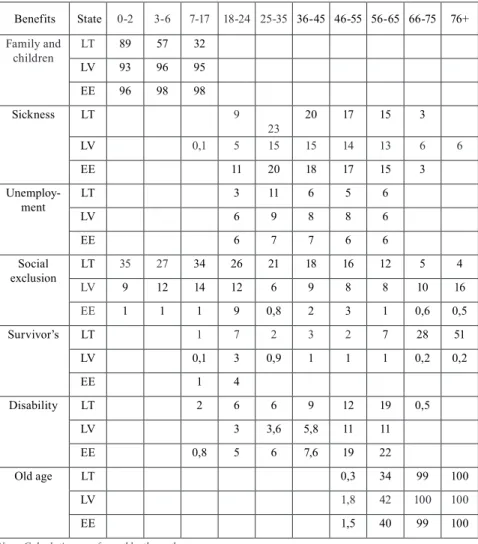
The preventive function of social investment requires a return to low level dependency upon the welfare state. The number of recipients of social benefits in the Baltic States in 2015 provides a cross-sectional view of dependency over the life course in the Baltic States and returns from ex-post investment.
Table 2. Recipients of social benefits over the life course (%), 2015
Benefits State 0-2 3-6 7-17 18-24 25-35 36-45 46-55 56-65 66-75 76+
Family and
children LT 89 57 32
LV 93 96 95
EE 96 98 98
Sickness LT 9
23 20 17 15 3
LV 0,1 5 15 15 14 13 6 6
EE 11 20 18 17 15 3
Unemploy-
ment LT 3 11 6 5 6
LV 6 9 8 8 6
EE 6 7 7 6 6
Social
exclusion LT 35 27 34 26 21 18 16 12 5 4
LV 9 12 14 12 6 9 8 8 10 16
EE 1 1 1 9 0,8 2 3 1 0,6 0,5
Survivor’s LT 1 7 2 3 2 7 28 51
LV 0,1 3 0,9 1 1 1 0,2 0,2
EE 1 4
Disability LT 2 6 6 9 12 19 0,5
LV 3 3,6 5,8 11 11
EE 0,8 5 6 7,6 19 22
Old age LT 0,3 34 99 100
LV 1,8 42 100 100
EE 1,5 40 99 100
Note: Calculations performed by the author.
The majority of beneficiaries receive social benefits at the beginning of life (0-2 years). The number of recipients of family/child benefits decreased in the age group 3-6 compared to the previous age group (in Lithuania the figure was 24%, in Latvia 32%, and in Estonia 36%) (see Table 2). The smallest increase in the number of family/child beneficiaries was found in Lithuania because in this country child benefits are means tested. The number of recipients of family/
child benefit in the age group 7-17 may be associated with the universal nature of this benefit in Latvia and Estonia, while in Lithuania it is means tested. Also, the insufficient income of families in the Baltic States may be the reason why the number of social exclusion beneficiaries increased almost threefold in the Baltic States in the age group 7-17 and decreased in the age group 18-24 in Lithuania and Latvia, but increased in Estonia (see Table 2).
At the beginning of the working career, the number of recipients of unemployment benefits in the age group 25-35 increased by 4.7 times in Lithuania, 3.4 times in Latvia, and 2.4 times in Estonia compared with the previous age group. The greater proportion of unemployed among younger employees in Lithuania compared with the other two Baltic States could be due to social investment ex post and the incompatibility of supply and demand between the system of education and the labor market, etc.
The number of sickness benefit recipients in the same age group increased 3.5 times in Lithuania, 6 times in Latvia, and 3.7 times in Estonia (see Table 2). The number of sickness benefit recipients in this 25-35 age group may be associated with the nursing of sick children.
The 36-45 age group saw a slight increase in the number of survivor’s benefit recipients (see Table 2), and the number of disability benefit recipients in this age group increased by 3% in Lithuania and by about 1% in Latvia and Estonia.
A sharp increase in the number of disability benefit recipients is seen in the age group 46-55 in all the Baltic States: the number of disability benefit recipients increased by 55% in Lithuania, 99% in Latvia, and 2.2 times in Estonia compared with the former age group (see Table 2). From the social investment perspective, this may be due to ex-post insufficient investment in health care.
It is important to note that creating a healthy labor force is the main objective of current economics and ageing societies, permitting less dependency on the welfare state.
In the age group 56-65, continued growth in the number of disability benefit recipients was observed in Lithuania and Estonia (a 28% increase in Lithuania and a 16% increase in Estonia, see Table 2). This age group 56-65 includes some recipients of old-age pensions because the retirement age in the Baltic States is currently less than 65 years. The legal retirement age is gradually increasing in all the Baltic States, and will reach 65 years in 2025-2026.
Mention must be made of the fact that, in Estonia, the number of recipients of unemployment benefits in the age group 56-65 slightly increased compared to in the former age group (see Table 2). The age group 66-75 predominantly consists of regular old-age-pension beneficiaries.
Expenditure of the Baltic welfare states
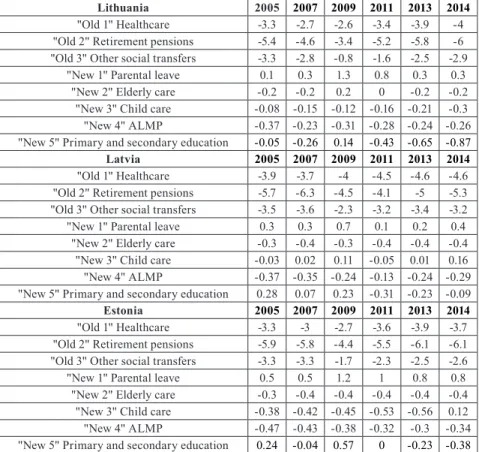
From the social investment perspective, expenditure on health should ensure a healthy labor force. Expenditure on health in the Baltic States was almost half of that of the EU (see Table 3). In 2005-2014, Estonia spent the most on health care among all the Baltic States, and Latvia the least. The highest number of recipients of disability benefits could be found in the age group 56-65 in Estonia and Lithuania and in the age group 46-55 in Latvia.
A sharp increase in disability in middle working age may be associated with insufficient investment into health care in the past. Importantly, an institutional analysis of health care could reveal the preventive health care interventions in the Baltic States that are needed to avoid greater disability later in working life.
Expenditure on parental leave in all the Baltic States was higher than the EU27 average (see Table 3). Spending on parental leave was lowest in Lithuania and highest in Estonia. However, during the last nine years, the other two kinds of spending on child care (“New 3”) and education (“New 5”) were lower in all the Baltic States than in the EU27. This could be interpreted negatively from the social investment perspective, but only in the cases of Lithuania and Latvia, since in 2015 Estonian students fared better in their studies than the OECD average (source: PISA data).
Expenditure on ALMP was lower in all the Baltic States compared with the EU27 average, too (see Table 3). The number of unemployment beneficiaries in 2015 was quite high in all the Baltic States (see Table 2), albeit this was a period of intensive economic growth. Low social insurance protection against unemployment and weak investment in activation are two possible reasons for the massive emigration from Lithuania and Latvia.
The amount of spending on retirement protection, both “Old 2” and “New 2,”
very clearly illustrates why the risk of poverty for retirees in the Baltic States is so high (see Table 3). Spending on old-age pensions is almost half that of the EU27 average, while spending on elderly care differs only insignificantly.
It must be noted that Lithuania has a special allowance for elderly care, thus expenditure is not so much less than the EU average.
Table 3. Expenditure on “Old” and “New” social risks as % of GDP and comparisons with EU27 (- lower, + higher)
Lithuania 2005 2007 2009 2011 2013 2014
"Old 1" Healthcare -3.3 -2.7 -2.6 -3.4 -3.9 -4
"Old 2" Retirement pensions -5.4 -4.6 -3.4 -5.2 -5.8 -6
"Old 3" Other social transfers -3.3 -2.8 -0.8 -1.6 -2.5 -2.9
"New 1" Parental leave 0.1 0.3 1.3 0.8 0.3 0.3
"New 2" Elderly care -0.2 -0.2 0.2 0 -0.2 -0.2
"New 3" Child care -0.08 -0.15 -0.12 -0.16 -0.21 -0.3
"New 4" ALMP -0.37 -0.23 -0.31 -0.28 -0.24 -0.26
"New 5" Primary and secondary education -0.05 -0.26 0.14 -0.43 -0.65 -0.87
Latvia 2005 2007 2009 2011 2013 2014
"Old 1" Healthcare -3.9 -3.7 -4 -4.5 -4.6 -4.6
"Old 2" Retirement pensions -5.7 -6.3 -4.5 -4.1 -5 -5.3
"Old 3" Other social transfers -3.5 -3.6 -2.3 -3.2 -3.4 -3.2
"New 1" Parental leave 0.3 0.3 0.7 0.1 0.2 0.4
"New 2" Elderly care -0.3 -0.4 -0.3 -0.4 -0.4 -0.4
"New 3" Child care -0.03 0.02 0.11 -0.05 0.01 0.16
"New 4" ALMP -0.37 -0.35 -0.24 -0.13 -0.24 -0.29
"New 5" Primary and secondary education 0.28 0.07 0.23 -0.31 -0.23 -0.09
Estonia 2005 2007 2009 2011 2013 2014
"Old 1" Healthcare -3.3 -3 -2.7 -3.6 -3.9 -3.7
"Old 2" Retirement pensions -5.9 -5.8 -4.4 -5.5 -6.1 -6.1
"Old 3" Other social transfers -3.3 -3.3 -1.7 -2.3 -2.5 -2.6
"New 1" Parental leave 0.5 0.5 1.2 1 0.8 0.8
"New 2" Elderly care -0.3 -0.4 -0.4 -0.4 -0.4 -0.4
"New 3" Child care -0.38 -0.42 -0.45 -0.53 -0.56 0.12
"New 4" ALMP -0.47 -0.43 -0.38 -0.32 -0.3 -0.34
"New 5" Primary and secondary education 0.24 -0.04 0.57 0 -0.23 -0.38 Note: Calculations performed by the author.
CONCLUSIONS AND DISCUSSION
The social investment perspective focuses on the prevention of social risks through investment in people’s skills and abilities. Investment should ensure participation in the labor market and society. On the other hand, social investment calls for adequate and sustainable social protection and the integration of benefits and services.
Low spending on social welfare in the Baltic States cannot adequately guarantee income or financial security for the population at risk, i.e., for those
in-between jobs (Hemerijck, 2017), and fails to promote a “flow” to more prosperous economic sectors or better life chances for children living in poverty, or lessen dependency on welfare state benefits.
The greatest reduction of poverty using social benefits was observed during inactive periods of the life course: childhood, and retirement. Having received social benefits as a main means of poverty reduction (Esping-Andersen, 2002), about one-fifth of children continue to live in poverty until their adult years in the Baltic States. The inadequacy of income maintenance in the Baltic States is accompanied with lower-than-EU-average expenditure on education and health. This may be associated with an increase in the unemployment rate of individuals of younger working age. The fluctuation in poverty rates after social benefits for up to one-fifth of the population in the Baltic States may be due to less ex-post social investment in education, or inadequate investment in ALMP, while the significant increase in disability at a later stage of working age may be due to insufficient ex-post investment in health.
The findings about the impact of old-age pensions on poverty reduction among retirees in the Baltic States oppose the explanation of retirement suggested by Myles (2002, as cited in Esping- Andersen, 2002). Myles (2002) defined retirement as an extended period of labor-force exit driven by wealth which makes work unnecessary. Old-age pensions in the three Baltic States fail to sufficiently ensure a smooth transition from the labor market and intergenerational equity, since more than one-third of retirees live in poverty. The lower funding for long- term care and health than the EU average suggests that life after retirement in these three countries is plagued by high dependency on welfare state services.
The current trend of spending on social welfare may be associated with the ex-ante level of social risks over life course, not with less dependency on welfare state benefits.
The link between social investment and the increase in number of recipients of social benefits is but one of many pertinent questions to address. The current study does not evaluate how the observed trends are influenced by the socioeconomic context, the demands of the labor market, public finance capacities, individual factors, features of education, health care, the active labor market, and elderly care or personal choices. Further research into trends in social investment could include these factors to explore their link with the distribution of recipients of social benefits over the life course.
We arbitrarily attributed parental leave benefits to compensatory welfare at the beginning of life (0-2 years), drawing on the assumption that these benefits serve as investments into the physical development of children and human capital. If parental leave benefits were attributed to parents, the scope of compensatory welfare would be different.
Future studies might explore the institutional design of each sector in order to observe its impact on different outcomes of social investment in education, health, ALMP, etc.
REFERENCES
Aidukaitė, Jolanta (2009), “The welfare system of Lithuania”, in: Schubert,Klaus, Hegelich, simo and Bazant, Ursula, ed., The Handbook of European Welfare Systems, Routledge, Taylor& Francis Group, pp.294-310.
Alcock, Pete (2016), Why we need welfare, Policy Press.
Armingeon, Klaus and Bonoli, Giuliano (2006), The politics of post-industrial welfare states. Adapting post-war social policies to new social risks.
Routledge: Taylor & Francis Group.
At-risk-of-poverty rate by poverty threshold and most frequent activity in the previous year - EU-SILC survey [ilc_li04]. Accessed 01 September 2017: http://appsso.eurostat.ec.europa.eu/nui/show.do?dataset=ilc_
li04&lang=.
Average scores of 15-year-old students on the PISA science literacy scale, by education system: 2015. Accessed 01 September 2017: https://nces.ed.gov/
surveys/pisa/pisa2015/pisa2015highlights_3.asp.
Bambra, Clare, Netuveli, Gopalakrishnan and Eikemo, Terje A. (2010), “ Welfare state regime life courses: the development of western European welfare state regimes and age related patterns of educational inequalities in self-reported health”, International Journal of Health Services Vol. 40, Nor 3, pp.399–420.
https://doi: 10.2190/HS.40.3.
Bonoli, Giuliano (2013), The origins of active social policy. Oxford: University Press.
Brown, Hana E. and Kahn Best, Rachel (2017), “Logics of Redistribution:
Determinants of Generosity in Three U.S. Social Welfare Programs”, Sociological Perspectives Vol. 60, No 4, pp.786–809. https://doi: 10.1177/0731 121416656843.887177392
Cooke, Martin and Gazso, Amber (2009), “Taking a Life Course Perspective on Social assistance use in Canada: a different approach”, Canadian Journal of Sociology Vol.34, No 2, pp.349-372.
Dheret, Claire and Fransen, Lieve (2017), “Social investment first! A precondition for a modern Social Europe”, ISSUE Paper No.82, March 2017. Accessed 2 September 2017: http://www.epc.eu/documents/uploads/
pub_7468_socialinvestmentfirst.pdf.
Di Stasio, Valentina and Solga, Heige (2017), “Education as social policy: An introduction”, Journal of European Social Policy Vol. 27, No 4, pp.313–319.
https://doi.10.1177/0958928717728712
Esping- Andersen, Gosta with Gallie, Duncan, Hemerijck, Anton and Myles, John. (2002), Why we need a new welfare state. Oxford University Press.
Farrington, John and Slater, Rachel (2006), “Introduction: Cash Transfers:
Panacea for Poverty Reduction or Money Down the Drain?”, Development Policy Review Vol. 24, No 5, pp.499–511. https://onlinelibrary.wiley.com/doi/
pdf/10.1111/j.1467-7679.2006.00344.
Finlayson, Alan (2007), “From Beliefs to arguments: interpretive methodology and rhetorical political analysis”, BJPIR Vol.9(4), pp.545-563. https://
onlinelibrary.wiley.com/doi/abs/10.1111/j.1467-856X.2007.00269.
Fitzpatrick T. (2004) Social policy and time. Time & Society, Vol. 13 No. 2-3, pp.197–219. https://doi: 10.1177/0961463X04043502.
Guy Peters, B.(2000), “Institutional theory: problems and prospects”. Political Science Series 69. Accessed 05 May 2016: https://www.ihs.ac.at/publications/
pol/pw_69.pdf.
Hemerijck, Anton (2017), The uses of social investment. Oxford: University Press.
Jacques, Olivier and Noël, Alain (2018), “The case for welfare state universalism, or the lasting relevance of the paradox of redistribution”, Journal of European Social Policy Vol. 28, No 1, pp.70– 85. https://doi.
org/10.1177/0958928717700564.
Jenson, Jane (2010), “Diffusing ideas for after-neoliberalism: the social investment perspective in Europe and Latin America”, Global Social Policy Vol.10, No1, pp.59-84. https://doi.10.1177/1468018109354813.
Jenson, Jane and Saint- Martin, Denis (2006), “Building blocks for a new social architecture: the LEGO paradigm of an active society”, Accessed on 15 September 2017: http://www.cccg.umontreal.ca/pdf/Jenson%20 and%20SaintMartin-Policy%20and%20Politics%203.pdf. https://doi.
org/10.1177/09589287177287 ttps://doi.org/10.1177/09589287177287 ttps://doi.
org/10.1177/09589287177287 https://doi.org/10.1177/09589287177287 https://
doi.org/10.1177/09589287177287
Klammer, Ute (2004), “Flexicurity in a life-course perspective”, TRANSFER:
European Review of Labour and Research Vol.10, No 2, pp. 282–299. https://
doi.10.1177/102425890401000210
Kuitto, Kati (2016), “From social security to social investment? Compensating and social investment welfare policies in a life-course perspective”, Journal of European Social Policy Vol. 26. No. 5, pp.442 – 459. http://
doi.10.1177/0958928716664297.
Kvist, Jon (2014), “Framework for social investment strategies: Integrating generational, life course and gender perspectives in the EU social investment strategy”, Comparative European Politics Vol. 13, No. 1, pp.131-149. http://
doi.10.1057/978-1-137-58179-2_3.
Levecque, Katia, Van Rossem, Ronan, De Boyser, Katrien, Van de Velde, Sarah, and Bracke, Piet (2011), “Economic Hardship and Depression across the Life Course: The Impact of Welfare State Regimes”, Journal of Health and Social Behavior Vol.52, No 2, pp.262–276. https:// doi:
10.1177/0022146510394861.
Nolan, Brian (2013), “What use is ‘social investment?’”, Journal of European Social Policy Vol.23, No 5, pp. 459–468. https://doi.10.1177/0958928713499177 People at risk of poverty or social exclusion by level of activity limitation, sex
and age[hlth_dpe010]. Accessed 01 September 2017: http://appsso.eurostat.
ec.europa.eu/nui/show.do?dataset=hlth_dpe010&lang=en
Pintelon, Olivier, Cantillon, Bea, Van den Bosch, Karel and Whelan, Christopher (2013), “The social stratification of social risks: the relevance of class for social investment strategies”, Journal of European Social Policy Vol.23, No.1, pp.52–67. https://doi.10.1177/0958928712463156.
Taylor-Gooby, Peter (2011), “Security, equality and opportunity: attitudes and the sustainability of social protection”, Journal of European Social Policy Vol. 19, No 5, pp.150–14. https://doi:10.1177/0958928709.
Vandenbroucke, Frank and Vleminckx, Koen (2011), “Disappointing poverty trends: is the social investment sate to blame?”, Journal of European Social Policy Vol. 21(5), pp.450–471. http://doi: 10.1177/0958928711418857.