LIFE INSURANCE
• •
4tjt
Banyár, József
BUDAPESTI
CORVINUS EGYETEM
COVERAGE
Life insurance
A Budapesti Corvinus Egyetem és a Magyar Nemzeti Bank együttműködési megállapodása keretében támogatott mű.
ISBN 978-963-503-878-7 ISBN 978-963-503-879-4
DOI: 10.14267/978-963-503-879-4
Kiadó: Budapesti Corvinus Egyetem Nyomdai kivitelezés: CC Printing Kft.
1. Basics of Demography ... 12
Key Words ...12
1.1. Total Population ...12
1.2. Composition of the Population by Age and Gender ...14
1.3. Life Expectancy, Probability of Death ...18
1.4. The Analysis of the Life Table ...28
1.5. Statuses: Marital, Health, Economic ...29
2. The Individual Life Cycle ... 32
Key Words ...32
2.1. Foresight ...32
2.2. The Human Life Cycle Throughout History ...35
2.3. Life Planning and Wealth...37
2.4. Variations of the Life Cycle ...39
2.5. The Cash Flow of the Life Cycle ...41
2.6. The Structure of Cash Flow During the Life Cycle ...45
2.7. Risks Threatening the Cash Flow andthe Methods of Defence...49
3. Basics of Insurance ... 60
Key Words ...60
3.1. Safety ...60
3.2. Methods of risk management ...62
3.2.1. Risk avoidance ...63
3.2.2. Loss prevention ...63
3.2.3. Self-insurance ...64
3.2.3.1. Reserving ...64
3.2.3.2. Risk spreading, internal risk equalization ...65
3.3. The risk community ...65
3.4. Loss sharing ...67
3.5. Risk sharing ...68
3.6. Classification of insurance ...71
3.6.1. Classification of insurance based on the subject of insurance ...71
3.6.3. Classification of insurance based on provisioning ...74
3.7. Risk spreading ...75
3.8. Types of insurance companies ...76
3.9. Social security ...78
3.9.1. Personal insurance and social security ...78
3.9.2. State health insurance ...80
3.9.3. State pension ...82
3.10. The psychology and microeconomics of insurance ...84
II. The study of Life Insurance Products ... 89
4. The Role, Concept and Main Types of Life Insurance ... 90
Key Words ...90
4.1. Financial Needs ...91
4.2. The Relation of Life Insurance with Other Insurances, the Nature of Life Insurance Risk, The Characters of a Life Insurance Contract ...93
4.3. Introducing the Most Important Life Insurances...99
4.3.1. Term Insurance ...99
4.3.2. Pure Endowment Insurance ...101
4.3.3. Endowment Insurance ...102
4.3.9. Complementary Risks – Insurance Riders ...116
5. Categorisation of Life Insurance... 121
Key Words ...121
5.1. Usual Classification of Life Insurances ...121
5.1.1. Categorisation of Life Insurance in the Hungarian Literature...121
5.1.2. Life Insurance Classification in the English Literature ...124
5.1.3. General Features of the Categorisations ...127
5.2. Practical Classification of Life Insurance by Different Aspects ...127
5.2.1. From the Aspect of the Historical Order of Development – Traditional and Modern Life Insurances ...128
5.2.2. By the Logic of the Internal Structure, and the Type of Benefit ...129
5.2.3. From the Administrative and Legal Aspect – Main Policies and Riders ...129
5.2.4. By the Relation of the Status of the Policyholder and the Insured – Individual and Group Insurance ...130
5.2.5. By the Number of Insured Persons – Single Life or Joint Life Insurance ...132
5.2.6. By Premium Term and Premium Frequency ...132
6. Comparing Modern and Traditional Life Insurances ... 133
6.1. Modern Life Insurance in General ...133
6.2. Life Insurance Before the Appearance of Unit Linked ...134
6.3. The Development and Circumstances of Development of Unit Linked Insurance ...135
6.4. Similarities with Endowment Insurance – Definition Arguments ...137
6.5. Major Changes Brought by Unit Linked Insurance ...140
6.5.1. Changes Regarding the Client ...140
6.5.2. Changes in the Relationship of the Insurer and the Client ...142
6.5.3. Changes in Insurance Technique ...144
6.5.4. Expected Further Changes ...147
7. Comparing life insurances to each other and to substitutes from other financial sectors ... 149
Kew Words ...149
7.1. Choice amongst life insurances with different purposes ...149
7.2. Comparing life insurances to each other ...150
7.2.1.Comparing Benefits – the potential grievances of the costumers ...150
7.2.2. Differentiating Among Customers ...151
7.3. Comparing life insurances and other savings instruments ...154
8. Theoretical Construction of Life Insurance ... 156
Key Words ...156
8.1. The Most Important Elements of Life Insurance ...156
8.2. The Construction of Traditional and Modern Life Insurance ...159
III. The technique of life insurance products ... 161
9. The Premium of Life Insurance ... 162
Kew Words ...162
9.1. Parts of the Premium ...162
9.2. Premium Calculation...163
10. The Premium Calculation of Life Insurance ... 167
10.1. The Single net Premiums of Single Premium Insurances ...168
10.1.1. The Single Net Premium of Term Insurance ...168
10.1.3. Single net premium of special insurances („staged” term, term fix, pure endowment with premium refund) ...173
10.2.4. Certain annuities ...184
10.2.5. Annuity with Guarantee Period ...185
10.2.6. The Premium of Joint Life Annuities ...188
10.2.7. The Premium of Annuities in p Payments Yearly ...190
10.2.8. Some Special Annuities ...193
10.3. The Net Premium of Regular Premium Payment Insurance ...194
10.3.1. The Regular Net Premium of the Single Life Insurances ...196
10.3.2. Regular net premiums of joint life insurances ...198
10.4. Calculation of Gross Premiums ...198
10.4.1. The Gross Premium of Single and Regular Premium Insurances ...199
10.4.2. The Difference Between Premiums Calculated for Annual and Monthly Premium Payment ...200
10.4.3. A special case: the gross regular premium of the pure endowment with premium refund ...202
10.4.4. „Ideological” reasons and implications ...208
10.4.4.1. Single premium version ...208
10.4.4.2. Regular premium version ...209
10.5. The net premiums on another way – connections between single premiums ...211
10.6. The net premiums on another way – regular premiums ...221
11. The Premium Reserve ... 226
Kew Words ...226
11.1. The Premium Reserve of the Term Insurance ...227
11.2. Premium Reserve of Pure Endowment and Endowment Insurance...232
11.3. Zillmerization and Other Problems ...235
11.4. Non-forfeiture Options and Policy Loan ...237
11.4.1. The Types of Non-forfeiture Options ...237
11.4.2. Limiting Non-forfeiture Options ...239
12. Calculation of the Premium Reserve ... 241
12.1. The Calculation of the Premium Reserve Generally ...241
12.2. The Calculation of the Annual Prospective Premium Reserve ...244
12.3. The Retrospective Premium Reserve Formulae ...246
12.3.1. The Change of the Premium Reserve of Single Premium Insurances ...247
12.5. The Calculation of Mid-year Premium Reserve ...253
12.6. A negative Premium Reserve ...254
12.7. Cash Flows in Unit Linked Insurance ...260
13. Zillmerization ...264
13.1. Zillmerization – in the Conservative View ...265
13.2. Zillmerization Today, illetve a zillmerezés értelmezése ...272
14. Possible Methods of Handling Inflation ... 275
Key Words ...275
14.1. Premium Increase ...276
14.2. Investment Profit Sharing ...277
14.3. The Technique of Revalorization ...278
15. The Calculation of Inflation Premium Increase and Investment Profit Sharing ... 281
15.1. Premium Increase Independent of Profit Sharing ...281
15.2. Profit Sharing Independent of Premium Increase ...282
15.3. Integrated Premium Increase and Investment Profit Sharing System – the Technique of Revalorization ...285
16.2.2. The Problem...296
16.2.3. Spreading of expenses ...297
16.2.4. The Effect of Reinsurance on the Premium...301
IV. Questions Regarding The Life Insurance Industry ... 303
17. Some Problems of THe Life Insurance Industry ...304
Key Words ...304
17.1. Some Problems of Founding a Life Insurance Company ...304
17.2. Some Problems Arising in the Course of Company Operation ...306
17.2.1. Product Development, New Policies ...306
17.2.2. The Safety of the Insurance Company ...308
17.3. The Sale of Life Insurance, Sales Channels ...310
17.4. Sales Through the Insurer’s Own Agent Network ...313
17.4.1. Network Organisation and Management ...313
17.4.2. Commission System, Commission Regulation ...314
17.4.3. Recruitment ...317
17.5. Technical Duties Regarding the Signing and the Administration of a Life Insurance Policy ....318
17.5.1. The Insurance Application...318
17.5.2. Policy Administration...320
17.5.3. Underwriting, policy issuance ...320
17.5.4. Indexation, Indexation Letter ...324
17.5.5. Claims Handling – Making Use of Non-forfeiture Options, Insured Event, Maturity, Benefit Payment ...325
17.6. The Profit of the Life Insurance Company ...325
18. Technical Income Statement ... 329
Key Words ...329
18.1. The Technical Income Statement in General ...329
18.2. The Path of the Money Collected During the Year ...330
18.3. The Path of Money Already at the Insurer at the Beginning of the Year ...334
18.4. Calculating the Factors of Profit ...335
18.4.1. Expense Profit, Income Correction ...335
18.4.2. Mortality (risk) profit ...336
18.4.3. Surrender Profit ...337
18.4.4. Investment Profit ...338
18.5. Calculating the Mortality Profit ...338
18.5.1. Mortality Profit of Insurances With Single Premium ...338
18.5.2. Mortality Profit of Insurances With Regular Premium Payment ...341
18.5.3. Deviation from the Standard Mortality Table ...342
18.5.4. A Detour: What is the Benefit of the Term Fix Insurance? ...343
18.6. Embedded Value ...345
19. The Actors and Rivals of the Life Insurance Market and its Significance in the National Economy ... 347
Key Words ...347
19.1. The Actors of the Life Insurance Market ...347
19.2. The Connection Between Life Insurance and the Social Security System and Benefits ...349
19.3. The Effect of Life Insurance on the National Economy ...355
Appendix ... 357
Literature ...377
Figure 1.3.: Traditional pyramid-shaped age structure (age pyramid) ...16
Figure 1.4.: The predicted population of Botswana in 2020 with AIDS and without ...17
Figure 1.5.: The Hungarian male death probabilities in 1949, 1969, 1989 and 2009 in different segments and in different comparisons ...20
Table 1.1.: The values of the Hungarian Infant mortality (for both gender together) for 1000 babies born alive ...20
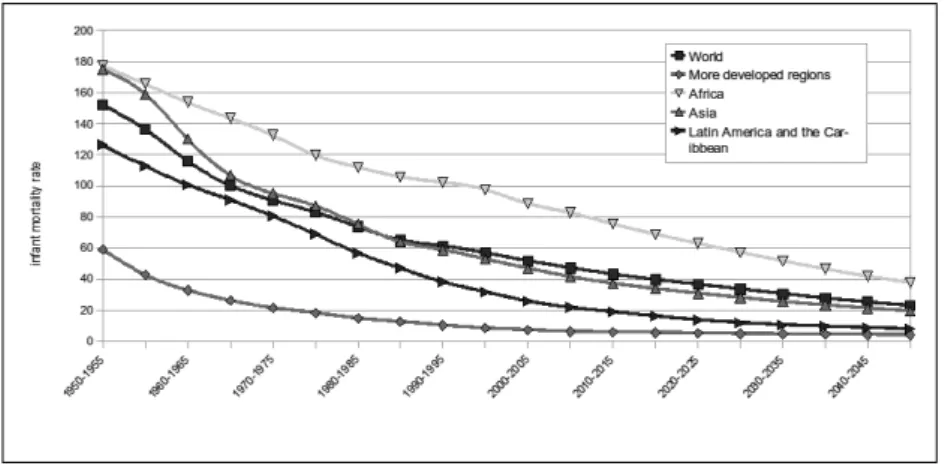
Figure 1.6.: Infant mortality in the different parts of the World in 1950-2050 ...21
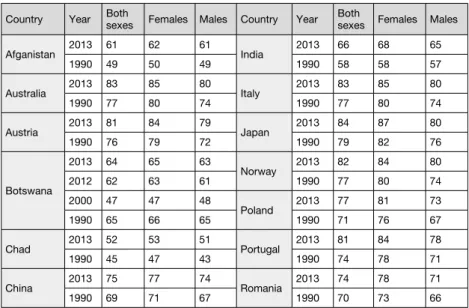
Table 1.2.: Life expectancy at birth for some countries in 1999 ...22
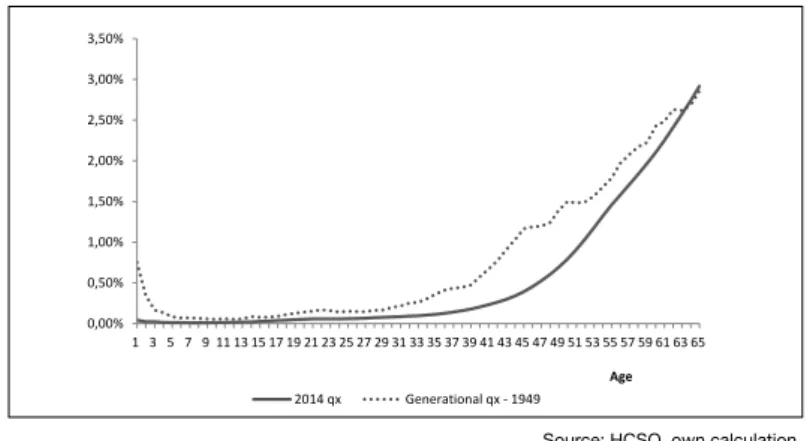
Figure 1.7.: 1949 generational and 2014 Hungarian male mortality rates from age of 1 ...24
Figure 1.8.: 1949, 1959 and 1969 generational, and the 2014 „normal” death probabilities from the age of 1 year ...24
Table 1.3.: U.S. annuity qx-s compared to the population mortality tables (1990-1996) ...26
Figure 1.9.: Hungarian (1949 and 2014) and Swedish (2014) male life tables ...28
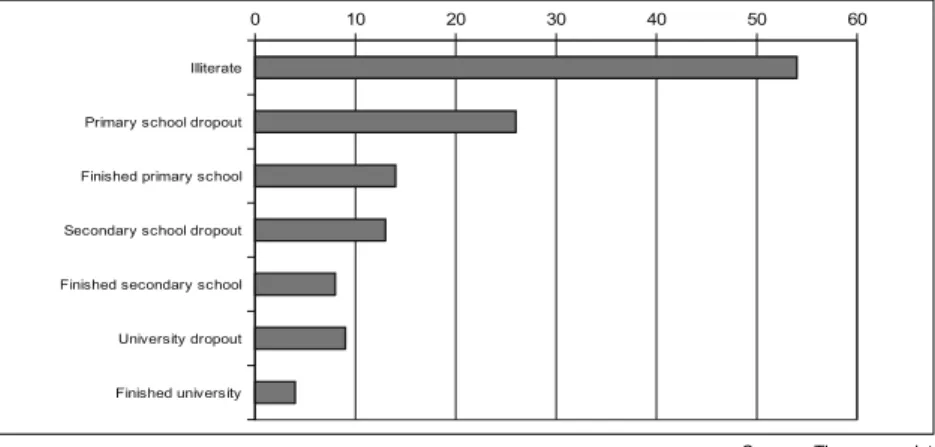
Figure 1.10.: Infant mortality per 1000 infants born as a function of mother’s education – Argentina, 1998. ...30
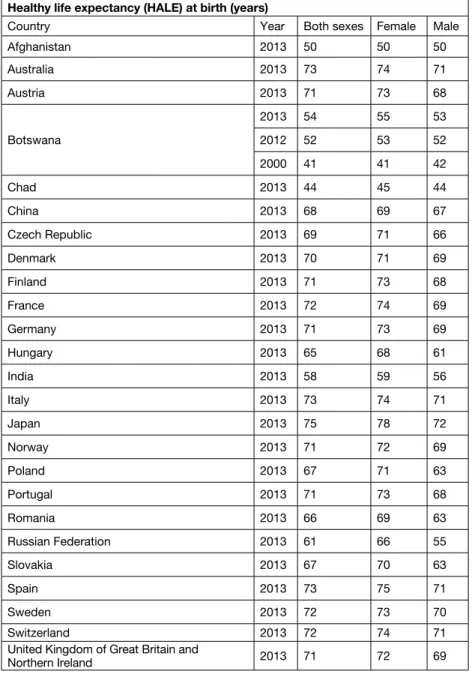
Table 1.4.: Disability adjusted life expectancy in some countries ...31
Table 2.1.: Life expectancy in various western countries (1750-2015) ...35
Figure 2.1.: The relationship between GDP per capita and the amount of life insurance per person in the Eu member countries in 2014 ...37
Table 2.2.: The GDP/capita and the life insurance expenditure/capita in the EU countires in 2014 (GDP in Current prices, euro per capita – 2014) ...38
Figure 2.2.: Variations of the life cycle ...39
Figure 2.3.: The relationship between income and consumption ...42
Figure 2.4.: The cash flow of the life cycle (difference between income and consumption – and the cumulated difference)...43
Table 2.3.: The structure of outgoing cash flow ...46
Figure 2.5.: The structure of expenditures as a function of age ...47
Table 2.4.: The structure of incoming cash flow ...48
Figure 2.6.: The structure of cash flow during the life cycle ...49
Table 2.5.: Major forms of saving ...53
Table 2.6.: The interests related to the life of the individual and their methods of realization ...59
Figure 3.1.: Samuelson’s idea of the social contract behind the PAYG pension system (assuming a static population) ...83
Figure 3.2.: A sustainable social contract behind the PAYG pension system (assuming a static population) ...84
Figure 3.3.: An illustration of the Bernoulli utility function ...86
Figure 3.4.: The illustration of Prospect Theory ...87
Data of Sweden and Slovenia is missing, the Danish data is from2014 ...98
Figure 4.1.: The premium and benefit structure of the first Unit Linked Insurances...105
Figure 4.2.: The benefits of the first Unit Linked Insurances (sequentially: death benefit; the sum of the value of the funds; surrender value) ...105
Figure 4.3.: Premium and benefit structure of modern Unit Linked insurance ...106
Figure 4.4.: The value of unit funds in a Unit Linked Insurance ...106
Table 4.1.: Table of accidental injuries ...118
Figure 8.1.: The pattern of regular premium term insurance ...158
Figure 9.1.: The absolulute (for sum assured 1) and relative premiums of a single premium endowment insurance by different technical interest rates, compared to the 0% interest rate ...165
Table 10.1.: Benefits received during the term by different types of annuities ...183
Figure 10.3.: The death (SAD) and maturity (SAM) sum assureds of the regular premium pure endowment with premium refund ( for the case n=6) ...203
Table 10.2.: The relative differences of the net annual premium of the pure endowment with premium refund and the annual installment of a savings account with different interest rates, terms and entry ages (calculating with 2014 Hungarian Male Population Mortality Table) ...205
Figure11.1.: The relation of the annual premium needed and the actual premium in case of term insurance ...228
Table 11.1.: The premium reserve of a term insurance – before premium payment ...229
Figure 11.2.: The premium reserve of a term insurance...230
Figure 11.3.: The premium reserve of term insurance with the same entry age and different insurance terms ...231
Figure 11.4.: The premium reserve of term insurance with the same insurance term and different entry ages ...231
Figure 11.5.: Reserve of a Term insurance with shortened premium term...232
Figure 11.6.: The premium reserve of a regular premium term, pure endowment and endowment insurance ...233
Figure 11.7.: Premium reserve of single premium pure endowment and endowment insurance ...234
Figure 11.8.: Pure endowment insurance with shortened premium term ...235
Figure 11.9.: The premium reserve of a regular premium endowment insurance with and without zillmerization ...236
Figure 12.1.: The risk of the insurer in case of “staged” term insurance with 20 years entry age and 20 years term ...255
Figure 12.2.: The risk of the insurer in case of “staged” term insurance with various entry age and 20 years term ...256
Figure 12.3.: The reserve and annual premiums of the “staged” term insurance with various entry age and 20 years term ...257
Figure 12.4.: The premium, reserve and the risk of the insurer of a “staged” term insurance. ...258
The entry age is 50 years, the technical interes rate is 0%, the premium payment period is shortened to 17 years ...258
Figure 12.5.: The reserve of a “staged” term insurance with 50 years entry age, 0% technical interest rate and various shortened premium payment periods...259
Figure 13.1.: Zillmerization – the conservative approach ...266
Figure 16.1: Cash flow with (dashed line) and without zillmerization ...291
Figure 16.2: The Actuarial Control Cycle ...291
Figure 16.3: “Basin” ...293
Figure 16.4. “Random fluctuation”...294
Figure 16.5: “Slight trend” ...294
Figure 18.1.: The path of the premium within the insurance company, or the main cash-flows of the insurer ...331
Male populatin mortality tabl ...371
Female population mortality table ...374
INTRODUCTION TO THE EDITION IN 2003
The goal of the book is to give a general introduction to life, accident and health insurance (and some other areas that functionally belong here, e.g. the world of pension and health funds), and contains a possible discussion of the concept of life insurance.
The concrete material of knowledge concerning the other mentioned insurance areas are contained in other textbooks, but the common basis can be found here.
One of the classical figures of sociology, Max Weber declared a hundred years ago that a tendency of capitalism compared to the former social order, feudalism is that it makes all social relations rationally calculable. Insurance is typically
“capitalistic” in this respect, or at least a modern phenomenon, since it makes events with uncertain financial outcome calculable with certainty.
Regarding life, accident and health insurance, first of all, we have to say that they are instruments to ward off events that can be anticipated in the life cycle and that occur in a standard way, but that cannot be anticipated on the individual’s level and have financial effects (pension, death, accident, sickness), and to eliminate uncertainty in the financial sense. Altogether we can say that life, accident and health insurances are instruments of the financial planning of the human life cycle. This way the first part of the book (chapters 1-3) discusses the financial planning of the life cycle.
Insurance fundamentally handles risks in two ways, that are connected to each other:
1. Converting uncertain large losses into small, but certain ones.
2. By creating reserves to cover future needs.
The general principles of both methods will be discussed later on.
The book, that is the revised, re-edited and enlarged edition in a uniform structure of the author’s former book, primarily follows the material of the “Life Insurance” course of the Actuary specialization at Corvinus University of Budapest. It complements the theoretical basis in the former edition with “practical” material. In these parts – just as in the university course – students can practice the terms and relations introduced in the sections discussing theory.
In the book the author uses the first person of plural, but where the author found it important to emphasize his own opinion on a subject, that differs from the opinion of other experts, the first person of singular is used.
INTRODUCTION TO THE HUNGARIAN (IMPROVED, EXPANDED) EDITION IN 2016 AND THE ENGLISH EDITION IN 2020
The time of publishing the new Hungarian version of this book had come in 2016, and now the English version. The book remained basically the same as the previous one, so the structure of the two editions are almost the same, but I have changed a few things.
The main differences between the two Hungarian editions are (this English edition is following the latest Hungarian one):
I have replaced the previous Chapter 3 with a new one into which I have put some important, general insurance concepts I am using later in the book.
in some chapters I have incorporated into the text the outcomes of my research connecting to that topic I have reached in the meantime.
I have also incorporated some minor additional topics that I have supplemented my regular teachings of that theme with.
I have made some minor changes to the notations, so that it became more consistent and more similar to the intartationally recognised standards.
I have continued to keep myself to the principle (similarly to the first edition), that I try to avoid any direct reference to legislation, or I refer to them in very general terms, because:
» the law is always changing (at least in Hungary, the regulation of many other countries are much more stable). For example, on a term shorter than two decades, already the third Incurance Act came into effect, but also the whole Civil Code is renewed (in which the whole insurance chapter was replaced by a new one),
» I am positive that insurance is what it is not because of the law, but on the contrary, the law (on insurance) is what it is because of the characteristics and logic of insurance, and here I would like to demonstrate this general logic from which the certain solutions of the regulation resulted,
» therefore the (relatively) new insurance “silver bullet” of the European Union, the Solvency II (shortly SII) was not reviewed in detail (it is not the topic of this book), I have only referred to some of its important considerations.
I. LIFE INSURANCE BASICS
1. BASICS OF DEMOGRAPHY
KEY WORDS
Average age Size of population
Generation mortality table Selection table Mortality table Life expectancy at birth Probability of death Probability of survival
Life table Disability adjusted life expectancy
Age structure Life expectancy
In order for insurance to be of help in the planning of the life cycle, the insurer must have concrete ideas and specific models in mind regarding the path of human life cycles and their most important parameters. (For example, their average length, the ratio of active and inactive stages, their distribution, the probability of death, illness, accidents, the expected extent of illness or injury from accidents, etc.) This information is usually obtained from public sources, which are mostly collected as a part of a separate social science, demography (the science of populations.) In the following sections we will get to know some demographical concepts and implications that are important with respect to insurance.
1.1. Total Population
In general, demography – similarly as insurance – deals with the patterns involving the
„movements” of large population masses. One of the most important such indicator- systems is one that refers to the changes and composition of the population size of a regional unit (usually a country).
11
1. BASICS OF DEMOGRAPHY KEY WORDS
Average age Size of population
Generation mortality table Selection table
Mortality table Life expectancy at birth
Probability of death Probability of survival
Life table Disability adjusted life expectancy
Age structure Life expectancy
In order for insurance to be of help in the planning of the life cycle, the insurer must have concrete ideas and specific models in mind regarding the path of human life cycles and their most important parameters. (For example, their average length, the ratio of active and inactive stages, their distribution, the probability of death, illness, accidents, the expected extent of illness or injury from accidents, etc.) This information is usually obtained from public sources, which are mostly collected as a part of a separate social science, demography (the science of populations.) In the following sections we will get to know some demographical concepts and implications that are important with respect to insurance.
1.1. TOTALPOPULATION
In general, demography - similarly as insurance - deals with the patterns involving the „movements” of large population masses. One of the most important such indicator-systems is one that refers to the changes and composition of the population size of a regional unit (usually a country).
Source: Hungarian Central Statistical Office (HCSO) Figure 1.1.: Population size in the current area of Hungary, its composition and change by age-groups
If we are only interested in the total population and its changes, then we can see right away that at any point in time this can be expressed as the resultant of two opposite factor-pairs. This is the balance of:
• births – deaths
• immigration – emigration.
If there is no immigration and emigration (as was virtually the case in Hungary in the 1970s and ’80s) then the size of the population will increase if there is a greater number of births than deaths (as is the case today in most of the so-called developing countries – in Asia, Africa and Latin-America), and it will decrease if the number of births is smaller (for example in Hungary in the last two decades).
One might think that the equilibrium between births and deaths can be achieved if every single person has one offspring (or every couple has two), because this would reproduce the population. This is true in the very long term for a population that is in equilibrium in other regards as well, but this principle cannot be used to explain the seemingly paradoxical phenomena we were able to observe, for example, in China at the end of the 20thcentury and the beginning of the 21stcentury. Here, for decades, every married couple in urban areas was allowed only one child, while couples from rural areas – if the first child is female - were allowed up to two
0 2 000 000 4 000 000 6 000 000 8 000 000 10 000 000 12 000 000
0 1 000 000 2 000 000 3 000 000 4 000 000 5 000 000 6 000 000 7 000 000
1990 1993 1996 1999 2002 2005 2008 2011 2014 1-18 19-64 65-
Figure 1.1.: Population size in the current area of Hungary, its composition and change by age-groups Source: Hungarian Central Statistical Office (HCSO)
If we are only interested in the total population and its changes, then we can see right away that at any point in time this can be expressed as the resultant of two opposite factor-pairs. This is the balance of:
births – deaths
immigration – emigration.
If there is no immigration and emigration (as was virtually the case in Hungary in the 1970s and ’80s) then the size of the population will increase if there is a greater number of births than deaths (as is the case today in most of the so-called developing countries – in Asia, Africa and Latin-America), and it will decrease if the number of births is smaller (for example in Hungary in the last two decades).
One might think that the equilibrium between births and deaths can be achieved if every single person has one offspring (or every couple has two), because this would reproduce the population. This is true in the very long term for a population that is in equilibrium in other regards as well, but this principle cannot be used to explain the seemingly paradoxical phenomena we were able to observe, for example, in China at the end of the 20th century and the beginning of the 21st century. Here, for decades, every married couple in urban areas was allowed only one child, while couples from rural areas – if the first child is female – were allowed up to two children. This meant that for decades the number of children for every couple was well below two, and yet during this time the population increased by several hundred million.
The solution to the Chinese mystery is simple: partly because in China, as well as around the world, life expectancy at birth increased significantly, and partly because in the second half of the 20th century a high proportion of the population was young, and therefore, there were many women of childbearing age among them. As a result of these, despite the fact that there were relatively few births, there were even fewer deaths, and both the average age and the size of the population were increasing. Although on a smaller scale, we can observe a similar phenomenon on the right side of Figure 1.1. Note that the number of children is decreasing, but the pace of the population decrease is smaller than that, because the increase in life expectancy generates an ever growing number of elderly people.
The population’s size and average age, and their changes over time have a very important role in certain long-run macro-level planning – for example in the planning of the welfare system (health insurance and pension system), – and through these in the opportunities of private insurance as well.
1.2. Composition of the Population by Age and Gender
We can also gain more detailed information about the population than just its total size and its changes. It is important to know, for example, how the total population is distributed among the sexes and age groups.
this time the population increased by several hundred million.
The solution to the Chinese mystery is simple: partly because in China, as well as around the world, life expectancy at birth increased significantly, and partly because in the second half of the 20thcentury a high pro- portion of the population was young, and therefore, there were many women of childbearing age among them.
As a result of these, despite the fact that there were relatively few births, there were even fewer deaths, and both the average age and the size of the population were increasing. Although on a smaller scale, we can observe a similar phenomenon on the right side of Figure 1.1. Note that the number of children is decreasing, but the pace of the population decrease is smaller than that, because the increase in life expectancy generates an ever growing number of elderly people.
The population’s size and average age, and their changes over time have a very important role in certain long-run macro-level planning – for example in the planning of the welfare system (health insurance and pension system), - and through these in the opportunities of private insurance as well.
-100 000 -50 000 0 50 000 100 000 19
17 2533 41 4957 65 7381 89 97
1994
-100 000 -50 000 0 50 000 100 000 19
17 2533 41 4957 65 7381 8997
2004
-100 000 -50 000 0 50 000 100 000 1
11 21 31 41 51 61 71 81 91 101
2014
-100 000 -50 000 1 0 50 000 100 000 11
21 31 41 51 61 71 81 91 101
1994-2014
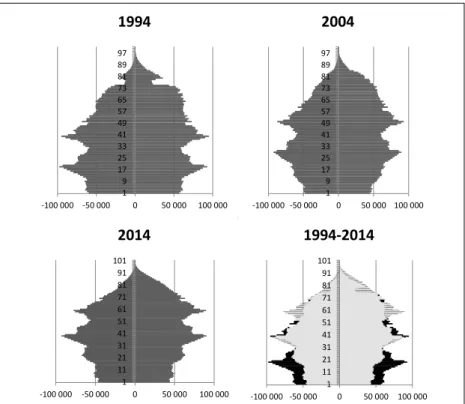
Figure 1.2.: The Hungarian age pyramid in different years, and in 1994 and 2014 comparing to each-other
The above figures show the age composition of the Hungarian population by gender (on the left is the male1, on the right the female population). These figures give a much more detailed view of the population than what the simple total population, the average age figures and their changes do, because it shows its composition in detail, along with
1 Whose number is, of course, non-negative, but the values are simply shown to the left of the y-axis!
certain important parameters (age and gender). It is true though that considering a single figure, this view is static, since we do not know exactly how we got to this point, or how this figure will look in a few years’ time. Of course, we can read many things about the past and future out of such a static figure, but this can be made more dynamic by placing several figures pertaining to different time periods next to each other.
Looking at these figures (and the numbers behind them) we can draw many important deductions even from such a static figure, but we can make it dynamic by drawing successive figures representing different times or we can superimpose two figures.
Considering these figures (and the numbers behind them) we can conclude to numerous important statements. We can observe that the number of males at birth is significantly higher (in 1994, 2004 and 2014, for example, there were only 56 456, 45 008, and 43 454 females for 59 320, 47 936, and 45 890 males in Hungary, respectively2)), but later this difference gradually decreases, and around age 40 the population of the two sexes more or less evens out3. After this age the ratio of women gradually increases (or decreases by less than that of men), and at age 84 there are more than twice as many women than men4. Since we can see from the figures (except 2014) that there are more 1-year-old children than newborns, and more 2-year-olds than 1-year-olds etc., we can observe that in the last decades there were fewer and fewer children born every year. On the figure relating to 1994 we can observe a peak around age 20 (which is wandering upward by 10 years per decade) and we can also observe that there was a peak in the number of births in the ’70s in Hungary. Since then, the number of births has decreased year after year. This is also related to the fact that in 1994 there was also a peak at around age 40-45 (those born in the middle of the ‘50s), made up of people who are probably the parents of babies born in the middle of the ‘70s. Even from a simple figure as this one we can draw far-reaching conclusions about the necessity of certain macro- level political steps. For example, if there are fewer children, we need fewer nursery schools, kindergartens, and elementary school classrooms, teachers, etc. If however the number of twenty year olds reaches a peak, then the need for university capacity will be higher, etc. If the number of parents are higher than that of children, then within a few decades the ratio of the old- and middle-aged will change significantly (it is visible on the right side of the Figure 1.1.), etc.
2 The ratio of the two gender here 1,05, 1,065, and 1,056. It is said, that as an average, the number of newly born boys is 6% higher than the newly born girls. The Hungarian data supports this, that is here there is no selective abortion, as in many countries in Asia, where – because of this – the proportion of the boys is much higher than this.
3 In Hungary in 1994, 2004 and 2014 the number of 40-year-old men was 86 055, 59 912, and 74 205 as long as the number of women was 86 735, 60 595, and 72 754, respectively. The ratio at this age is: 0,99, 0,99, and 1,02, that is much more even, than at birth.
4 The ratio at this age, in these years in Hungary: 8762/19892 =0,44, 9224/21160=0,44, and 11590/26261=0,44.
The above figures resemble a tree very closely. The shapes of these figures have gone through significant change throughout history. Earlier it was generally more the case that a greater number of children were born, but the infant and child mortality rate was also high, and the average lifespan was also very low. These factors together create an age structure figure in the shape of a pyramid (that is why the name of the figure is age pyramid in English) or a pine tree, which can be seen schematically in the following figure.
15 139 1721 2529 3337 4145 4953 5761 6569
-150 000 -100 000 -50 000 0 50 000 100 000 150 000
Number of lives - Females - males
Age
Figure 1.3.: Traditional pyramid-shaped age structure (age pyramid)
Hungary was described by such a „traditional” age structure figure at the beginning of the 20th century, and it is still typical today in some so-called „developing” countries.
In the developing countries we can see a new trend along with thehigh number of children typical in the western countries 100 years ago. This – similarly as in the western countries’ current situation – is the increase in the life expectancy at birth. This is mostly due to the disappearance of the earlier great epidemics, the radical decrease of the infant mortality and some improvement in the standard of living. These two factors together result in the phenomena called the „demographic boom”, which resulted in an unprecedented increase in the Earth’s population in the 20th century, especially in the second half, and this growth is expected to continue at least until the middle of the 21st century.
Of course, it is difficult to predict the total size of the Earth’s population ahead of time.
Even nowadays the estimates change year by year, and this is also true for the individual countries as well. In the ’70s, for example, no one could foresee the appearance of a new, previously unknown, deadly epidemic in the southern half of Africa, which resulted in a decreasing population for a while in some countries that previously showed increasing tendencies. Even further, AIDS – since it mostly has affected young adults –has change
the age pyramid in a very unique way5; a UN study described it as a „chimney” shape, which is shown in a forecast in 2000 for 2020 in Figure 1.4.
15
Source: The Economist Figure 1.4.: The predicted population of Botswana in 2020 with AIDS and without
The scenario on the Figure 1.4. turned out to be too gloomy, because - according to the data of World Bank - the population of Botswana was growing continuously before 2013 (seehttp://data.worldbank.org/in- dicator/SP.POP.TOTL), and the life expectancy – according to the WHO, see Table 1.2.! – though decreased sig- nificantly by 2000, by 2013 it has almost restored to the level of 1990.
In the long-run the age structure figure changes from a pyramid shape to a tree that has an increasingly wide crown around the middle and then top, whose trunk gets gradually thinner and taller (so the number of children decreases, but the earlier generations of larger numbers live for a longer time), and finally the crown disappears completely. The number of children born will probably not decrease infinitely either, and thus in the even longer term (in a hundred years!) developed countries will have an age structure figure resembling a co- lumn, so in every year the same number of children will be born, and all who have been born will more or less live to 80 + x years old.
International organisations and the individual countires are continuously making long term population projections. The realisation of these naturally differ to the earlier expectations but the gradual aging of develo- ped countires is a very strong tendency. And this basically endangers the old age care systems and their financing in the present framework.
While the number of children mainly in Islamic countries and Africa is still very high (often 7 children born for every woman on average, which can be regarded as the theoretical maximum), in developed western countries – and in Hungary – it has decreased well below the reproductive level (about 2 children per woman) in recent times.6
1.3. LIFE EXPECTANCY, PROBABILITY OFDEATH
Statistics pertaining to the size and composition of the entire population are very important for the purpose of politics, and the observations made from these serve as a framework for observations about the single individuals. In the planning of the life cycle (and later insurance) we are mainly interested in the statistics
6It is important to note that there is nothing wrong with a low and stable birth rate. It is not a tragedy that the population of a country is decreasing especially if we know that one of the greatest problems of the world today is over- population. If the number of children is stable – no matter at how low a rate – then sooner or later the aging of the population will also stop (stabilize). Of course, this can be a big problem if the functioning of certain institutions (such as a pay-as-you- go pension system) were explicitly made to depend on a high birth rate, but there is no reason for this to be the only possible system of institutions. For example a national pension system can be not only a Samuelson-type pay-as-you-go system – see Banyár [2014].
-150 -100 -50 0 50 100 150
0 15 30 45 60 75
Thousand lives
Age
Male - with AIDS Male - without AIDS Female - with AIDS Female - without AIDS Figure 1.4.: The predicted population of Botswana in 2020 with AIDS and without
The scenario on the Figure 1.4. turned out to be too gloomy, because – according to the data of World Bank – the population of Botswana was growing continuously before 2013 (see http://data.worldbank.org/indicator/SP.POP.TOTL), and the life expectancy – according to the WHO, see Table 1.2.! – though decreased significantly by 2000, by 2013 it has almost restored to the level of 1990.
In the long-run the age structure figure changes from a pyramid shape to a tree that has an increasingly wide crown around the middle and then top, whose trunk gets gradually thinner and taller (so the number of children decreases, but the earlier generations of larger numbers live for a longer time), and finally the crown disappears completely.
The number of children born will probably not decrease infinitely either, and thus in the even longer term (in a hundred years!) developed countries will have an age structure figure resembling a column, so in every year the same number of children will be born, and all who have been born will more or less live to 80 + x years old.
5 see: The Economist: 2000. July 15. issue 28. pp.91-93.: A turning-point for AIDS? In another article – 2001. February 10. issue 6. p.75.: Business and AIDS – The worst way to lose talent (South African firms are struggling to cope as AIDS spreads) – the figure in the article shows the life expectancy at birth in South-Africa in 1996 was above 60, but by 2000 this decreased to about 50, and by 2010 it is expected (in 2000) to decrease well below 40 (!) years. According to the data of WHO the situation has not became such a severe. The life expectancy at birth at men was 58,8 years in 1990 and it is really decreased significantly by 2000, but only for 54,4 years, and after that it started to increase. It is true, that the 57,1 years in 2003 still lower than the level of 1990. The same number at women 66,2, 61,8, and 63,6, that is the tendency is the same. (see http://apps.who.int/gho/data/view.main.61540?lang=en)
Source: The Economist
International organisations and the individual countires are continuously making long term population projections. The realisation of these naturally differ to the earlier expectations but the gradual aging of developed countires is a very strong tendency. And this basically endangers the old age care systems and their financing in the present framework.
While the number of children mainly in Islamic countries and Africa is still very high (often 7 children born for every woman on average, which can be regarded as the theoretical maximum), in developed western countries – and in Hungary – it has decreased well below the reproductive level (about 2 children per woman) in recent times.6
1.3. Life Expectancy, Probability of Death
Statistics pertaining to the size and composition of the entire population are very important for the purpose of politics, and the observations made from these serve as a framework for observations about the single individuals. In the planning of the life cycle (and later insurance) we are mainly interested in the statistics pertaining to the individual – and not those pertaining to the entire population. Naturally, the two are related: we take the social average as a representation of the individual.
From the above statistics of population movements we can first of all deduct the probability of death and the life expectancy of the individual.
Statistics regarding the size and the composition by gender and age of the population are collected during censuses. A census including the full population takes place relatively rarely (on average every ten years). Between two such censuses changes in the population are traced by the gathering of statistics from a representative sample of the population (micro census), so we have a more or less reliable estimate of the major statistics of the population every year.
Based on the census statistics, we can compare by years of age and gender the number of those living at the beginning of the year with the number of those who died during the year, and thus calculate the raw probability of death. If these are then arranged (for example on a graph where the horizontal axis shows age), then the resulting figure can be divided into a theoretical trend and a random deviation from this trend. The raw data,
6 It is important to note that there is nothing wrong with a low and stable birth rate. It is not a tragedy that the population of a country is decreasing especially if we know that one of the greatest problems of the world today is over-population. If the number of children is stable – no matter at how low a rate – then sooner or later the aging of the population will also stop (stabilize). Of course, this can be a big problem if the functioning of certain institutions (such as a pay-as-you-go pension system) were explicitly made to depend on a high birth rate, but there is no reason for this to be the only possible system of institutions. For example a national pension system can be not only a Samuelson-type pay- as-you-go system – see Banyár [2014].
once it is cleaned of these random deviations, are nothing else than the theoretical death probabilities (qx) pertaining to the given year, the meanings of which are:
qx = the probability of someone dying before reaching age x+1, given that they survived to age x
Since these statistics come from a „momentary” survey of the population, every qx marks a probability pertaining to generations born in different years living simultaneously, yet in the given moment these do give a snapshot of the mortality conditions of the entire population.
we take the social average as a representation of the individual.
From the above statistics of population movements we can first of all deduct the probability of death and the life expectancy of the individual.
Statistics regarding the size and the composition by gender and age of the population are collected du- ring censuses. A census including the full population takes place relatively rarely (on average every ten years).
Between two such censuses changes in the population are traced by the gathering of statistics from a representa- tive sample of the population (micro census), so we have a more or less reliable estimate of the major statistics of the population every year.
Based on the census statistics, we can compare by years of age and gender the number of those living at the beginning of the year with the number of those who died during the year, and thus calculate the raw probability of death. If these are then arranged (for example on a graph where the horizontal axis shows age), then the resulting figure can be divided into a theoretical trend and a random deviation from this trend. The raw data, once it is cleaned of these random deviations, are nothing else than the theoretical death probabilities (qx) pertaining to the given year, the meanings of which are:
qx= the probability of someone dying before reaching age x+1, given that they survived to age x Since these statistics come from a „momentary” survey of the population, every qxmarks a probability pertaining to generations born in different years living simultaneously, yet in the given moment these do give a
0,00%
10,00%
20,00%
30,00%
40,00%
50,00%
60,00%
70,00%
80,00%
0 3 6 9 12 15 18 21 24 27 30 33 36 39 42 45 48 51 54 57 60 63 66 69 72 75 78 81 84 87 90 93 96 99 Age
1949 2009
17
Source: HCSO
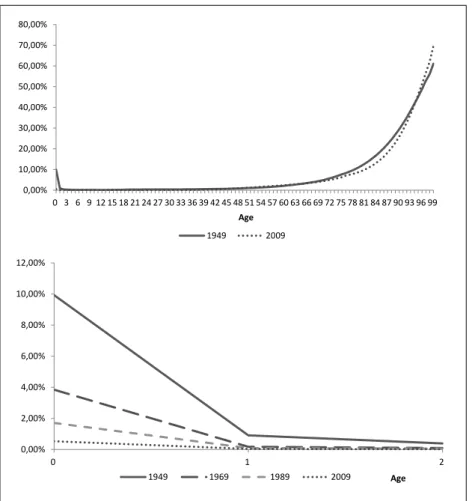
Figure 1.5.: The Hungarian male death probabilities in 1949, 1969, 1989 and 2009 in different segments and in different comparisons
From the Figures we can see that in Hungary, starting from 1949, infant mortality decreased from almost 10% to much below 1% in 60 years. The improvement is going on, as we can see on the Table 1.1.
Year 1960 1970 1980 1990 2000 2006
Infant mortality/1000 born alive 47,6 35,9 23,2 14,8 9,1 ≈5
Source: HCSO Table 1.1.: The values of the Hungarian Infant mortality (for both gender together) for 1000 babies born alive
Furthermore this is an international trend as it is shown in Figure 1.6.
0,00%
2,00%
4,00%
6,00%
8,00%
10,00%
12,00%
0 1 2
1949 1969 1989 2009 Age
0,00%
0,10%
0,20%
0,30%
0,40%
0,50%
0,60%
0,70%
0,80%
0,90%
1,00%
1 3 5 7 9 11 13 15 17 19 21 23 25 27 29 31 33 35 37 39 41 43 45
1949 1969 1989 2009 Age
20 Banyár József: Life insurance
Source: HCSO
Figure 1.5.: The Hungarian male death probabilities in 1949, 1969, 1989 and 2009 in different segments and in different comparisons
From the Figures we can see that in Hungary, starting from 1949, infant mortality decreased from almost 10% to much below 1% in 60 years. The improvement is going on, as we can see on the Table 1.1.
Year 1960 1970 1980 1990 2000 2006
Infant mortality/1000 born alive 47,6 35,9 23,2 14,8 9,1 ≈5
Source: HCSO Table 1.1.: The values of the Hungarian Infant mortality (for both gender together) for 1000 babies born alive
Furthermore this is an international trend as it is shown in Figure 1.6.
0,00%
2,00%
4,00%
6,00%
8,00%
10,00%
12,00%
0 1 2
1949 1969 1989 2009 Age
0,00%
0,10%
0,20%
0,30%
0,40%
0,50%
0,60%
0,70%
0,80%
0,90%
1,00%
1 3 5 7 9 11 13 15 17 19 21 23 25 27 29 31 33 35 37 39 41 43 45
1949 1969 1989 2009 Age
Source: HCSO Figure 1.5.: The Hungarian male death probabilities in 1949, 1969, 1989 and 2009 in different
segments and in different comparisons
From the Figures we can see that in Hungary, starting from 1949, infant mortality decreased from almost 10% to much below 1% in 60 years. The improvement is going on, as we can see on the Table 1.1.
Year 1960 1970 1980 1990 2000 2006
Infant mortality/1000 born alive 47,6 35,9 23,2 14,8 9,1 ≈5
Source: HCSO Table 1.1.: The values of the Hungarian Infant mortality (for both gender together)
for 1000 babies born alive
Furthermore this is an international trend as it is shown in Figure 1.6.