Introduction
Agricultural interventionism is often justified on ideo- logical grounds, with reference to the objectives of food security, food production self-sufficiency, food safety and natural resource protection. There is a lack of quantitative criteria that might indicate what kind of support should be provided, and to whom, in order to produce benefits in terms of social well-being.
The concept of political rent is defined based on the theory of rent-seeking – but is it conceptually appropriate to contemporary agricultural policy in developed countries? By definition, political rent is inextricably linked to the wastage of resources and to exclusive benefits provided to selected social groups at the expense of others. No attempts have yet been made in the literature to quantify political rents, even though this might lead to an improvement in the effectiveness of pub- lic expenditure. This, in our view, is a significant gap.
The present work aims, firstly, to review the concepts of rents and rent-seeking as used in the literature on political economy with regard to their appropriateness to the discus- sion on European Union (EU) agricultural policy. Secondly, we attempt to develop a methodology for quantifying pure political rents in agricultural policy, and apply it to a compar- ative analysis of rents from the Common Agricultural Policy (CAP) in the 27 EU Member States in the years 2004-2012.
In this way they refute certain stereotypes concerning the CAP, while seeking an answer to the question of what part of the subsidies paid to agriculture in the EU-27 is justified by the concept of payment for public goods or compensation for imperfections in agricultural markets, and what part has no objective justification and represents a pure political rent according to the rent-seeking theory.
This reasoning contributes also to the discussion on the fair level of the CAP payments in different Member States.
Per-hectare payments are substantially lower in the countries that joined the EU in 2004 and subsequently. This arrange- ment is usually supported by the argument that those coun- tries have lower labour costs. However, if policy makers care about equal conditions for competition they should also consider other market imperfections. Some of them mani- fest in Cochrane’s treadmill effects (Cochrane, 1958; Levins and Cochrane, 1996), as well as in the occurrence of public goods. We aim to show how the CAP consensus might be changed by including these effects.
Political rents and rent-seeking: a literature review
Rent-seeking involves a striving by economic entities to obtain benefits (primarily financial or material) by exerting influence on relevant institutions, such as through lobbying4. More detailed definitions refer to active rent-seeking, which denotes the expenditure of resources by private firms and interest groups for the purpose of obtaining protective forms of regulation from those in authority (Sztaba, 2002). Two points may be emphasised: firstly, that active rent-seeking includes legal activities and, secondly, that these restrict the free management of resources and to some extent distort competition.
The political rent market is formed on the one hand by those demanding the desired regulations, namely the afore- mentioned interest groups and manufacturers’ and consum- ers’ associations, which expend funds for that purpose and to which particular regulations will bring measurable benefits (such as protection of an internal market, maintenance of prices, approval or non-approval of a particular type of con- sumer good etc.). The response to that demand is a supply,
4 The term was first defined by Krueger (1974), although the phenomenon had been considered previously by Tullock (1967).
Bazyli CZYŻEWSKI*1 and Anna MATUSZCZAK*2
Rent-seeking in agricultural policy revisited: a new look at the Common Agricultural Policy consensus
It is generally believed that agricultural interventionism represents the payment of political rents to farmers. We attempt to show that the concept of political rent known as the rent-seeking theory is not valid for agricultural policy. It is not justified to identify the entire subsidies paid to agriculture as a ‘political rent’, since political rents cannot be taken to include payments for the supply of public goods or those transfers which compensate for market imperfections. Our work aims firstly to review the concepts of rents and rent-seeking, and to develop a methodology for quantifying political rents in agricultural policy. We perform comparative analyses with the aim of calculating the ‘pure political rent’, based on the input-output approach for representative farms according to the EU FADN typology and on a decomposition of the Hicks–Moorsteen TFP index for the period 2004-2012 and 27 European Union Member States. The calculations of political rents show that historical payments are neither a rational nor a just solution. No attempts have yet been made in the literature to quantify political rents, even though this might lead to an improvement in the effectiveness of public expenditure. The original methodology is proposed for valuing these items.
Keywords: political rent, rent-seeking, agriculture, treadmill theory JEL classifications: Q10, Q15, B52
* Uniwersytet Ekonomiczny w Poznaniu, aleja Niepodległości 10, 61-875 Poznań, Poland. Corresponding author: anna.matuszczak@ue.poznan.pl Received 2 January 2018; revised 12 February 2018; accepted 13 February 2018.
1 http://orcid.org/0000-0002-6324-2723
2 http://orcid.org/0000-0002-5045-5447
created by politicians and officials, who ‘sell’ the regulations over which they have authority, in exchange for political sup- port. Research shows that, fearing loss of electoral support, such persons are willing to intensify their actions relating to rent-seeking (Persson et al., 1997; Acemoglu and Robinson, 2000; Acemoglu and Robinson, 2006).
What occurs, then, is a kind of political economic trans- action (Zybertowicz, 2010). More concretely, it can be con- cluded that political rent most often occurs in the form of a transfer of income from certain entities to others, through the use of mechanisms of political power, and not – as is nor- mally the case – through market mechanisms. On a micro- economic approach, the benefits obtained should be consid- ered individual benefits, and the expenditure made should be treated as ‘investment’. Hence, if in a democratic society the interests of narrow social groups are carried over to the actions of public authorities, thus providing those groups with exclusive benefits (rents), then this constitutes a politi- cal rent (Wilkin, 2012).
From a social standpoint, one may analyse the losses resulting from the unproductive use of resources, and this has been the subject of many theoretical works. From this perspective, the concept of political rent serves to explain why economically-ineffective measures are put into effect by politicians, and then maintained in force, even when they cause obvious harm to the well-being of society. Policy may thus be ineffective in terms of overall well-being (causing non-optimal allocation of resources and distortion of market stimuli) if it provides preferential treatment and potential benefits for specific interest groups that constitute a suffi- ciently strong electorate (Buchanan et al., 1980; Tollison, 1982; Rose-Ackerman, 1997; Schneider and Wagner, 2001;
Lee and Tollison, 2011; Aligica and Tarko, 2014).
In this light, it can be claimed that the EU’s intervention- ist agricultural policy provides an example of the existence of political rent. Rent-seeking in EU agriculture, however, does not concern only political lobbying. The claim that subsidies and other instruments of the CAP produce exclu- sive benefits for farmers at the cost of consumers is some- what trivial and not entirely accurate. The question would appear to be more complex, as the benefits are not always exclusive, in view of the fact that farmers provide certain public goods, and moreover agricultural producers need to fulfil certain requirements, expending their resources, in order to receive those privileges. According to Tullock, rent-seeking is profitable only in conditions of perfect competition and absence of economies of scale (Tullock, 1980a; Tullock, 1991). If economies of scale are present, the total value of investment required to obtain a political rent is greater than the rent itself (Tullock, 1980b; Tullock, 1991). This would mean that small family farms, which are not able to generate economies of scale in production, are net beneficiaries of political rents, while large farms, for which meeting the CAP’s environmental requirements car- ries a significant alternative cost, may not receive any net rent. In other words, the cost of producing the public goods required in exchange for political rent exceeds the value of the rent (Aligica and Tarko, 2014). The present study aims to establish whether this theory of Tullock is applicable to agriculture in the EU.
In the literature, particularly in the field of political econ- omy, political rents are considered widely, in relation to both the mechanisms for seeking (competing for) them, and their consequences for market processes and well-being. Below we make a review of various theoretical and empirical approaches to the concept of political rent, particularly those which pre- sent in a new light the problem of rent-seeking in relation to the EU’s CAP. To these approaches may be ascribed the fol- lowing hypotheses, put forward by the authors cited below:
(a) the greater the degree of political competition, the higher the political rents (in other words: small interest groups have greater political strength); (b) market imperfections determine the distribution of political rents; and (c) rent-seeking may be complementary to an increase in production (the theory of complementarity between rent-seeking and production).
The fourth thesis refers to the phenomenon of political competition, in the sense of the intensity of rivalry between political parties (Roemer, 2006). The results of a study by Fałkowski and Olper (2014) show clearly that when the level of political competition is higher, the rents paid to agriculture are greater. This positive correlation can be observed in both developing and developed countries. The interpretation of this phenomenon is based, firstly, on an analogy between economic and political competition. Political parties cannot act against the will of the majority, just as producers cannot act against trends in consumption (Becker, 1958; Stigler, 1972). On the other hand, Olson’s theory of interest groups states that it is small groups that have greater political power (Olson, 1965), because as interest groups expand, the readiness for collec- tive action declines. This leads to a ‘development paradox’
(Swinnen et al., 2000; Olper, 2001; Grzelak, 2011): in highly developed countries agriculture makes a relatively small con- tribution to GDP, but receives relatively large political rents – since the agricultural lobby is small, but well-organised and politically strong (Poczta-Wajda, 2013). Moreover, economic development alters the division of the costs and benefits of support for agriculture (Swinnen, 2009). Per capita costs are distributed between an increasing number of persons employed outside agriculture, entailing a weakening of stimuli to protest against protectionist agricultural policy. At the same time, processes of urbanisation increase demand for services based on the state of the natural environment, which is inevi- tably connected with rural areas. There is therefore an increase in the utility of the public goods supplied by agriculture, and in readiness to pay for them. Hence retransfers of income to agriculture, even if ineffective from an economic standpoint, are rarely challenged by political groupings (Aidt, 2003). As a result, the observation that in developed countries agriculture is subsidised, while in developing countries it is taxed in net terms, comes to be valid globally.
The best-developed line of research is that concerned with the effect of imperfections of the market (imperfect competition) and of agricultural policy (imperfect imple- mentation) on the distributional effects (‘incidence’) of agricultural policy (Alston and James, 2002; de Gorter and Swinnen, 2002). It is found that only 20 per cent of total market and price support in agriculture in the OECD coun- tries creates a net surplus in agriculture, while the remainder flows out to related sectors (OECD, 2000), including to land- owners (except where individual farms are concerned). This
phenomenon is referred to by the authors as a ‘surplus drain’
from agriculture, and is particularly marked in Central and Eastern European countries. Research conducted in Poland shows that it occurs regardless of the scale of agricultural interventionism, and for example in the period 1990-2003, prior to Poland’s accession to the EU, it was equally strong.
It can be concluded from this that market imperfections in sectors related to agriculture affect not only the division of political rents to agriculture (if such exist), but also the division of the surplus resulting from increasing agricultural productivity in general.
In view of the importance of this problem and the lack of adequate research in this area, we will devote the remainder of this paper to it. In Western Europe and the USA, where agricultural interventionism has operated continually since the 1950s, studies have confirmed that imperfect competi- tion in the areas of agricultural food processing and the manufacture of means of production and service provision to agriculture has a significant effect on the distribution of political rents (McCorriston and Sheldon, 1991; Salhofer and Schmid, 2004). In turn, it has been shown (Ciaian and Swinnen, 2009) that the net effect of area payments on the profits of single-product farms is negative. For example, in extensive grain production, while farms profit directly from subsidies and indirectly from the increased efficiency result- ing from subsidised investments, they lose significantly due to the increase in prices of rent and purchase of land, whose marginal productivity increases, stimulating demand. These losses are dominant in the balance of costs and benefits of decoupled payments. Mixed farms, however, may gain over- all, as CAP payments make it easier for them to obtain credit.
Diverging from the main line of thought concerning the decrease in overall well-being due to the payment of political rents is the ‘theory of complementarity of rent-seeking and production’ (Teng, 2013). Based on a model formalisation, that author challenges the universality of the thesis whereby rent-seeking is identified with a fall in productivity, and pro- poses a theory in which increased production and rent-seek- ing are not substitutes. These processes become complemen- tary when the entities seeking rent are also producers, and their production output at the same time constitutes inputs to the rent-seeking effort. It is not easy to apply this generalisa- tion to agriculture (it would be as if farmers paid lobbyists in agricultural products), but certain analogies may be noted.
If it is accepted that the ‘products’ of agriculture include specific public goods, they may also represent a bargain- ing counter for the agricultural lobby and politicians. In this sense the aforementioned complementarity of production and rent-seeking also arises in agriculture. This is an issue to which we shall return in a later part of our considerations.
The above review of the literature leads to the important conclusion that political rents in agriculture diverge from the essence of the concept of rent-seeking, which is inextricably linked, firstly, to wastage of resources and loss of overall well-being and, secondly, to exclusive benefits obtained by selected social groups at the expense of others.
• If the resources devoted to rent-seeking even partly serve to produce public goods, then that part cannot be regarded as wastage (according to the theory of complementarity of rents and production).
• If the payment of political rents to agriculture results in the delivery of any public goods, then these ben- efits are not exclusive.
• If market imperfections in sectors related to agricul- ture cause rents and economic surplus to be captured by other entities, then it is even more the case that these benefits are not exclusive.
The above considerations motivated us to attempt to give a new definition of political rent in agriculture, and to develop a methodology for measuring it. There are no reports in the literature concerning attempts to quantify political rents, even though this might lead to an improvement in the effectiveness of public expenditure. It is generally accepted that agricultural incomes are primarily a result of institu- tional actions rather than the action of the market (subsidies account for approximately two-thirds of agricultural income in EU Member States on average). For many years, the costs of agricultural production have been estimated to exceed the revenue generated in more than one half of EU Member States, and if it were not for the subsidies paid to farms, agri- cultural production would become entirely unprofitable (cf.
relationship of decoupled subsidies to agricultural income:
according to Farm Accountancy Data Network (FADN) data, in most Member States it is above 0.5 but there are also instances where it exceeds 1).
We must be aware, however, that the stream of subsi- dies received by farmers does not in its entirety constitute a political rent as hitherto construed. In this study an attempt is made to evaluate a new category – the ‘pure political rent’
obtained by agriculture in the various countries of the EU-27.
To enable this category to be considered, it is necessary to distinguish within the total pool of subsidies received by a farmer the payment made for public goods generated by the farm, and the part which serves to compensate for the drain- age of economic surplus resulting from market imperfec- tions, which causes the prolonged opening of ‘price scissors’
in agriculture. There are also discussions in the literature concerning the distribution of political rents in the context of market imperfections, for example in relation to land (Ciaian and Swinnen, 2006), credit (Ciaian and Swinnen, 2009), and fishing restrictions (Wilen, 1989, Holzer et al., 2012). The residual amount can then be regarded as a surplus benefit not having any economic justification, and representing the result of rent-seeking.
Methodology for measuring pure political rents
We stated above, based on a review of the literature, that the distribution of political rents is dependent on market imperfections in agriculture and related sectors. Moreover, market imperfections decide not only about the distribution of political rents, but also about the division of economic rents in general. The price flexibility5 is mainly responsible for draining economic rents from agriculture. It is particu-
5 Tomek and Robinson (1990) define the price flexibility coefficient as (∆P/P):(∆Q/Q), where P denotes prices and Q output.
larly characteristic of the sector of agricultural raw materi- als according to the concept of agribusiness of Davis and Goldberg (1957). Also, Cochrane (1958) introduced the notion that farmers are on a treadmill which, in spite of their constant efforts to improve factors productivity (TFP), wears away any profits that might result. The point of departure for Cochrane was the statement that it is a myth that agriculture returns to balance automatically. In the case of increasing supply, a disproportionately high decrease in prices can be observed and, ultimately, it turns out to be disadvantageous for revenue even in the long run.
The EU’s CAP sets itself the goal of ameliorating the effects of market imperfections in areas related to agricul- ture. Reforms of the CAP in recent years have aimed to soften the effects of market inefficiencies in such areas as absence of remuneration to agriculture for the supply of pub- lic goods, the lower level of income compared with other sectors of the economy, and limitations on access to external financial capital (EC, 2010).
In order to model the flow of rents of price flexibil- ity in agribusiness, it is necessary to separate processes of changes in real productivity from changes in prices of products and inputs. The change in real productivity in the agricultural sector (excluding subsidies) is calculated using the I-O (Input-Output) approach. In general, the proposed method of computing TFP change is based on indicators of total factor productivity of the Hicks–Moorsteen (HM TFP index, cf. Coelli et al. 2005), which have been decom- posed in the input-output matrices for agricultural sec- tors of different countries. The method was developed by Lecomte and Louis (1974) and also adopted by Gburczyk (1990) as the global productivity surplus accounts. It is a different approach to changes in TFP than that generally found in the literature. Changes in TFP are calculated in real terms (after elimination of the effects of prices, sub- sidies and other payments from the CAP), not on the basis of the Malmquist Productivity Index but using input-output matrices (60 input-output variables). The Malmquist index has become extensively used in international comparisons of agricultural productivity since it does not require prices for its estimation, which are normally not available. In this case we had available a complete matrix of price indices for 60 input-output variables, prepared with the use of Euro- stat data. The I-O approach to measure TFP changes has a substantial advantage: it allows to estimate monetary value of the productivity change. Then one can assess the tread- mill effect and distinguish the part of the economic surplus flowing out of farms as the result of flexible prices. The change in real productivity on the farm level is expressed as follows:
(1) where Qi is the quantity of product i in successive years (t–1, t); Fj is the quantity of external input j in successive years (t–1, t); Pi is the price of product i in year t–1; Rj is the price of external input j in successive years (t–1, t); and ΔTFP is the change in the real productivity of factors (in money units), neglecting the CAP and prices fluctuations.
In equation (1) the variable Qi is determined by price expectations. Productivity is understood here as the output produced with given inputs. In turn, the flow of rents result- ing exclusively from the change in prices of sold products and purchased means of production is given by the equation:
(2)
where HICP is the inflation rate; ΔASt is the change in the farm’s economic rents in period t relative to t–1(the drain- age or inflow of economic surplus through prices known as Cochrane’s treadmill effect); other symbols have the same meaning as in equation (1).
For example, a farm has additional surplus (rent) com- paring to a previous period t–1 when the actual revenues in real prices ( ) exceed the revenues in constant prices (Qit · Pit–1) deflated with producer price indices for specific outputs. Similarly, it has also unexpected surplus if the actual outlays in real prices ( ) is lower than the outlays in con- stant prices (Fjt · Rit–1) deflated with producer price indices for specific inputs.
There are some limitations of this approach. A behav- iour of farmers in our model is quite naïve since they consider a change of prices for the same amount of prod- uct (Qit) in two consecutive periods. If the stationary equilibrium was reached, both the production amount and prices would change. However, in this case we assume that the equilibrium is not stationary but static.
We argue that it is an effect of adaptive expectations in agriculture. The equations (1) and (2) stay in the relation:
ΔTFP + ΔAS= actual change in income.
The value of pure political rents PR for a representative farm over a long period lasting for n years is computed using equation (2) in the following way:
(3)
(4)
where n is the number of periods; PRt1...tn is the political rent in period t1...tn; Si is the subsidy paid to agriculture under the s CAP programmes; VPGi is the payment for the public goods supplied by a representative farm according to the g CAP programmes (the choice of programmes is discussed below);
other symbols have the same meanings as in equation (2).
By the above methodology, PRt1...tn was computed for an average farm from the FADN representative sample of approximately 80,000 farms, according to classes based on standard output (SO) in the EU-27 Member States in the period 2004-2012. For estimating the value of rents for the whole population of representative farms using the FADN
sample in a given Member State, the aggregate values
, and ΔAStn for an average farm were mul-
tiplied by the number of representative farms in the class in question6.
CAP dilemmas of payments for public goods
The dilemmas faced by contemporary European agri- culture come down to resolving the conflict between the pro-environmental and pro-social elements of the CAP, and the need to keep EU agriculture as competitive as possible.
Attempts to solve these problems can be illustrated by sev- eral example areas involving instruments of the CAP. The first is the determination of the relationship between the support provided under Pillars 1 and 2. There is a conflict of interest here between farmers, who are decidedly more interested in the instruments of Pillar 1 (particularly direct, income-supporting subsidies), and consumers, who expect rural areas to function as a supplier of public goods (Cooper et al., 2009; Lyon, 2009), namely the preservation of land- scape and natural features, biological diversity and high quality of food products. It seems that, considering the needs of a wide group of citizens, agriculture ought to fulfil the function of a quasi-public sector – that is, we can expect to observe an increase in the role played by Pillar 2. However, in order to receive specified services it is necessary to pay the farmers – otherwise they will cease such activity and engage in the production of the agricultural raw materials that become more profitable according to demand for food and prices on the world market (Czyżewski and Stępień, 2009).
Observation of the evolution of rural areas in EU Member States indicates that the centre of gravity of the Polish rural economy may soon shift in the direction of increasing impor- tance for extra-agricultural functions. This is also indicated by the CAP reforms since 2014. There is also an awareness that it is not possible for the development of rural areas to be regulated by a market mechanism. Account must be taken of preservation of the state of the natural environment and care for the rural landscape, so as to preserve the identity of the countryside in spite of the increasingly rapid changes taking place (Wilkin, 2011).
Let us return to the previously-discussed thesis that “if the resources devoted to rent-seeking even partly serve to produce public goods, then that part cannot be regarded as wastage (according to the theory of complementarity of rents and production)”. It is nonetheless debatable how that part is to be defined. According to the assumptions of the concept being considered, rent-seeking farmers are also producers, and the positive external effects of their actions, having the nature of public goods, are in some sense rent-seeking out- lays, in the sense of a bargaining chip providing legitimacy for the seeking of subsidies. Nonetheless, not all types of
6 The SO classes are defined based on the value of output corresponding to the average situation in a given region for various types of agricultural production. In the FADN methodology, farms are described according to their SO values as follows:
EUR 2,000-8,000: ‘very small’; EUR 8,000-25,000: ‘small’; EUR 25,000-50,000:
‘moderately small’; EUR 50,000-100,000: ‘moderately large’; EUR 100,000-500,000:
‘large’; above EUR 500,000: ‘very large’.
CAP subsidies carry a tangible effect in the form of public goods. The concept of a public good here is something of a generalisation. It includes not just utilities with the attributes
‘non-rivalrous’ and ‘non-excludable’ – namely pure public goods (Head, 1962; Buchanan, 1968) – but also common goods, in whose case rivalry occurs between consumers. It is debatable whether support from Pillar 1 of the CAP leads to the creation of public and common goods. A certain step in this direction is certainly provided by the cross-compliance principle, but this can be said to serve more the maintenance of the usefulness of the private resource of land and other assets for the production of high-quality food in the long term. The receipt of area payments is not subject to strong restrictions as regards the chemicalisation of agriculture or increased intensity of agricultural production, which can have a negative effect on the environment and thus on com- mon goods. Nonetheless a number of programmes under Pil- lar 2 of the CAP, directed towards the development of rural areas, undoubtedly lead to the direct creation of new com- mon goods or care for existing ones. In our view, these attrib- utes pertain in particular to agri-environmental payments, support for least favoured areas (LFAs), set-aside payments, and to the subsidies to rural area development (RDA).
We tried to find the selection which is the least disput- able, however we are aware of its limitations. If we assumed that instruments used within the CAP are strongly comple- mentary to each other, it would be impossible to increase the provision of public goods without a growth in Pillar 1 payments. One may argue that delivering public goods is a direct by-product of agricultural activities (as in line with the multifunctionality of agriculture argument). In that sense, for having these public goods we need to have agricultural activities. The latter are supported by direct subsidies (Pillar 1 of the CAP). As a corollary to that: direct subsidies also contribute to public good deliveries (in that case our defini- tion would be too narrow). However, by this reasoning we conclude that many more activities produce public goods, and the notion of ‘public good’ is too wide to support it by public funds.
We should also remember that a large part of the subsidies in the EU Member States that joined the EU prior to 2004 is of a historical nature. Thus, one can argue that introducing so-called ‘payments for public goods’ was used just to pre- serve the status quo (so that the share is held more or less constant). In other words, one may argue that changes are only the rhetoric and not the sustainable philosophy. Collat- ing Sweden, Finland and Austria with other Member States should be treated with caution as these countries joined the EU (and the CAP) when the movement towards ‘greening’
was already in place. In fact, there are arguments that they used LFA or agri-environmental payments precisely to max- imise their share in the budget, as with any other strategy they would be worse off. Finally, there are doubts about the efficiency of using funds for public goods. It is hard to say whether this is the optimal way to achieve the goal.
Seeking a compromise, we follow the rule that any attempt to ‘green’ agriculture is better than doing nothing and we assumed that the agri-environmental payments, LFAs, set-aside payments and RDA subsidies contribute to public goods provision. We analysed the contribution of the
aforementioned payments (called by way of simplification
‘payments for public goods’) to the total subsidies paid to average farms in the EU-27 Member States in 2004-2012 (Tables 1 and 2). It was expected that, in accordance with current discussions and progressive reforms of the CAP, this share of the total subsidy would be found to be increas- ing. It turns out that this is one of the myths concerning the CAP. The reality is quite different, and the postulates concerning the pro-environmental and multifunctional direction of the CAP prove to a large extent to be mere declarations. In most EU Member States the level of these payments remains relatively stable, while in the others it is usually decreasing. The highest percentage of payments for public goods is recorded in Austria and Finland (ca.
40 per cent of total subsidies), countries where, in view of the unfavourable geography and consequent lower profit- ability of agricultural production, traditional agriculture is shrinking markedly in favour of organic production, supply of public goods and multifunctional development of rural areas. The proportion is also large, although decreasing, in Slovakia and Luxembourg (average 34 and 30 per cent respectively) and in Slovenia and Sweden (average 29 per
cent). The lowest proportion accounted for by such pay- ments is found in Denmark (4 per cent), Spain and Poland (6 per cent), and Belgium (7 per cent), where favourable conditions for production successfully compete with the realisation of extra-agricultural functions in rural areas.
Also interesting are France and Germany, two of the largest agricultural producers in the EU, where in the period under analysis there was a marked fall in payments for public goods as a percentage of total subsidies – respectively from 14 to 9 per cent and from 19 to 11 per cent.
It can be assumed that the stream of subsidies theoreti- cally linked to the supply of public goods is insufficient for them to be substituted for other payments and related pro- ductive activity. The data in Tables 1 and 2 show that pay- ments for public goods are not more widely used in the ‘old’
EU-15 Member States than in the EU-12, although it appears that Romania, Bulgaria and Poland are not making full use of their possibilities in this area. In those countries the envi- ronmental potential is large, but in our view the structure of Pillars 1 and 2 of the CAP is determined by political reasons, since easily-available area payments represent the most per- suasive offer to rural electorates.
Table 1: Payments for public goods as a proportion of total subsidies to an average farm in the EU-15 Member States in the period 2004- 2012.
Country 2004 2005 2006 2007 2008 2009 2010 2011 2012 mean
Denmark 0.10 0.04 0.04 0.03 0.04 0.04 0.04 0.05 0.03 0.04
Spain 0.07 0.09 0.05 0.04 0.07 0.05 0.06 0.06 0.07 0.06
Belgium 0.08 0.06 0.06 0.07 0.08 0.09 0.08 0.08 0.09 0.07
Italy 0.07 0.10 0.07 0.07 0.08 0.11 0.09 0.09 0.11 0.09
France 0.14 0.15 0.09 0.09 0.08 0.09 0.08 0.09 0.09 0.10
Germany 0.19 0.13 0.12 0.10 0.10 0.09 0.10 0.11 0.11 0.11
Netherlands 0.15 0.14 0.14 0.10 0.12 0.12 0.12 0.15 0.14 0.13
Portugal 0.19 0.19 0.19 0.19 0.18 0.11 0.08 0.11 0.11 0.14
Greece 0.09 0.17 0.18 0.17 0.20 0.22 0.17 0.16 0.09 0.16
United Kingdom 0.16 0.12 0.17 0.21 0.19 0.18 0.18 0.18 0.19 0.18
Ireland 0.22 0.22 0.25 0.24 0.22 0.18 0.22 0.23 0.21 0.22
Sweden 0.32 0.29 0.27 0.31 0.24 0.25 0.30 0.30 0.32 0.29
Luxembourg 0.35 0.33 0.33 0.32 0.31 0.28 0.25 0.28 0.24 0.30
Austria 0.45 0.42 0.41 0.38 0.36 0.37 0.37 0.42 0.45 0.40
Finland 0.40 0.45 0.39 0.43 0.43 0.37 0.37 0.38 0.40 0.40
Source: own calculations based on FADN data
Table 2: Payments for public goods as a proportion of total subsidies to an average farm in the EU-12 Member States in the period 2004- 2012*.
Country 2004 2005 2006 2007 2008 2009 2010 2011 2012 mean
Romania - - - 0.00 0.001 0.01 0.006 0.18 0.07 0.02
Bulgaria - - - 0.00 0.02 0.06 0.11 0.06 0.06 0.06
Poland 0.00 0.06 0.10 0.09 0.10 0.08 0.10 0.08 0.08 0.06
Lithuania 0.13 0.13 0.08 0.11 0.13 0.10 0.09 0.08 0.10 0.10
Cyprus 0.00 0.11 0.12 0.11 0.04 0.09 0.16 0.11 0.26 0.11
Hungary 0.00 0.13 0.12 0.14 0.17 0.14 0.20 0.24 0.22 0.11
Latvia 0.14 0.13 0.14 0.19 0.14 0.15 0.16 0.10 0.16 0.14
Malta 0.30 0.06 0.18 0.28 0.23 0.14 0.12 0.11 0.14 0.16
Czech Republic 0.20 0.21 0.23 0.21 0.25 0.22 0.20 0.20 0.20 0.21
Estonia 0.27 0.34 0.29 0.29 0.22 0.24 0.30 0.25 0.25 0.27
Slovenia 0.23 0.42 0.24 0.32 0.26 0.33 0.27 0.25 0.32 0.29
Slovakia 0.36 0.38 0.39 0.40 0.38 0.36 0.31 0.25 0.27 0.34
* 2007-2012 for Romania and Bulgaria Source: own calculations based on FADN data
Pure political rents in EU-15 and EU-12 Member States
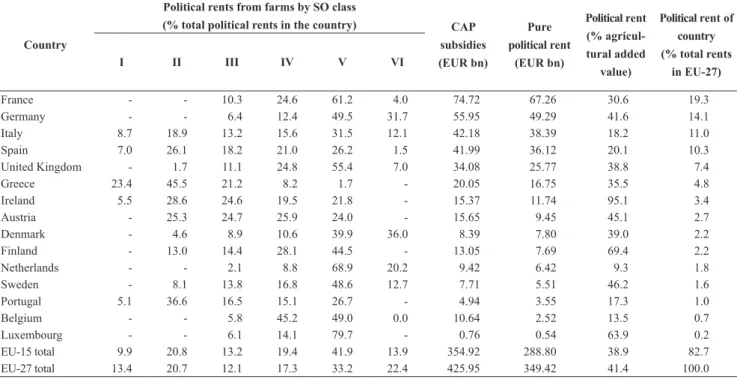
In accordance with the methodology adopted, political rents were computed for farms belonging to various standard output classes over a period of eight years, in the ‘old’ (Table 3) and ‘new’ EU Member States (Table 4). We recall that the values given represent that part of EU agricultural subsidies which has no objective justification either as payment for public goods or as compensation for market imperfections affecting agriculture (leading to high flexibility of agricul- tural prices). They therefore have the features of political
rents. Our analysis is a pioneering attempt to quantify the phenomenon of pure political rent.
There are usually two arguments raised in a discussion on the differences in the per-hectare CAP payments across Member States and the total amount of subsidies resulting from these differences: (a) they exist due to the differences in historical yields, production areas, production volumes and livestock numbers; and (b) the per-hectare direct payments of the individual Member States have been converging, and this process of external convergence is to be continued.
Although both arguments are reasonable, does it change anything in the interpretation of ‘pure rents’ distribution? As aforementioned, the pure rents in our approach has no objec- Table 3: Political rents realised by farms by standard output (SO) class in the EU-15 Member States in the period 2004-2012.
Country
Political rents from farms by SO class
(% total political rents in the country) CAP subsidies (EUR bn)
Pure political rent
(EUR bn)
Political rent (% agricul- tural added
value)
Political rent of country (% total rents
in EU-27)
I II III IV V VI
France - - 10.3 24.6 61.2 4.0 74.72 67.26 30.6 19.3
Germany - - 6.4 12.4 49.5 31.7 55.95 49.29 41.6 14.1
Italy 8.7 18.9 13.2 15.6 31.5 12.1 42.18 38.39 18.2 11.0
Spain 7.0 26.1 18.2 21.0 26.2 1.5 41.99 36.12 20.1 10.3
United Kingdom - 1.7 11.1 24.8 55.4 7.0 34.08 25.77 38.8 7.4
Greece 23.4 45.5 21.2 8.2 1.7 - 20.05 16.75 35.5 4.8
Ireland 5.5 28.6 24.6 19.5 21.8 - 15.37 11.74 95.1 3.4
Austria - 25.3 24.7 25.9 24.0 - 15.65 9.45 45.1 2.7
Denmark - 4.6 8.9 10.6 39.9 36.0 8.39 7.80 39.0 2.2
Finland - 13.0 14.4 28.1 44.5 - 13.05 7.69 69.4 2.2
Netherlands - - 2.1 8.8 68.9 20.2 9.42 6.42 9.3 1.8
Sweden - 8.1 13.8 16.8 48.6 12.7 7.71 5.51 46.2 1.6
Portugal 5.1 36.6 16.5 15.1 26.7 - 4.94 3.55 17.3 1.0
Belgium - - 5.8 45.2 49.0 0.0 10.64 2.52 13.5 0.7
Luxembourg - - 6.1 14.1 79.7 - 0.76 0.54 63.9 0.2
EU-15 total 9.9 20.8 13.2 19.4 41.9 13.9 354.92 288.80 38.9 82.7
EU-27 total 13.4 20.7 12.1 17.3 33.2 22.4 425.95 349.42 41.4 100.0
Source: own calculations based on FADN data
Table 4: Political rents realised by farms by standard output (SO) class in the EU-12 Member States in the period 2004-2012*.
Country
Political rents from farms by SO class
(% total political rents in the country) CAP subsidies (EUR bn)
Pure political rent
(EUR bn)
Political rent (% agricul- tural added
value)
Political rent of country (% total rents
in EU-27)
I II III IV V VI
Poland 15.2 31.7 19.4 12.1 12.3 9.3 24.53 22.36 36.6 6.4
Hungary 5.4 15.7 7.4 14.0 19.0 38.4 11.69 9.62 52.0 2.7
Romania 34.5 12.1 2.8 14.2 20.2 16.2 9.05 8.85 16.1 2.5
Czech Republic - 5.5 4.1 7.7 20.7 62.0 7.85 5.79 64.8 1.7
Lithuania 24.0 29.1 14.6 11.3 13.8 7.2 3.94 3.51 58.7 1.0
Slovakia - - 2.4 6.4 24.4 66.8 4.59 3.05 78.3 0.9
Bulgaria 7.7 8.2 4.4 12.5 38.9 28.4 3.34 2.91 24.1 0.8
Latvia 5.4 28.8 12.0 11.6 25.8 16.4 2.19 1.80 79.1 0.5
Slovenia 13.8 31.0 17.7 25.0 12.5 - 1.99 1.38 40.1 0.4
Estonia - 13.7 9.6 16.3 27.4 33.0 1.29 0.91 44.2 0.3
Cyprus 18.1 24.9 18.6 29.2 9.1 - 0.48 0.34 13.6 0.1
Malta - 25.5 16.4 15.5 42.6 - 0.11 0.09 19.5 0.0
EU-12 total 15.5 20.6 10.8 14.7 22.2 30.9 71.03 60.61 43.9 17.40
EU-27 total 13.4 20.7 12.1 17.3 33.2 22.4 425.95 349.42 41.4 100.0
* 2008-2012 for Bulgaria and Romania Source: own calculations based on FADN data
tive justification (neither as compensation for public goods, nor for the market imperfections), and thus they are simply
‘a waste of resources’ and ‘a loss of overall well-being’, no matter how relatively big they are. So, do the arguments mentioned above legitimise ‘old’ Member States to acquire a bigger share of pure political rents? In this sense as we propose, the pure rent has nothing to do with the yields, pro- duction, livestock number, labour efficiency etc. It has also nothing to do with the size of a country: why might larger countries have the right to waste more public funds and to reduce the social welfare of the European Community more?
So, we argue that the pure rents should constitute compara- ble shares of CAP subsidies in each Member State since the subsidy envelopes agreed for a given programming period are a kind of political consensus. The rent-seeking level in each Member State shall be proportional to this consensus, because it would be naïve to assume that rent-seeking may disappear at all.
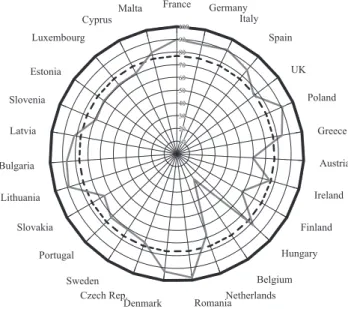
The pure political rents accounted for 77 per cent of the CAP subsidies on average (Figure 1). Assuming that actual CAP subsidies are a ‘fair political consensus’ for each coun- try, there are Member States which profit from bigger shares of pure rents than others. More rents go to the two groups of countries:
• the biggest agricultural producers (such as France, Germany, Italy and Denmark);
• ‘new’ Member States with relatively big shares of agriculture in their national economies (Poland, Romania, Lithuania and Bulgaria). Considering the environmental potential of these countries, is not this a kind of free-riding?
It occurs at the expense of the countries with intensive and productive farming such as Belgium and Netherlands, as well as those with substantial environmental resources (Austria, Finland, Belgium and Slovakia). Intensive farming
is likely to be more affected with market treadmill. For this reason, should some countries receive more compensation from the agricultural policy for market imperfection? Can we also reconsider if the present rent distribution is fair with regard to the countries with valuable environmental resources?
The sum of political rents in the EU in the period under analysis was estimated at close to EUR 350 billion, which is a substantial share of the EU’s entire budget of EUR 860 billion for the years 2004-2013. Analysis of the rent realised per country over the analysed period as a proportion of total political rent in the EU shows that the greatest beneficiaries of rent-seeking are the Member States where agriculture is the strongest, including France (which receives almost one- fifth of the total rent), followed by Germany, Italy and Spain (with 14.1, 11.0 and 10.3 per cent respectively). Hence, farmers in just four countries capture more than one half of the political rents from the CAP. It may be thought that this is linked to the lobbying strength of agricultural organisations from those countries and their engagement in the creation of agricultural policy. Confirmation of this comes from the fact that the EU-15 Member States account for 83 per cent of the total political rents in the EU-27.
Analysis at individual Member State level indicates that it is possible to distinguish those where the value of total realised rent is:
• relatively equal among farms in different standard output classes (e.g. Austria);
• highest among large and very large farms (e.g. the Czech Republic, Slovakia, Hungary, Germany, Den- mark, Finland, the Netherlands and Luxembourg);
• highest among small and very small farms (e.g.
Greece, Lithuania and Romania).
Such a distribution may be a result of the differentiated structures of farms in different Member States, and con- sequent differences in the political importance of the rural electorate associated with particular SO classes. For exam- ple, in Poland approximately one third of political rents are received by SO class II (small farms), and these together with class I (very small farms) account for almost one half of total rents. These classes represent more than 90 per cent of the rural electorate, and as can be seen, Olson’s theory of interest groups, according to which a stronger political influence is exerted by small but well-organised groups, does not apply here. Similar situations exist in Romania, Lithuania and Latvia, where the agrarian structure is again very fragmented, but also in Portugal, Greece, Cyprus and Slovenia. A cautious conclusion can therefore be drawn, that the distribution of political rents corresponds to the structure of farms in a given country, such that the most numerous groups receive the largest pool of political rents. Hence no confirmation is found for the popular opinion that the largest political rents are obtained by sector of the strongest farms.
On the other hand, economic size categories based on SO should be used with caution in this type of analysis because the physical size of farms corresponding to a certain SO class varies widely between Member States due to the differ- ences in market prices, yields and produce quality. Bearing in mind the heterogeneity of farms within each SO class, we
Average share of pure rent
Pure political rent in % of CAP subsidies 100% CAP subsidies Malta
Cyprus Luxembourg
Estonia Slovenia Latvia
Bulgaria Lithuania
Slovakia Portugal
Sweden Czech Rep.
Denmark RomaniaNetherlands Belgium
Hungary Finland
Ireland Austria Greece Poland UK Spain Italy Germany France
10 20 30 40 50 60 70 80 90 100
10 20 30 40 50 60 70 80 90 100
Figure 1: Pure political rents vs. consensus of the CAP EU-27 in 2004-2012.
Source: own estimation using EU FADN and Eurostat data
however believe that the comparison of the relatively small- est farms (I SO in ‘new’ Member States or III SO in ‘old’
Member States) with the highest SO class in the respective country is quite reasonable and gives a general overview for the rent-seeking problem.
A category of note is that of very large farms (SO class VI) in Belgium, where there was no political rent at all in the analysed period, which means that the sum of the subsidies received by a farm, adjusted by payments for the supply of public goods, is not able to compensate for the surplus drain- age caused by price flexibility.
Another issue is the contribution of political rents to the added value from agriculture in a given country, shown in the penultimate column of Tables 3 and 4. On average, in the EU-27 this contribution is 41.4 per cent, and although in the EU-12 it is slightly higher, and in the EU-15 somewhat lower than average, there are Member States in which that value is exceeded almost twofold. We analysed the reason why political rents account for more than 95 per cent of the added value of agriculture in Ireland, and 78 per cent in Slovakia. In all of the extreme cases the problem lies in the low real productivity of agriculture, and not in market imperfections, which affect agriculture in all Member States to a similar degree apart from those with the most intensive farming. Irish agriculture uses a very large quantity of mate- rials – the ratio of indirect consumption to production aver- ages approximately 1 over the year, compared with an EU average of 0.66. A similar conclusion applies to agriculture in Slovakia and Latvia. In the Czech Republic, the cause is rather the relatively high cost of labour.
It can be asked whether such extreme differences in the level of subsidisation of low productivity from the CAP budget is socially just, in terms of the balance of costs and benefits for the community as a whole. What benefits do the EU taxpayer obtain by subsidising highly inefficient agriculture in certain Member States? Naturally, indirect benefits can be found, such as the maintenance of agricultural incomes and thereby the livelihood of rural areas, prevention of depopulation of those areas, and assurance of internal demand for food. This may be an indication of how the CAP could be more effectively modi- fied so as to achieve the desired effects, at least those relating to the supply of public goods. Perhaps countries with structur- ally inefficient agriculture ought to supply more public goods than they do at present, or else subsidise their agriculture to a greater degree from national funds.
Conclusions
The analysis carried out here leads us to conclude that agricultural interventionism in the EU requires a special conceptual approach, since it is not sufficient simply to treat all subsidies as political rents. The new approach we propose provides an indication of how to improve the effec- tiveness of allocation of support for agriculture in individual EU Member States. A principal finding of this study is that, when using the concept of pure political rent, the EU CAP consensus (Figure 1) seems to be much more debatable than is usually believed since some Member States gain unex- pected and unjustified advantages. Moreover, we pointed
out that it is confusing to call all CAP subsides ‘the politi- cal rents’ in terms of the rent-seeking theory. Quantification of the political rent in agriculture enables a more rational and socially-appropriate distribution of support from the CAP in accordance with the agricultural policy goals in the financial framework after 2014. Measuring pure politi- cal rents has revealed a new dimension of inequalities in the distribution of CAP subsidies which particularly badly affect the most productive and the most eco-efficient Mem- ber States. Although the division of payment envelopes between Member States has been decided, since 2014 the CAP has gained flexibility in terms of the structure of both Pillars and transfers between them. These matters remain in the hands of the Member State governments. The prob- lem may be that in many countries the breaking of the link between subsidies and output was reflected more in decla- rations than in facts, and ways are constantly being sought to ‘get round’ that requirement. Such attempts exacerbate King’s effect, and mean that a large share of the subsidies is not capitalised within agriculture, but are captured by sur- rounding sectors. Economic surplus flowed out of farms in the period 2004-2012 through the unfavourable changes of prices, particularly of fertilisers, energy and feedstuffs, but also milk and poultry livestock (Czyżewski and Matuszc- zak, 2017; Czyżewski, 2017) We have in mind here the fact that, for example, investment support goes mainly to the largest farms, where it is subject to the strongest drainage through price flexibility.
Redefinition is also required about the issue of social fairness in the determination of the sizes of national CAP envelopes. The calculations of political rents show that his- torical payments are neither a rational nor a just solution, because the structurally low profitability of agriculture in certain Member States ought to be compensated for by a higher supply of public goods, and this is not happening. On the other hand, the most productive food suppliers and pub- lic goods providers are not proportionally ‘rewarded’ with political rents. Of course, we are being somewhat facetious and we do not claim that the pure political rent is a reward for a productivity or eco-efficiency. But in fact, the present CAP consensus seems to be the least favourable for the Member States that are leaders in productivity and eco-efficiency.
Acknowledgements
The article was written by the project funded by the National Science Centre in Poland on the basis of the deci- sion: OPUS 6 UMO-2013/11/B/HS4/00572, No. 51104-84
‘Political rents in the European Union’s agriculture - com- parative analysis basing on the EU-27’.
References
Acemoglu, D. and Robinson, J. (2000): Political losers as a barrier to economic development. American Economic Review 90 (2), 126-130. https://doi.org/10.1257/aer.90.2.126
Acemoglu, D. and Robinson, J. (2006): Economic backwardness in political perspective. American Political Science Review 100 (1), 115-131. https://doi.org/10.1017/S0003055406062046