everyone): Examining main socio-demographic and territorial differences in use of leisure time
László Kökény Corvinus University of Budapest, Marketing Institute E-mail:
laszlo.kokeny2@uni-corvinus.hu Kornélia Kiss Corvinus University of Budapest, Marketing Institute E-mail:
kornelia.kiss@uni-corvinus.hu
Keywords:
leisure activities, regional differences, personality, generations, Big Five Factor
Some people spend their leisure time dealing with ’obligations,’ whereas others spend it more freely. This depends on several factors, including external (opportunities, location) and internal attributes, individual characteristics (demographics, personality, attitudes, values). This research focuses on differences identified in activities people undertake based on factors affecting individual characteristics. Main socio- demographic factors, including territorial dimensions and personality characteristics, were analysed. The research was conducted with a sample of more than 800 people in 2019. Our study is based on a slightly modified version of the HCSO time use questionnaire. Respondent personality types were identified by the Big Five Factor test.
Besides basic descriptive statistics, cluster analysis, Kruskal–Wallis, and Chi-square tests were used in our analysis. The analysis of regional characteristics shows that Budapest residents more often go to theatre, cinema, exhibition or restaurant as well as more often make domestic or foreign trips than rural people. Housework, pets, religion and parenting play a greater role in the lives of rural town dwellers. Research results on personality types show a connection between personality traits and individual leisure activities. Overall, intergenerational differences are greatest in leisure activities depending on place of residence, personality traits, and entertainment options available (theatres, cinemas, exhibitions, etc.). Practical implications and future research opportunities are discussed at the end of the study.
Introduction
For some people, social or physiological responsibilities take up most of their time, and some can or want to take more time for other activities besides their obligations. These attitudinal and or will factors tend to be different, which may be influenced by simple or complex factors.
The three different – physiological, socially bound, and freely undertaken – types of activities are the three categories that are constantly competing with each other.
In addition to the environmental conditions, the demographic and other individual characteristics of the person, including socialization, are also influential. Several research show differences in age, gender, place of living, education, and occupation for different activities (Kemperman–Timmermans 2008, Wong et al. 2008, HCSO 2010, Marques et al. 2015, 2016, Kovács–Bodnár 2017, Biernat–Piatkowska 2017, Rada 2017, Hayes et al. 2018, Kono et al. 2018, Kizilirmak–Kose 2019). The links between personality types and leisure activity factors also have been explored in the last couple of years (Kristensen–Pedersen 2017, Przepiorka–Blachnio 2017, Zhou et al. 2017, Abdullahi et al. 2020). Mostly, however, researchers tried to highlight only one element in their research. It can be seen that regularly 1) a limited number of influencing characteristics were analysed, 2) a limited number of leisure activities were analysed, and 3) most of the researchers placed much emphasis on Internet usage analyses without trying to differentiate the so-called classic leisure time (off- line freely done activities) depending on the personality type (Kuo–Tang 2014, Mark–Ganzach 2014, Przepiorka–Blachnio 2017, Zhou et al. 2017).
Our research examines the socio-demographic and psychological differences in people’s activities in 2019. It is based on the questionnaire of the Hungarian Central Statistical Office (HCSO 2010, 2013), completed and slightly modified at certain points. Thus socially bound activities and freely conducted activities were measured using forty-one different items. The aim was to organise the respondents into segments based on the given items. We then looked for differences between the respondents regarding socio-demographic and psychological characteristics to determine who was doing what. Thus, it was possible to group the respondents and describe them better according to their leisure activities. Based on previous research, it was strongly assumed that certain demographic and psychological characteristics impact certain activities’ performance. Our third objective was to quantify the role of the different influential factors.
Literature review
In this chapter, research findings on socio-demographic and psychological differences regarding freely done activities are presented.
Leisure
In advanced societies, leisure became “a defining feature of the way we live, work, and spend our free time” (Page–Connell 2010, p. 1). Nowadays, it can be seen as a complex phenomenon with many different meanings for different segments. Leisure gives us personal enjoyment, relaxation, personal satisfaction, a sense of pleasure, and the opportunity to do something different from daily routine activities. Leisure activities have many positive effects on the human being: they reduce stress, generate positive feelings, strengthen social connections, and make us balanced and contribute to our well-being (Iso Ahola–Mannell 2004). According to Ateca- Amestoy et al. (2008) and Spiers and Walker (2008), the phenomenon of leisure is highly related to well-being. In their opinion, leisure time provides excellent opportunities to improve well-being. Leisure activities can revitalise us from the daily routine and contribute to relaxation and stress-reduction. The research of Jeffres and Dobos (1993) and Iwasaki et al. (2005) focus on the role of leisure time activities in stress-management. Haworth (2011), however, says that leisure time activities can also contribute to the increase in stress levels, such as extreme sports.
Leisure time activities can be grouped in several ways. Mannell and Kleiber (1997) suggest six leisure time activity groups: 1) Physical activities: fitness, sports, 2) Relaxation: reading, listening to music, 3) Outdoor recreation: walking, hiking, nature-based activities, 4) Cultural activities: concerts, theatre, museums, 5) Hobbies: drawing, painting, sewing, DIY activities, 6) Leisure travel: visiting festivals, city breaks. Bull et al. (2003) define leisure time as four different activity groups that can be pursued daily, selected freely: 1) rest (watching TV or reading), 2) amusement watching a series), 3) education (undertaking adult education) and 4) participation (in sporting activities). Csíkszentmihályi (1997) divided leisure activities into separate categories according to the level of skill and challenge required. Sport and playing, hobbies, social activities, thinking and reflection, listening to music, and watching television are the six activities studied and listed in descending order, depending on the ability and challenge they require from their performer.
Measuring and monitoring working and leisure time activities are crucial in advanced and in less developed economies. The tool of statistical measurement is the so-called time-use survey, which aims to report data on how people spend their time on average, giving us a holistic picture about time use of nations and different demographic groups (e.g., age and gender, place of residence, disposable income) of a society.
Socio-demographic differences in leisure use
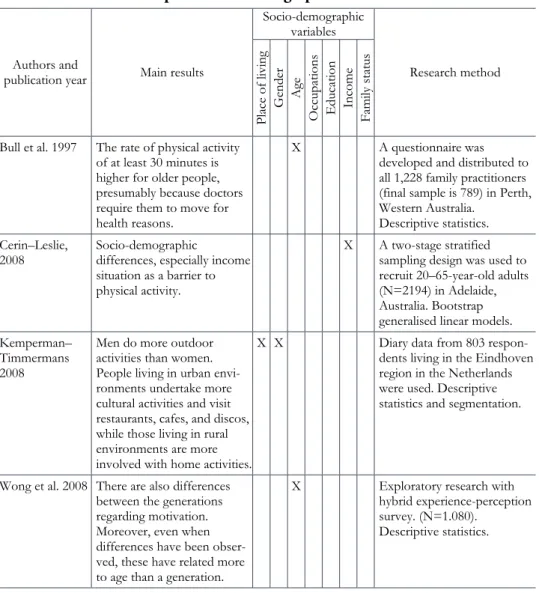
Table 1 shows the most frequently examined topics of the socio-demographic differences in leisure use researches. Most research results were related to comparing age groups, generations, and genders. Additionally, there is a relatively large amount of research on place of living, education, and occupation. In addition
to recent research in the past few years, there are older classical works in which we have found examples of leisure-time analyses along socio-demographic characteristics.
Most men living in urban environments and young, middle-aged people are active in leisure time. However, the older respondents were associated with inactivity, and respondents with lower-income and higher education levels can be described by reduced leisure time consumption.
Table 1 Literature on the topic of socio-demographic differences in leisure use
(Table continuous next page.) Authors and
publication year Main results
Socio-demographic variables
Research method
Place of living Gender Age Occupations Education Income Family status Bull et al. 1997 The rate of physical activity
of at least 30 minutes is higher for older people, presumably because doctors require them to move for health reasons.
X A questionnaire was developed and distributed to all 1,228 family practitioners (final sample is 789) in Perth, Western Australia.
Descriptive statistics.
Cerin–Leslie,
2008 Socio-demographic
differences, especially income situation as a barrier to physical activity.
X A two-stage stratified sampling design was used to recruit 20–65-year-old adults (N=2194) in Adelaide, Australia. Bootstrap generalised linear models.
Kemperman–
Timmermans 2008
Men do more outdoor activities than women.
People living in urban envi- ronments undertake more cultural activities and visit restaurants, cafes, and discos, while those living in rural environments are more involved with home activities.
X X Diary data from 803 respon- dents living in the Eindhoven region in the Netherlands were used. Descriptive statistics and segmentation.
Wong et al. 2008 There are also differences between the generations regarding motivation.
Moreover, even when differences have been obser- ved, these have related more to age than a generation.
X Exploratory research with hybrid experience-perception survey. (N=1.080).
Descriptive statistics.
(Continued.)
(Table continuous next page.) Authors and
publication year Main results
Socio-demographic variables
Research method
Place of living Gender Age Occupations Education Income Family status Suija et al. 2010 Rural people were found to be
more active than city dwellers.
The rate of physical activity of at least 30 minutes is higher for older people, pre-sumably because doctors require them to move for health reasons.
Employees and retired people are more active than students and the unemployed.
Those with a high school qualification measured higher socially engaging activity, which may be related to the fact that those with higher education work more and have less free time.
X X X X 198 female family doctors completed the questionnaire in Estonia.
Descriptive statistics.
Tucker et al.
2011 Men were found to be more
active. X Using data from the NHANES 2005–2006, self- reported questionnaire aged>20. (N=4.773).
Descriptive statistics and Spearman correlation.
Hallal et al. 2012 Men were found to be more
active. X For adults (15 years or older) from 122 countries and adolescents (13–15-years-old) from 105 countries.
Descriptive statistics.
Marques et al.
2015 Men with better financial circumstances and middle- aged women with a modest economic situation are most likely to do the recommended level of physical exercise.
X X X Self-administered question- naires were completed by Portuguese school teachers, school staff members, and parents. (N=2.459).
Descriptive statistics and Chi-square test or Mann- Whitney test
Murtagh et al.
2015 Men were found to be more active.
Increasing age was associated with inactivity among males and females.
X X 4892 adults aged 60+ from the Irish Longitudinal Study on Ageing. Chi-squared statistics and forced entry logistic regression were used
(Continued.)
(Table continuous next page.) Authors and
publication year Main results
Socio-demographic variables
Research method
Place of living Gender Age Occupations Education Income Family status Marques et al.
2016 Deemed factors such as age, education, occupation, place of living, income, and the number of people living in the household are distinctive factors that significantly affect physical activity.
X X X X X According to national options, participants were sampled utilizing postal code address files, population registers, social security register data, or telephone books. (N=39.278).
Descriptive statistics and Chi-square test or Mann- Whitney test
Lusmägi et al.
2016 Estonian younger age groups (Z, Y generation) with higher education levels and living in the capital city in a single relationship tend to undertake more active and moderate physical activities, and women were found to be more active.
X X X X Interviews were conducted by using the CAPI. The National Physical Activity Survey (NPAS) was organised by the Estonian Olympic Commit- tee. The population of the NPAS was composed of the permanent residents of Estonia, aged 15–74 years old. (N=1.009).
Descriptive statistics and ordinal regression model Shirish et al.
2016 There are also differences between the generations regarding motivation. More- over, even when differences have been observed, these have related more to age than the generation.
X Delphi technique, employing a structured qualitative approach. Students from a French business school MBA program.
Kovács–Bodnár,
2017 Rural people can spend their leisure time in a very different way than urban people. Other individual factors play a role, depending on where you live.
X Focus on the rural sub- regions of Hungary, which they investigated using partial least squares (PLS) path analysis.
Biernat–
Piatkowska 2017 Employed women engaged in vigorous exercises more often than those who were unemployed.
X A sample (N=527) of Polish women. The long-form of the International Physical Activity Questionnaire (IPAQ-LF).
Chi-square test. Multi- variable logistic regression.
(Continued.)
Regarding the Hungarian population, the time-use survey (HCSO 2010) shows that young people undertake the broadest range of leisure activities. Many of them spend a considerable time on active recreation, sports, exercise, excursions and comparatively less time on watching television and reading (compared to browsing the Internet). The active, earning age groups have the least time. They typically spend their time at work, manage their affairs, raise children, and run a household.
They do little to relax, to cultivate themselves, and to exercise. Age is the most decisive factor determining activities. Overall, among 17–84 year-olds, the most frequent leisure activity is spending time with friends. The rarest activity is playing a role in non-governmental organizations or visiting the library. Gender discrepancies exist because women engage in cultural activities, while men participate in sporting activities. According to their qualifications, those with secondary education appear
Authors and
publication year Main results
Socio-demographic variables
Research method
Place of living Gender Age Occupations Education Income Family status Rada 2017 Women and urban respon-
dents watch TV, older people spend more leisure time this way than young people and men are more likely than women to participate in sports, exercise.
X X X Questionnaire data were obtained from 497 respondents aged 35–74.
Pearson chi-square test was performed.
Hayes et al. 2018 There are also differences between the generations regarding motivation. More- over, even when differences have been observed, these have related more to age than the generation.
X The Occupational Personality Questionnaire and the Moti- vation Questionnaire. The sample was made up of 3,535 managers and professions.
Descriptive statistics.
Kono et al. 2018 Disability and education’s effects appeared stronger than other variables’ influences.
X X The representative survey of the U.S. residents in all 50 states (N=441.496).
Multinomial regression analysis.
Kizilirmak–Kose
2019 Age, education level, marital status, health status, employ- ment status, child care time, and household income level display significant associa- tions with time spent on different leisure activities in Turkey.
X X X X 25.109 individuals above the age of 10 from 9.073 households.
Descriptive statistics and correlation analysis.
to be the most active. In the publication on ”Our Cultural Habits” (HCSO 2013), other demographic differences were discovered associated with each activity. Mainly rural pensioners, the unemployed and those with lower education watch television.
Reading is most common among those living in Budapest, the higher educated, retired, or living in other big cities in other counties.
In sum, if only one socio-demographic variable is highlighted, then there are several others which are not, either through this variable or moderating it, making it difficult to identify each factor’s influence. Sometimes, one element’s influence is more decisive; in other cases, it is another one. In most cases, several socio- demographic variables influence people’s propensity to undertake different leisure activities, and it is hard to isolate the effects of a single variable. In his methodological work on tourism and leisure-focused research, Veal (2018) emphasises that market segmentation based on socio-demographic and psychological characteristics in industries in which the individual’s character and attributes are very determinant can be relevant.
The impact of personality types on leisure time
The question arises as to what kind of personal motives exist behind leisure activity choices besides the socio-demographic characteristics discussed. Personal taste and preference vary according to attitudes, values, and motivation, all affecting leisure time. These characteristics are influenced by our childhood socialization, our established patterns, our inherent characteristics, and our habitus or social norms.
These characteristics are also related to socio-demographic elements and vice versa, and behind the socio-demographic elements, there are other direct or indirect variables. It may not occur to somebody to go to the opera in the evening because they would not think of it and not because of their socio-demographic characteristics (Haywood et al. 1995, Bull et al. 2003).
Table 2 summarises studies of differences in personality types observed during leisure time use. The most common personality type factor was Extraversion;
furthermore Neuroticism, Openness to new experiences, and Agreeableness appeared in similar proportions.
Table 2 Literature on the topic of personality types differences in leisure use
(Table continuous next page.) Authors and
publication year Main results
Personality types
Research method
Extraversion Agreeableness Openness Conscientiousness Neuroticism Costa–McCrae
1988 Between the ages of 21 and 96, over time, there was a slight decline in activity, openness, initiative, and positive feelings.
Besides, it was shown that respondents’ personalities are stabilizing over the age of 30.
X Self-reports (N=983) and spouse ratings (N=167) were gathered on the NEO Personality Inventory. Cross-sectional and longitudinal analyses
Lu–Hu 2005 Extraversion significantly and positively correlated with leisure satisfaction, while Neuroticism was significantly negatively cor- related with leisure satisfaction.
X X The representative sample of Chinese university students (N=423).
Correlation analyses, Multiple Regression Analyses.
Barnett–Klitzing
2006 The more Extroverted people were, the sooner they would start to get bored, while the rest of the respondents were not noticeable.
X Group-administered questionnaires to 999 university students.
Multiple regression analyses.
Nia–Besharat
2010 There is a difference between the personality of teams and individuals.
X X X X X 134 athletes (92 teams, 42 indivi- duals, 88 males, and 46 females) completed the NEO Personality Inventory-Revised (NEO-PI-R) and the Sociotropy-Autonomy Scale (SAS). Validated segmentations.
Mark–Ganzach
2014 Extraversion is correlated with the most different internet activities and Neuroticism, and Conscientiousness are signi- ficantly correlated with global (general) usage of the Internet.
X X X U.S. sample of over 6900 young adults with an average age of 26.
National Longitudinal Survey of Youth.
Descriptive statistics and segmentations.
Kuo–Tang 2014 The findings confirmed that the high Extraversion and Openness of people who liked to socialise on Facebook also liked to socialise in real life. They tend to spend more time on team sports and recrea- tional activities. Still, those with low Agreeableness and low emo- tional stability (low Neuroticism) liked to use Face-book for sociali- zing in place of real-life socializing.
X X X X A questionnaire with 30 items was developed, and the convenient sampling technique was used to collect data from 500 college students in Taiwan.
Descriptive statistics, independent t-tests, ANOVA.
(Continued.)
(Table continuous next page.) Authors and
publication year Main results
Personality types
Research method
Extraversion Agreeableness Openness Conscientiousness Neuroticism
Naude et al.,
2016 Positive personalities such as Extraversion and Openness to experience correlated well with leisure life and happiness.
X X The target population consisted of 3032 casino employees, who received the questionnaires and were allowed to complete the questionnaires anonymously.
Confirmatory factor analyses (CFAs), correlations, and regression analyses.
Kristensen–
Pedersen 2017 Work-life balance can be under- stood as processes of continuous modulation of various pre- individual aspects of work and life, and not as a contradiction between two already constituted forms, which are often described in work-life balance literature as organizational factors and as individual factors.
X X X X X Qualitative data gathered at a global biotech firm.
Przepiorka–
Blachnio 2017 “The Socializing with Friends”
scale correlates positively with stimulation seeking, activity, endurance, extraversion, hedonistic present, and self- liking.
“Using the
Internet” correlates positively with stimulation seeking, activity, extraversion, hedonistic present, and positive past, and negatively with openness to experience and action-oriented decision-making.
“Leisure Time Management”
correlates positively with stimulation seeking, self- discipline, and hedonistic present.
“The Winding Down” subscale correlates positively with self- discipline, future, and positive past.
X X A total of 806 adults took part in two studies. As a result of exploratory and confirmatory analyses conducted, a 16-item was developed. Leisure Time Activity Questionnaire was used.
(Continued.)
The analysis of personality types in marketing and the associated sciences has started to be addressed in the last decade. Therefore, these studies are more recent.
Based on these research studies, the analysis of the relationship between personality types and leisure time is largely based on Internet use, and in earlier research studies
”off-line” leisure activities appear relatively infrequently.
Methodology
Quantitative analysis was used for the research. We chose the quantitative methodology because the research presented in Tables 1 and 2 is more of
Authors and
publication year Main results
Personality types
Research method
Extraversion Agreeableness Openness Conscientiousness Neuroticism
Zhou et al. 2017 Agreeableness and conscien- tiousness were negatively asso- ciated with Internet Addiction (IA), whereas extraversion, neu- roticism, and openness to expe- rience were positively associated with IA.
Conscientiousness had an indi- rect impact on adolescent IA through decreased emotion-focu- sed coping, whereas extra-versi- on, neuroticism, openness to experience had indirect impacts on adolescent IA through increa- sed emotion-focused coping. In contrast, problem-focused coping had no mediating role.
X X X X X 998 adolescents, Chinese Big Five Personality Inventory.
Descriptive statistics,
segmentation and path analysis.
Abdullahi et al.
2020 For users high in Agreeableness, the design should focus on promoting their feelings of Happiness and Social Well- being.
For users who exhibit Neuroticism, designers should focus on designing to promote Psychological well-being and Emotional well-being.
X X The study focuses on Africans (N=732).
Structural Equational model (SEM) analysis, specifically, Path Analysis using.
quantitative, descriptive analysis. However, we also examine the relationship strengths and statistical differences between the factors. The research was conducted in 2019. An online and off-line questionnaire was used, consisting of three parts. Due to the large sample, the online survey was mainly justified, but we were able to reach the older generations1 with a paper-based questionnaire. In the first part, there were activities related to leisure time, based on the Hungarian Central Statistical Office publications, mainly in the second and third type, i.e. from socially bound and freely undertaken activities, which was completed and slightly modified at certain points. Forty-one, different activities were measured.
Respondents had to indicate the frequency with which the activity was undertaken within the year before the survey.
In the second part of the questionnaire, the respondents had to complete a personality test based on a NEO-PI-R consisting of 30 adjectives within the framework of the Big Five Personality Type Analysis. The Big Five Factor test itself consists of simple, short statements. Although simple assertions are generally psychometrically inferior to more complex statements, there are numerous advantages. The structure of the test can range from 10 simple statements up to 100 statements. The most well-known is the 240 statement series developed by Costa and McCrae in 1992 (Costa–McCrae 1992). It has a reduced version of 60 questions, but compared with Goldberg’s (1992) 100 test series, these are among the most popular. These complex reductions have resulted in 44, 30, 25, 10, and 5 statements, mainly due to Internet-based queries. From the 30 adjectives, we created the five personality types based on the Manual of Costa and McCrae (1992).
The third part of the questionnaire contained demographic questions. Here respondents were asked about their age, gender, education, occupation, type of place of living, postal code, children under 18 in the household, weekly working hours, and how far the monthly expenses were covered. Metric and non-metric scales were used in this question block.
Data analysis
Parametric and non-parametric analytical methods were employed based on the scales. The aim was to reduce variables, and to segment the activities performed into clusters based on some socio-demographical or psychological aspect, and to identify the significant differences between the created segments according to psychological factors. We attempted to form factors from the activities, but too many and logically meaningless factors were created with the use of Eigenvalue (at least 60% of the total variance explained). Therefore, cluster analysis seemed more appropriate. The
1 We defined the generations as Kasasa (2020): Baby boomers were born between 1946 and 1964; Gen X was born between 1965 and 1980; Gen Y, or Millennials, were born between 1980 and 1994; Gen Z is the newest generation to be named and were born between 1996 and 2015.
https://www.kasasa.com/articles/generations/gen-x-gen-y-gen-z
hierarchical cluster analysis was performed using the Ward method and dendrogram analysis. Then the K-means cluster procedure was performed on the cluster based on the researcher’s decision. In the absence of a normal distribution, the Kruskal–
Wallis test used in non-parametric procedures was used for the analysis between metric and non-metric variables, while non-metric, discrete variables were compared using a Chi-square test. For connection strengths, the Eta2 of the Kruskal–Wallis H- test statistic was calculated (Tomczak–Tomczak 2014), while in the Chi-square test, the relationship strengths were determined with Cramer V values (Malhotra–Simon 2009).
The basis for cluster analysis was leisure activities. For this, it was necessary to standardise these variables. Questions were measured on a 1–6 interval scale. The frequency of the activity, where ”1” is ”Not undertaken”, ”2” is ”Once a year”, ”3”
is ”Once a quarter”, ”4” is ”Monthly”, ”5” is ”Weekly or more often” and ”6” is
”(Almost) daily”, was noted. Strictly considered, this is a metric variable that takes on nominal features, because if one chooses the value ”6”, it does not drive that activity six times more (instead of probably 365 more times) than the one who selected response ”2”. Similar problems can be found in the literature when evaluating the Likert scale, where if someone chooses a ”5”, he does not necessarily agree five times more with the given question than the one who chooses only ”1”
(Kovács 2004, Malhotra–Simon 2009, Kovács et al. 2011). We treat it as a metric scale because we analyse the frequencies and the differences between them can be identified, not with a nominal scale where, for example, we would only view and scale the place of the living variable. Therefore, cluster analysis may also be performed because Likert scale-based questions can also be clustered after standardization. Respondents could only identify one alternative. The goal was to examine the differences between the activity-based clusters performed according to socio-demographic and personality types.
Sampling method and hypotheses
Initially, the sample contained 984 people, and only 817 of them were included in the cluster analysis (respondents who did not answer one question in the personality test, and those who did not fill in the questionnaire in a reasonable time – the outliers – were excluded). The respondents were university students and their acquaintances and relatives. By using the snowball method, we could reach all generations. Additionally, the students, their relatives, friends and their acquaintances were included in the sample, which is a limitation in the generalizability of the results. Overall, the sampling type is a mixed methodology which contains convenience and snowball sampling. The questionnaires were filled through an online link. Paper-based questionnaires were also provided.
According to the literature review, segments seem to be identifiable based on how people spend their leisure time. This suggests that there may be activities that
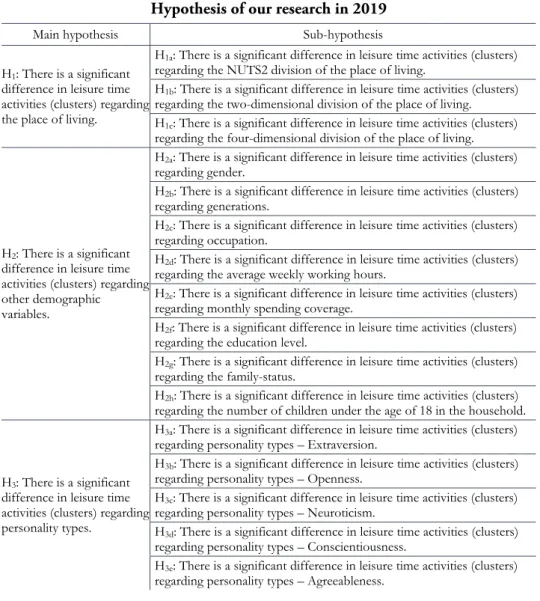
have a common dimension along a variable. We believe that the activities undertaken can be organised into clusters, not only on how frequently they undertake the activity. This clustering criterion may be age, education, monthly income, place of living, activity level, personality or other socio-demographic factors. During our research, we formulated ten hypotheses. About the place of living, we assumed that there might be significant differences between locations (NUTS2, urban vs. rural, capital vs. county town vs. another town vs. village).
Table 3 Hypothesis of our research in 2019
Main hypothesis Sub-hypothesis
H1: There is a significant difference in leisure time activities (clusters) regarding the place of living.
H1a: There is a significant difference in leisure time activities (clusters) regarding the NUTS2 division of the place of living.
H1b: There is a significant difference in leisure time activities (clusters) regarding the two-dimensional division of the place of living.
H1c: There is a significant difference in leisure time activities (clusters) regarding the four-dimensional division of the place of living.
H2: There is a significant difference in leisure time activities (clusters) regarding other demographic variables.
H2a: There is a significant difference in leisure time activities (clusters) regarding gender.
H2b: There is a significant difference in leisure time activities (clusters) regarding generations.
H2c: There is a significant difference in leisure time activities (clusters) regarding occupation.
H2d: There is a significant difference in leisure time activities (clusters) regarding the average weekly working hours.
H2e: There is a significant difference in leisure time activities (clusters) regarding monthly spending coverage.
H2f: There is a significant difference in leisure time activities (clusters) regarding the education level.
H2g: There is a significant difference in leisure time activities (clusters) regarding the family-status.
H2h: There is a significant difference in leisure time activities (clusters) regarding the number of children under the age of 18 in the household.
H3: There is a significant difference in leisure time activities (clusters) regarding personality types.
H3a: There is a significant difference in leisure time activities (clusters) regarding personality types – Extraversion.
H3b: There is a significant difference in leisure time activities (clusters) regarding personality types – Openness.
H3c: There is a significant difference in leisure time activities (clusters) regarding personality types – Neuroticism.
H3d: There is a significant difference in leisure time activities (clusters) regarding personality types – Conscientiousness.
H3e: There is a significant difference in leisure time activities (clusters) regarding personality types – Agreeableness.
We divided our hypotheses into three groups (Table 3). In the first, there are sub-hypotheses in which we deal with the relationships between respondents’ place
of living in leisure consumption in three ways. The second group included a multitude of sub-hypotheses about the other demographic variables, similarly, in leisure consumption. Finally, the third group contains sub-hypotheses about the assumption of association differences by personality type regarding leisure consumption.
Findings and discussion
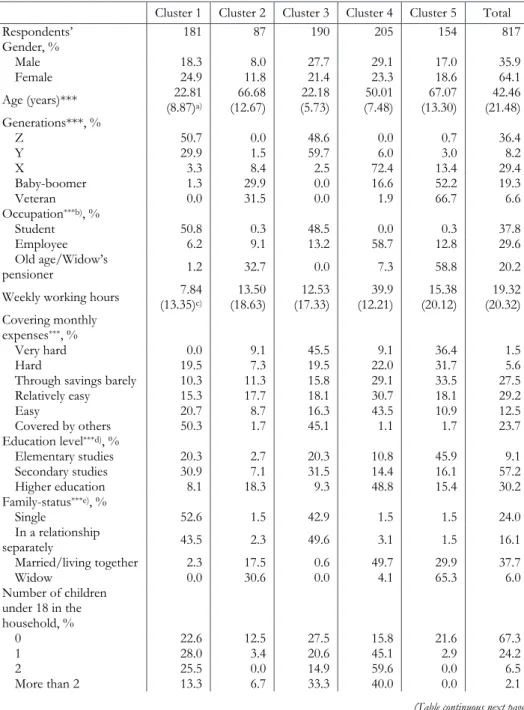
In the sample, 35.9% of the 817 respondents were men, and 64.1% were women.
The average age was 42.46 years, 45 years was the median, the mode was 20 years (119 people), and the standard deviation was 21.48 years. Further sample averages and cluster distributions are summarised in Table A1 (see in Appendix). For each question, only one answer could be selected by the participants involved in the research. Budapest residents were overrepresented by place of residence (in the sample 29.7%, according to HCSO census for 2011 it is 17.4%) and those living in villages were slightly underrepresented (in our sample 21.9%, country average is 30.5%). Additionally, secondary educated (43.8%) and higher educated (14.4%) people were overrepresented compared to the 2011 census. The average age in the sample is almost similar to the country average. Still, the proportions of generations are different (Generation “Z” is over-represented and “X” is under-represented).
Cluster analysis and its results
A standardisation of variables is needed to create clusters. The square Euclidean distance was chosen as a measure of hierarchical cluster analysis, including the Ward method (Malhotra–Simon 2009). Then, the standardised element of forty-one leisure time activities was examined. The number of clusters was unknown to this point. The principal component analysis suggested ten factors; if the averages and the number of elements in each category are considered, then the optimal cluster can be between five and nine. Based on the outputs, first, the coefficients of the pooling scheme were examined. The coefficients had not yet doubled; they increased only in the last two steps, i.e., in the case of two or three clusters where the coefficient seemed to increase slightly compared to the previous one (half of the last coefficient would be somewhere in the 50 cluster solution that cannot be interpreted). If we examine the variables, cluster number 13 would be optimal. Then we switched to the dendrogram test. The point of the ‘big jump’ had to be examined. As a rule of thumb (Kovács 2014, Szüle 2018), the separator line is drawn at the 8 or 10 value to break the pairs. The essence of the method and the basis for defining clusters are determined by examining where the jump is high during the pairing. Three clusters could be created according to the big jump and the value of 8 or 10. Considering that 50 clusters are possible, the five cluster solution was chosen for our analysis.
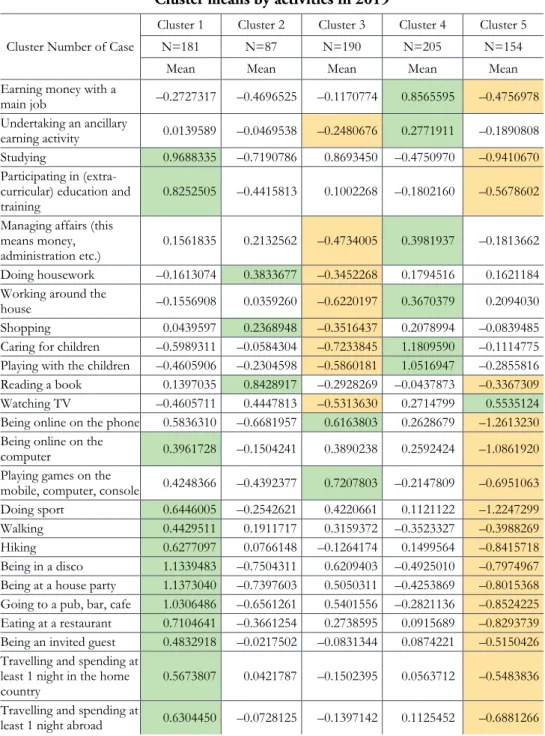
The activities undertaken are grouped in Table A2 (see in Appendix) according to the five clusters created. We highlighted the most and the least characteristic variables in the given cluster and segmented the respondents accordingly. Light grey marked the most characteristic activity for the clusters, while light orange marked the least characteristic cluster for that activity.
Five cluster solution
The study of the five clusters was carried out to highlight the key features affecting the activities of 817 people involved in cluster analysis. The first cluster had 181 respondents, the second had 87, the third had 190, the fourth had 205, and the fifth had 154. Cluster 1 had very active respondents, and Cluster 3, and 5 had passive respondents. Cluster 4 was a group of respondents with many family responsibilities, namely parents with children. Cluster 2 also included respondents who were more active but mostly engaged in activities around the house. These results are consistent with the literature and suggest that demographic features may be worth exploring (as in Table A2). We found significant differences in almost all demographic characteristics. The Kruskal–Wallis test and the non-metric variables as the Chi-square test were used to prove or reject the hypothesis. The strength of the effects was measured by Eta2 and Cramer V indicators. Except for the two- dimensional place of living variable, gender and Neur oticism variable, the other elements were significant at 1%. Gender was significantly different, at 5%.
We examined the dimension of place of living in several ways because the prior research in other fields allowed the authors to conclude that it is worth examining this element according to different distributions (Jászberényi et al. 2017), and in the Hungarian studies, the two-dimensional (urban vs. rural) research was preferred (Kóti 2019, Kovács–Bodnár 2017, Kovács 2017). Table A2, in the Appendix, shows the cluster means summarised by activities.
Discussion
Clusters presented in Table A2 could be sorted regarding activity and passivity.
Based on the frequency of activities, Clusters 1 and 2 are more active, Clusters 3 and 5 are more passive and Cluster 4 is in the middle. Our foreknowledge was confirmed, i.e. two ”young” (Cluster 1 and 3) and two ”older, senior” (Cluster 2 and 5) groups were formed.
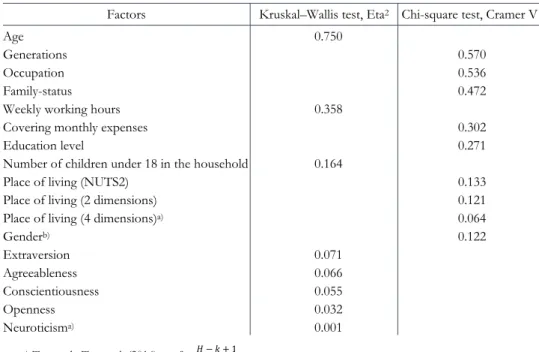
In all the cases, there were indicative differences. Significant Eta2 and Cramer V values range between 0.032 and 0.750 (see Table A3 in the Appendix). In the cluster formation, first, the age difference and generation were the most differentiating factors as evidenced by the high Eta2 and Cramer V values. Additionally, regarding occupation, family-status and weekly working hours, a strong explanatory power can be argued. There is a difference of 5% in the case of genders, but there is no significant difference in the two-dimensional (urban vs. rural) case. Still, the other
two places of living type categories (NUTS 2 and the-four-category) show a weak, moderate test strength. All this means that there are differences in the place of living because in Budapest there are many more community programs (presumably due to the characteristics of the place and the high population density) than in rural settlements. Therefore, territorial categories are also likely to have an indirect impact; they do not show strong test results for differences like in the studies of Kovács and Bodnár (2017) or Marques et al. (2016). The result shows that there are categorizations where significant differences can be found, probably due to the larger sample of Budapest residents.
Regarding personality types, the resulting T-values can be interpreted as follows for the different main factors: 56 or above is high value, between 45 and 55 is medium, the low value is in 44 or below (Costa–McCrae 1992). In our sample, the averages and distributions are summarised in Table A4 (in the Appendix).
Additionally, in some cases, personality types are also different within age groups.
However, Conscientiousness (Eta2 is 0.055) and Agreeableness (Eta2 is 0.066) are higher for the elderly, and Extraversion is the most typical for the young (Eta2 is 0.071) and Openness for adult parents (Eta2 is 0.032). In Extraversion, it can be seen that even within the age group there may be a difference of up to 10 percentage points in favour of more active young people. Regarding results, we found that relatively low Eta2 values were obtained based on personality types, and no significant difference was found in the case of Neuroticism. This leads to the conclusion that personality is probably an indirect element in the model, i.e., it is possible to organise leisure activities into groups according to other factors. In the creation of several clusters, it is possible to obtain higher Eta2 values. Still, these small values are also characteristic of the personality types based on the literature (Jani–Han 2014).
Overall, it is clear from our research that age is the most influential factor, and its effect will likely resonate in other demographic and psychological variables. This may be why the analysis of all demographic and psychological variables has not yet been addressed together in a single study in the literature review. Additionally, age primarily influenced the way clusters were named, predicting that test variables would be strongest for this variable. Overall, Table 4 shows the accepted and rejected hypotheses.
Table 4 Accepted and rejected hypothesis in 2019
Main hypothesis Sub-hypothesis Accepted/Rejected Cramer
V values Eta2 values
H1: There is a significant difference in leisure time activities (clusters) regarding the place of living.
H1a: There is a significant difference in leisure time activities (clusters) regarding the NUTS2 division of the place of living.
Accepted (p<0.001) 0.133
H1b: There is a significant difference in leisure time activities (clusters) regarding the two-dimensional division of the place of living.
Accepted (p<0.001) 0.121
H1c: There is a significant difference in leisure time activities (clusters) regarding the four-dimensional division of the place of living.
Rejected 0.064
H2: There is a significant difference in leisure time activities (clusters) regarding other demographic variables.
H2a: There is a significant dif- ference in leisure time activities
(clusters) regarding gender. Accepted (p<0.005) 0.122 H2b: There is a significant dif-
ference in leisure time activities
(clusters) regarding generations. Accepted (p<0.001) 0.570 H2c: There is a significant dif-
ference in leisure time activities (clusters) regarding occupation.
Accepted (p<0.001) 0.536 H2d: There is a significant dif-
ference in leisure time activities (clusters) regarding the average weekly working hours.
Accepted (p<0.001) 0.358 H2e: There is a significant
difference in leisure time activities (clusters) regarding monthly spending coverage.
Accepted (p<0.001) 0.302 H2f: There is a significant
difference in leisure time activities (clusters) regarding the education level.
Accepted (p<0.001) 0.271 H2g: There is a significant
difference in leisure time activities (clusters) regarding the family-status.
Accepted (p<0.001) 0.472 H2h: There is a significant
difference in leisure time activities (clusters) regarding the number of children under the age of 18 in the household.
Accepted (p<0.001) 0.164
(Table continuous next page.)
(Continued.) Main hypothesis Sub-hypothesis Accepted/Rejected Cramer
V values Eta2 values
H3: There is a significant difference in leisure time activities (clusters) regarding personality types.
H3a: There is a significant difference in leisure time activities (clusters) regarding personality types –
Extraversion.
Accepted (p<0.001) 0.071
H3b: There is a significant difference in leisure time activities (clusters) regarding personality types – Openness.
Accepted (p<0.001) 0.032 H3c: There is a significant
difference in leisure time activities (clusters) regarding personality types –
Neuroticism.
Rejected 0.001
H3d: There is a significant difference in leisure time activities (clusters) regarding personality types –
Conscientiousness.
Accepted (p<0.001) 0.055
H3e: There is a significant difference in leisure time activities (clusters) regarding personality types –
Agreeableness.
Accepted (p<0.001) 0.066
Conclusions, limitations and future research possibilities
The choice of leisure activities depends on many factors. These factors may include demographic, sociographic, psychological, attitudinal, human ethological, or material causes to mention a few individual factors. These causal elements can also be related to and can even affect one another. Among these elements, we examined the effect of socio-demographic and personality types on the activities performed.
The Hungarian Central Statistical Office’s time-use survey was used to list the activities undertaken. These activities were complemented by some other relevant activities found in the literature review. Activities include socially bound and freely undertaken activities specific to the individual’s life. Regarding their genres, the free- time activities range from cultural activities to sporting activities and civilian or religious activities.
In the course of cluster formation, the age difference and generation were the most differentiating factors. Age was also the most segmenting element in the examined literature (Bull et al. 1997, Wong et al. 2008, Suija et al., 2010, Marques et al. 2015, 2016, Murtagh et al. 2015, Lusmägi et al. 2016, Shirish et al. 2016, Hayes et al. 2018). Although in contrast to Murtagh et al. (2015) in our research there is also an older group of active people, and the intermediate age group, regardless of their
financial situation (Marques et al. 2015) or education (Lusmägi et al. 2016) were the least active in leisure consumption. As in the research of Kemperman–Timmermans (2008), in our research in the rural area, more home-based leisure activities have emerged as frequent activities (housework, taking care of pets, practice religion and care for children). However, this difference is not observable in the breakdown by urban and rural or village, but significant. Regarding the personality types, it is more likely that there is a difference between personality types regarding the demographic characteristics (especially in ages, generations) of the respondent, as presented in the literature (Zhou et al. 2017, Abdullahi et al. 2020).
This research was conducted among university students and their acquaintances and friends, ensuring the widest possible sample within a certain age range with the snowball sampling method. Additionally, our sample is not representative, but certain trends, motives, and relationships can be identified as in the majority of studies. A further limitation of the research may be that a non-metric scale measures the frequency of activity performed, and it can distort the results.
In the future, it may be worth expanding the sample in older generations to get an even more nuanced picture of their behaviour. Another future option could be examining the same research questions on a more proportional sample of the population by locations. To generalise the results, a representative and bigger sample would be essential. Additionally, for statistically more accurate analysis, it is worth looking at leisure activities on other scales and analysing multiple clusters.
Additionally, it would be worth examining the interrelationships between demographic characteristics and the differences in personality types depending on demographic variables, too. In the future, it may even be interesting to analyse the changes that have taken place since the effects of the COVID-19 pandemic. Finally, examining the presence of sustainability and a more environmentally conscious or religious lifestyle can also be an interesting issue in research on leisure.
Despite these limitations, this study sought to provide a more complex approach and more complicated relationships than recent literature. It was interesting in itself how leisure clusters developed: our activities are in a weak to a medium relationship with most of the demographic and psychological characteristics, and show a modest, strong relationship with age and generation variables. In the less socially bound age groups (clusters of young and old) significantly more active and more passive groups can be observed, and the place of living does not necessarily influence this difference.
Acknowledgement
Supported by the ÚNKP-18-3-I-BCE-38 New National Excellence Program of the Ministry of Human Capacities.
Appendix
Table A1 Demographic characteristics of the sample by clusters in 2019
Cluster 1 Cluster 2 Cluster 3 Cluster 4 Cluster 5 Total
Respondents’ 181 87 190 205 154 817
Gender, %
Male 18.3 8.0 27.7 29.1 17.0 35.9
Female 24.9 11.8 21.4 23.3 18.6 64.1
Age (years)*** 22.81
(8.87)a) 66.68
(12.67) 22.18
(5.73) 50.01
(7.48) 67.07
(13.30) 42.46 (21.48)
Generations***, %
Z 50.7 0.0 48.6 0.0 0.7 36.4
Y 29.9 1.5 59.7 6.0 3.0 8.2
X 3.3 8.4 2.5 72.4 13.4 29.4
Baby-boomer 1.3 29.9 0.0 16.6 52.2 19.3
Veteran 0.0 31.5 0.0 1.9 66.7 6.6
Occupation***b), %
Student 50.8 0.3 48.5 0.0 0.3 37.8
Employee 6.2 9.1 13.2 58.7 12.8 29.6
Old age/Widow’s
pensioner 1.2 32.7 0.0 7.3 58.8 20.2
Weekly working hours 7.84 13.50 12.53 39.9 15.38 19.32 (13.35)c) (18.63) (17.33) (12.21) (20.12) (20.32) Covering monthly
expenses***, %
Very hard 0.0 9.1 45.5 9.1 36.4 1.5
Hard 19.5 7.3 19.5 22.0 31.7 5.6
Through savings barely 10.3 11.3 15.8 29.1 33.5 27.5
Relatively easy 15.3 17.7 18.1 30.7 18.1 29.2
Easy 20.7 8.7 16.3 43.5 10.9 12.5
Covered by others 50.3 1.7 45.1 1.1 1.7 23.7
Education level***d), %
Elementary studies 20.3 2.7 20.3 10.8 45.9 9.1
Secondary studies 30.9 7.1 31.5 14.4 16.1 57.2
Higher education 8.1 18.3 9.3 48.8 15.4 30.2
Family-status***e), %
Single 52.6 1.5 42.9 1.5 1.5 24.0
In a relationship
separately 43.5 2.3 49.6 3.1 1.5 16.1
Married/living together 2.3 17.5 0.6 49.7 29.9 37.7
Widow 0.0 30.6 0.0 4.1 65.3 6.0
Number of children under 18 in the household, %
0 22.6 12.5 27.5 15.8 21.6 67.3
1 28.0 3.4 20.6 45.1 2.9 24.2
2 25.5 0.0 14.9 59.6 0.0 6.5
More than 2 13.3 6.7 33.3 40.0 0.0 2.1
(Table continuous next page.)
(Continued.) Cluster 1 Cluster 2 Cluster 3 Cluster 4 Cluster 5 Total Place of living***, %
Budapest (Capital of
Hungary) 28.3 12.2 29.5 18.1 11.8 29.7
County seat 15.4 14.0 20.6 31.6 18.4 17.0
Other city 21.6 7.6 20.0 28.0 22.8 31.3
Cities altogether – Urban 22.8 10.8 23.8 25.0 17.7 78.1
Village 20.0 10.9 21.1 24.6 23.4 21.9
Rural altogether 20.0 10.9 21.1 24.6 23.4 21.9 Place of living
(NUTS2)***, %
Central-Hungary 28.1 9.9 28.7 21.9 11.4 43.0
Central Transdanubia 24.6 7.0 17.5 33.3 17.5 7.3
Western Transdanubia 22.1 11.8 19.1 30.9 16.2 8.8
Southern Transdanubia 17.5 17.5 12.5 37.5 15.0 5.1
Northern Hungary 13.8 7.5 28.8 21.3 28.8 10.3
Northern Great Plain 18.6 7.2 19.6 25.8 28.9 12.5
Southern Great Plain 15.8 10.9 18.8 27.7 26.7 13.0
Personality type
Neuroticism 49.86 (13.67)
48.02 (12.08)
47.65 (13.81)
48.06 (13.55)
49.63 (12.84)
48.65 (13.36) Extraversion*** 45.19
(8.21) 38.74
(9.13) 41.08
(9.94) 42.41
(8.57) 38.15
(8.89) 41.52 (9.27) Openness*** 53.15
(8.96) 52.51
(9.61) 49.74
(11.15) 53.31
(10.66) 48.26
(11.76) 51.41 (10.72) Agreeableness*** 45.72
(10.18) 51.42
(9.70) 44.21
(11.37) 49.18
(10.28) 51.38
(11.88) 47.91 (11.13) Conscientiousness*** 50.65
(10.87) 54.57
(9.04) 48.80
(11.97) 55.86
(9.80) 52.82
(10.98) 52.35 (11.03)
*** p<0.01
a) Standard deviations in parentheses.
b) Not all occupational statements were included in the table, so it does not add up to 100% by columns.
c) Standard deviations in parentheses.
d) Not all level of education statements were included in the table, so it does not add up to 100% by columns.
e) Not all family-status statements were included in the table, so it does not add up to 100% by columns.