Titre
Chapter 1
The transformation of young people’s online and offline leisure
time, spaces and media use in Hungary 1
Ádám Nagy and Anna Fazekas
INTRODUCTION
A
n age group can be considered to be a generation if it is characterised by some common immanent quality, generation knowledge and community feature, and three conditions are necessary for this: common experience; an actual orientation to each other of its members; and a shared interpretation of their situation, attitudes and forms of action (Mannheim 1978). Prensky has interpreted belonging to such an age group in relation to the information society (2001). We consider the development of Prensky’s digital natives-digital immigrants model and incorporate it into the Strauss–Howe model (1991), according to which generation change in Mannheim’s sense takes place in society roughly every 15 to 20 years.Through a theory of socialisation (Nagy 2013b), leisure time and media is seen to play the same role in post-modern society as school socialisation did in modern society and the family did in the pre-modern era. Thus, from the data on youth leisure time we can try to draw a picture of today’s young (Y and Z) generations through their activities and media usage in this regard, confirming the differences between gen- erations. We make use of Hungarian data here, because it derives from large-scale youth research conducted every four years and has been running for one and a half decades (Ifjúság 2000; Ifjúság 2004; Ifjúság 2008; Magyar Ifjúság 2012). This provides an overview of an 8 000-person sample that is representative of age, gender and settlement type in relation to the life situations and way of life of Hungarian youth.
1. This article is supported by a Bolyai Research Fellowship (Hungary).
The transformation of young people’s online and offline leisure time in Hungary
YOUNG PEOPLE IN SOCIETY: XYZ GENERATIONS
Since the proliferation of information and communication technologies (ICTs), the world of young people has become quite distinct from that of young people from earlier eras. Their time structuring, family, education and labour market status has been transformed; they construct their free time differently and use it for different purposes and have different information-gathering and communication strategies.
Their concepts of relationships, community and entertainment have also been transformed. One of the major problems of the information society era is how the generations born into the digital age transform their “knowledge society” and how they are influenced by it (Rab, Székely and Nagy 2008).
According to Mannheim (1978), an age group can be considered to be a generation if it is characterised by some common immanent quality, generation knowledge and community feature, and three conditions are necessary for this: common experience; an actual orientation to each other of its members; and a shared interpretation of their situation, attitudes and forms of action. Mannheim locates generational logic in parallel with the concept of class (i.e. a person does not enter a class but is born to it, and does not step out of it intentionally, only doing so if his/her status changes). This certainly does not mean that in case of the validity of generation logic all members of the age group show specific characteristics, but that a generational pattern exists.
Although the concept and classification of a generation is controversial, the present chapter does not analyse and evaluate their theoretical soundness. It presents the orientations of the different age groups, built on generational logic.2
According to Strauss and Howe’s model (1991), generation change in Mannheim’s sense is cyclical, taking place in society roughly in every 15 to 20 years. Prensky (2001) also interpreted in the generational dimension the relationship with the information society. We reflect on and discuss in this chapter the development3 (Székely 2014) of Prensky’s “digital natives-digital immigrants model” and incorporate it into the Strauss–Howe model.4
Generation X (digital immigrants, McDonald’s generation)
Forming the main body of today’s labour market, the members of Generation X were born in the second half of the 1960s and in the 1970s encountered the information technology (IT) toolbox at a young age; they were immersed, from the very start of their lives, in the digital world. They witnessed how computer technology developed
2. Defining the boundaries between generations by year of birth is rather arbitrary, since change in society is not so discrete. However, in this study, it is not the quantitative data that are important;
they merely confirm the true essence, or the emerging reflection, of a generation.
3. In the original model, young people are called “digital natives” (digital natives, N-Gen, Net Generation), as opposed to the older generation of “digital immigrants”.
4. According to Strauss and Howe, the basis of the cyclical nature of these generations and their social characteristics is social structure and attitude changes, and four generation features can be identified in it.
into IT, then into the information society. During their lives, the internet has been more or less present. In the West, they have grown up under the impact of electronic media. Its central and eastern European members may have grown up under state socialism, but during its final, liberalising phase.
Generation Y (digital natives)
The members of the age group born in the ‘80s and ‘90s encountered the internet in their childhood; as digital natives, they are confident in the management of tools and in orientating themselves in network space; the digital universe is their natural medium; their web/internet identity is consciously formed. They are characterised by strong media dependence, and they respond quickly to technological changes.
This age group is the generation of the information society, as its members naturally started to use ICTs in their childhood. Their social relations are taking place at the same time in real and virtual life; with the usage of mobile phones and the internet, their place dependence is much less than that of previous generations. Generation Y differs in many ways from previous generations: its members are receptive to cultural content; are attracted to group activities and to community space; are per- formance-oriented, confident and highly qualified (for most, school and good school performance is important). They receive information quickly; they prefer image and sound rather than text; they prefer random contacts (hypertext); they strive for the immediate and frequent satisfaction of their needs; they prefer games instead of
“serious” work; and they consider technology a necessary companion (Prensky 2001).
Members of this generation are moving with global trends, and are among the first to master the use of new technical devices, sometimes even changing the educa- tional direction; they feel at ease in the digital world: “The Hungarian Generation Y practically caught up with the delays that were common before. Generation Y grew up from being children to being young people after the change of regime; this generation got acquainted with computers and the internet, if not at home, then surely at school” (Székely 2014).5
Generation Z (the Facebook generation)
Members of Generation Z were born at the turn of the millennium and after the year 2000. When they lost their “computer virginity”, they discovered Web 2.06 and the entire social networking space; they do not know what life is like without the
5. In Hungary, most identify with their parents’ values, too (Nagy and Tibori 2016).
6. The term Web 2.0 refers to such second-generation internet services that are mainly based on the activity of online communities, and more precisely on the content generated and shared by users. The importance of Web 2.0 applications lies mainly in the fact that content becomes important, as opposed to technology. The characteristic of Generation Y services was that their content could be read, listened to and viewed by users online – similar to conventional, one-way media – and had fewer creators (while Generation X content did not exist in digital space). By contrast, the essence of Web 2.0 is that the content is created and shared by the users themselves.
A good example is the open-source Wikipedia, editable by anyone, as opposed to Encyclopaedia Britannica online (Generation Y), and even (Generation X) offline versions of classical lexicons, or torrent sites (Rab, Székely and Nagy 2007).
internet (or mobile phones); their primary communication tool is no longer e-mail but the social network. This generation is not only characterised by networking behaviour, the use of the internet as a digital socialisation channel, and informa- tion consumption, but also provides information services through platforms like YouTube, Facebook, Twitter and torrent sites. Their device management is a basic skill; they are characterised by multitasking and parallel actions (writing blogs, listening to music and following e-mail and social network turnover); and they make quick decisions. Generation Z not only embraces ICTs and their associated content, it adapts them to its own needs for everyday life; practically speaking, it is not stationary. At the same time, members “consume” via multiple channels (multitasking); their combined consumption exceeds the quantity “physically”
available to one person; and most do not have any reflective awareness of the legal and institutional environment of their typical and regular internet use (for example downloads, exchange of files). In addition, changes in the world not only influence the rational part of their psyche but fundamentally influence their emotional lives, too. Many of them “pour out” their emotional tension without having a cathartic experience (see the term “emotional incontinence”, an expect- ation that “other people should diaper us emotionally”, coined by Tari in 2010). So we experience our own feelings through them (we can think of one part of the blogosphere and thousands of comments, but also of certain identity situations, relationship aspects or the world of work). As regards Hungary, the former differ- ence between generations – between the West and Hungary – has disappeared;
and a sense of global youth culture is developing, as innovations typically appear on the Hungarian market with a few months’ delay.
Alpha-generation
This refers to those born in 2010 and thereafter, although we do not know yet if they will be distinct from Generation Z, and can be characterised as an autonomous generation in the Mannheimian sense.
In the remainder of this chapter we study the habits in media and leisure-time consumption of young Hungarian people. More specifically, we assess whether there are indeed generational differences. We rely on data from three waves of the Hungarian youth study, run every four years. Ifjúság 2000 can help us investigate Generation X, while Ifjúság 2004 allows us to investigate Generation Y. The unique situation of Generation Z is reflected by the fact that we could only represent a fraction of young people belonging to it.
Thus, Generation X consists of young people born between 1971 and 1980 (N = 5 726); Generation Y consists of those born between 1981 and 1989 (N = 4 254);
and the sub-pattern for Generation Z was provided by those born between 1995 and 1997 (N = 1 368).7 As members of Generation X no longer belong to the category
7. The different questions posed in the three surveys raise the problem of limited comparability. We have tried to minimise this risk throughout the analysis. The totally different response options (following different interviewing logics) were therefore not compared; the conclusions’ focus on the orientation of habits and preferences were taken into account, rather than the specific differences. However,
of young people, we focus in the empirical analysis mainly on Generations Y and Z.
Based on the available data, we studied the media consumption and characteristics of leisure-time preferences of young people of these two generations. Against this background, we addressed the question of whether and how offline leisure-time consumption became less important for Generation Z and to what extent the media, or more precisely the online world, took control of their leisure time. When answer- ing this question we include information from the broader European context by discussing three thematic Eurobarometer publications (Eurobarometer 2003, 2013, 2015). These Eurobarometer data enabled us to compare changes across more than a decade, namely the results of 2002 and 2014, and to study short-term changes in media and leisure-time consumption of young people (based on data from the 2012 and 2014 queries).
ALTERING LEISURE TIME: ONLINE
CONSUMPTION IN THE EUROPEAN UNION
In 2014, 63% of the EU population used the internet daily or almost on a daily basis;
this number was 19 percentage points lower in 2002 (Eurobarometer 2003, 2015) (Figure 1).8 In 2002, Denmark, the Netherlands and Sweden were at the forefront in this area, while in 2014, European internet use was highest in Sweden and the Netherlands. In contrast, in 2002 Greece, Italy and Ireland had the lowest internet penetration. In 2014, internet use was least common in Romania, with only a third of the population visiting a virtual space at least once a day. During the 12-year obser- vation period, France has made the greatest progress: the number of daily internet users increased by 36 percentage points between 2002 and 2014. A similar, albeit somewhat less pronounced, evolution characterised the Netherlands, Sweden and Ireland. In contrast, Portugal experienced a minimal increase (about 8 percentage points) with respect to the use of the online space.
the longitudinal studies – even if they followed a different age-group breakdown – basically allow follow-up of the transformation of leisure habits, and the aim of this chapter was just to explore this.
The numbers making up the sub-samples created for the imaging of the three generations vary considerably, particularly for Generation Z, and thus do not really allow for reliable comparison.
However, the tendencies and differences in the strong generational consumer and leisure-time habits are outlined in this form as well. The practical limitations of age determination were provided by the patterns of individual data collection. For Generations X and Y, the age-based categorisation we used made relatively wide age limits possible, but for Generation Z (sample 2012) the size of sub-samples was reduced by only three years (born between 1995 and 1997).
The reason for this is that, at the time of the survey in 2012, only a fraction of Generation Z were questioned (these are young people born after 1995); the limits imposed by the original sam- pling meant that only this narrow age group could be assigned, and the comparison with two other generation sub-samples (Generations X and Y) made. A deeper, more detailed analysis of Generation Z will be made possible by the next cycle of youth surveys in Hungary.
8. While in 2002 the EU average was calculated based on the data of 15 member states, for the 2014 data this average was based on 28 countries.
Figure 1: Changes in daily or almost daily internet use in EU member states, 2002- 14 (% among people older than 15)
Source: Eurobarometer 2003, 2015
If we focus on the internet use of young citizens living in the EU, we find a 50 percentage- point increase in daily internet users during the 12-year period of observation. Indeed, whereas in 2002 only about 42% of 15- to 24-year-olds used the internet on a daily basis, this number rose to 92% in 2014 (Eurobarometer 2003, 2015). Because older age groups did not experience a similar increase in their internet use, the 12-year period saw also the growth of an age gap in terms of internet use.
Whereas in 2002 age differences were very small, in 2014 daily internet use of the youngest cohort was about 60 percentage points higher when compared with the oldest (55+) cohort (Figure 2).9
9. In addition to age, the level of education also correlates with the frequency of internet use (Eurobarometer 2003, 2015). The rate of those using the internet daily is highest among those who finished their studies after the age of 20 (2002: 52%; 2014: 83%) and those who are still in education at the time of the survey (2002: n.a.; 2014: 95%). The lowest internet use is found among people who have a maximum of a primary level of education (completing their studies before the age of 15) (2002: 33%; 2014: 23%).
Figure 2: Changes in daily or almost daily internet use in the EU by age group, 2002-14 (% among people older than 15)
Source: Eurobarometer 2003, 2015
Recent studies have also identified more short-term trends. Europeans in the EU increasingly use the internet outside home. Whereas in 2012 about 80% of internet use took place at home (Eurobarometer 2012), this percentage decreased to 74%
by 2014 (Eurobarometer 2015). This change is mainly due to the increased popu- larity of portable devices combined with the development and availability of Wi-Fi systems in public places. While desktops and laptops remain by far the devices most used to access the internet (92% of Europeans using the internet relied on a desktop or laptop in 2014), about 61% of Europeans entered virtual space by means of a smartphone, while 30% used a tablet. In 2012, only 6% of people living in the EU used a tablet, and 24% used smartphones (Eurobarometer 2013). We also find a clear age gap. No age differences are found between desktop and laptop use, but the age differences in accessing the internet by means of smartphones or tablets are substantial (Eurobarometer 2013, 2015), particularly with the former (Figure 3).
Figure 3: Changes in use of the internet on smartphones in the EU by age group, 2012-14 (% among people older than 15)
Source: Eurobarometer 2013, 2015
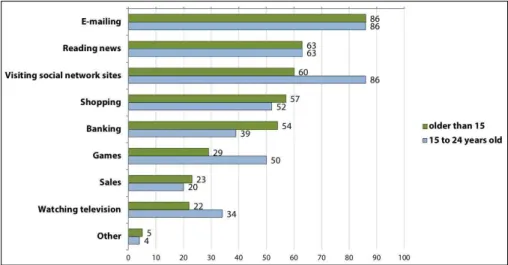
The most popular online activities are exchanging e-mails and reading news, closely followed by visiting social network sites and online shopping (Eurobarometer 2015) (Figure 4). Over half use online banking, but gaming engages the attention of only 3 out of 10 users. The least frequently practised online activities are online shopping and watching TV. When it comes to young people, virtual space is predominantly
used for communication purposes: e-mailing and visiting social network sites are the most common online activities. In addition, collecting information, online gam- ing and shopping are also frequently performed activities in cyberspace. The age gap is most pronounced for visiting social network sites, watching television and gaming (more popular among young people) and banking (more popular among older respondents).
Figure 4: Popularity of online activities in the EU, 2014 (% among people older than 15 and young people/15 to 24 years old)
Source: Eurobarometer 2015
THE LEISURE-TIME HABITS
OF GENERATION X YOUTH IN HUNGARY
10Regarding the leisure time of the formerly young people of Generation X we can say, first, that they are dominated by offline activities. This is primarily due to the fact that in 2000, only 8% of the families of young people had internet access at home (Ifjúság 2000). At that time, one third (34%) of Hungarians who belonged to
10. The limitation of using sub-samples representing specific generations is that this presents the lifestyle habits and leisure preferences of certain groups of young people at different stages in the life cycle.
From this perspective, Generation Y provides the optimal sub-sample, as besides teenagers, young adults in their early 20s are also included. In contrast, the sub-sample provided by the 2012 survey of Generation Z only includes teenagers, while the Generation X sub-sample includes only young adults. However, it is important to note that mere age-based categorisation does not provide an accurate description of young people’s biological, psychological and social maturity (see Nagy and Tibori 2016; Nagy 2013a). Thus, if the validity of our methodology of using different age groups is disputed from this point of view, we should see that the sub-samples examining single age groups may reveal generational differences in the generations (on the spread of the post-adolescence phenomenon see Nagy and Tibori 2016). It is further noted that several other comparisons can provide relevant answers, but those either cannot be examined because of the special features of the questionnaires, or they do not really provide a characteristic pattern (e.g. the media consumption of those 20 years of age and over, respectively, differ only in less important categories).
Generation X believed that neither they nor their families needed the World Wide Web, irrespective of whether the household had a computer or not. When the mem- bers of Generation X were young, they used the computer mostly at home (30%) or at the school/workplace (37%); the options provided by public spaces were only an alternative for a few people (3%). People who did not have a computer justified the lack in terms of costs: 65% did not have internet access because of the high subscription fees. More generally, the number of consumer devices was quite low.
Only 32% of Generation X youngsters had their own TVs, and only 34% of them had their own mobile phones. While there was a TV in 95% of the families of young people, mobile devices could be found only in half of the families.
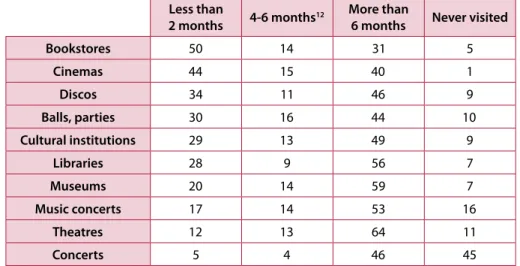
Moreover, only 5% of the young people of Generation X were in the best position (referring to the ownership of audiovisual/digital devices), because they had their own televisions, owned mobile phones and had home internet access at the turn of the millennium. The proportion of those having their own mobile phones and colour television was 13% (there are only two variables here).11 The possession of media assets was strongly correlated with financial situation: those with a better financial situation were three times more likely to own mobile phones and colour televisions when compared to their poorer peers. At the turn of the millennium, young people belonging to Generation X spent most of their free time at cinemas and bookstores (Table 1). They also regularly visited libraries, cultural institutions and museums and attended concerts. In contrast, only half of the age group attended clubs or dance parties, and the citadels of high culture (theatre, concerts) fell almost entirely outside the sphere of young people’s recreational spaces.
Table 1: Time since last visit to recreational spaces in 2000 (20- to 29-year-olds;
N = 5 534 to 5 691; %)
Less than
2 months 4-6 months12 More than
6 months Never visited
Bookstores 50 14 31 5
Cinemas 44 15 40 1
Discos 34 11 46 9
Balls, parties 30 16 44 10
Cultural institutions 29 13 49 9
Libraries 28 9 56 7
Museums 20 14 59 7
Music concerts 17 14 53 16
Theatres 12 13 64 11
Concerts 5 4 46 45
Source: Ifjúság 2000
11. The question was initially “Do you own a colour TV?”; later, it was simply “Do you have a TV set?”
The distinction between colour and black-and-white TV was no longer relevant.
12. The survey questions did not include a “2-4 months” category.
Among leisure-time activities, reading newspapers, listening to the radio and watching TV were the most prevalent. Newspapers appeared to be more popular than books:
the former were read by 74% (several times a week) of young people belonging to Generation X, while the latter were read regularly by 22%.13 It is important to note, however, that 7% of the youth of Generation X did not read newspapers at all and 8% did not read books. Listening to the radio on weekdays was more popular than watching television: on average they spent roughly 2.5 hours a week listening to the radio (151 minutes on average), and about the same time during the weekend (153 minutes on average). Watching television on weekdays (133 minutes on average) was less important compared to the weekends (205 minutes on average).
THE LEISURE-TIME HABITS OF GENERATION Y YOUTH IN HUNGARY: A DOMINANCE OF OFFLINE ACTIVITIES
In 2004, 55% of Generation Y youth had up to three hours of free time; 39% had four to eight hours of free time after having fulfilled their obligations. In contrast, young people had more free time during the weekend: 42% had half a day at their disposal, and 29% had no obligations at all. As for recreational spaces, spending time at home was the most popular activity (Table 2). On weekdays and during the weekends, the youth of Generation Y spent their free time mostly at home. During the weekend, however, going out was more common. The same applies to meeting friends and relatives, visiting clubs and going on trips.14
Table 2: Most popular15 recreation spaces in 2004 (15- to 23-year-olds; N = 4 213 weekdays, N = 4 215 weekends; %)
Weekdays Weekend
Home 71 56
Friends’ places 30 42
Street 6 5
Sports grounds 6 4
Relatives 3 8
Clubs 3 12
Outdoors 3 7
Cultural institutions 1 1
Cinemas 1 2
Shopping malls 0 0
Source: Ifjúság 2004
13. Objective response options, referring to the quantifying of frequency (e.g. 15 minutes per week- days or 27 minutes per weekend), were not included in this question.
14. The causes of this phenomenon may be diverse (e.g. they are forced to stay at home). Unfortunately, our data provide no information on these causes.
15. The question was asked in an open format. Young people could name the two most visited recreation spaces. Thus, it is possible that the frequency of certain response options yields an overall result higher than 100%.
As far as activities are concerned, watching television took up a considerable amount of free time. On weekdays, Generation Y youth spent an average of 2.5 hours (139 minutes) watching television. During the weekends this increased to almost 4 hours (226 minutes). Subjective financial status was important for two reasons16 (Table 3). First, people living in a financially more comfortable situation watched much less television than people who lived in an economically deprived situation.
On weekdays and during the weekends, young people facing regular financial prob- lems spent approximately 40 minutes more watching television than their peers in the most stable financial position. However, it is also obvious that the television consumption of those living in the most precarious situations was very low.
Table 3: Average amount of time spent on television, by subjective financial status, in 2004 (15- to 23-year-olds; N = 4 138; p ≤ 0.001; minutes)
Weekdays Weekend
Live without problems 128 217
They get along well with their income by budgeting 133 221 They hardly get along with their income 147 229 They have financial problems month after month 166 259
Live in deprivation 140 202
Source: Ifjúság 2004
With respect to computer use, only 12% of this age group did not use the internet.
Only one fifth (22%) used the internet on a daily basis, while a quarter used it several times a week (24%). Using the internet was basically considered to be an activity that varied by financial situation, in 2004. Against that background it is not surprising that status perception was strongly related to young people’s internet use (Table 4).
Among those people living in a secure financial situation the proportion of frequent internet users was three times higher than among those living in a precarious situa- tion. In 2004, one out of three 15- to 23-year-olds living in an economically deprived family did not use the internet at all and just one fifth spent time on the internet several times a week.17
16. Based on the data analysis, we found that the most significant differences can be detected on the basis of subjective financial status. Therefore, the analysis of correlations with other variables (e.g.
gender, type of settlement) falls beyond the scope of this chapter. Subjective financial status is measured on a five-point, self-reporting scale. Obviously, this question has different meanings for adolescents and young adults.
17. Residence clearly influenced internet consumption habits among Generation Y youth. Those living in the capital Budapest recorded a significant advantage in this area in 2004; two thirds were regular internet users, compared to just a third of those living in villages (for the entire 15 to 23 age group the figure is 47%). The type of settlement is not strongly related to differences in access, in terms of those not using the internet at all; we cannot see a significant difference in relation to the size of the settlement. About 6% of young people living in the capital, and about 16% of those living in villages, stated that they did not use the internet at all in 2004 (for the entire 15 to 23 age group it is 12%).
Table 4: Frequency of internet use, by subjective financial status, in 2004 (15- to 23-year-olds; N = 3 301; p ≤ 0.001; minutes)
Several times
a week Less often Never
Live without problems 58 35 7
They get along well with their
income by budgeting 48 42 10
They hardly get along with their income 42 42 15
They have financial problems
month after month 35 48 17
Live in deprivation 21 45 35
Source: Ifjúság 2004
THE LEISURE-TIME HABITS OF GENERATION Z IN HUNGARY: DOMINATION OF ONLINE ACTIVITIES?
The young people of Generation Z have about 3.4 hours of spare time on weekdays.
During the weekends this equals 9.2 hours. A glance at how this time is spent makes it clear that simply staying at home remains important throughout the week (Table 5).
This observation may be explained by the fact that home is where people have access to mediated tools (for example multiplayer games, consoles). Time spent outside of the home and active forms of leisure are less important, which is indicated by the fact that while young members of Generation Y prefer to leave the house on the weekend, Generation Z prefers to stay indoors on Saturdays and Sundays.
Table 5: Most popular18 recreation spaces in 2012 (15- to 17-year-olds; N = 1 301 weekdays, N = 1 344 weekends; %)
Weekdays Weekend
Home 85 76
Friends’ places 45 62
Sports grounds 6 7
Relatives 4 8
Outdoors 4 5
Street 3 2
Shopping malls 2 2
Cultural institutions 1 3
Cinemas 0 1
Pubs 0 1
Source: Magyar Ifjúság 2012
18. The question was asked in an open format. Young people could provide (an unlimited number of) answers by naming the most visited recreation spaces. Thus, it is possible that the frequency of certain response options yields an overall result higher than 100%.
Spending time with friends is a more common activity during the weekend compared to weekdays. But it can also be seen that free time shared with peers is more important for the young people of Generation Z than for those of Generation Y (Table 5 and Table 2).
However, spending time on the street and in public spaces, including the world of shopping malls, attracts only a small fraction of the age group. The same applies to visiting pubs (Table 5).
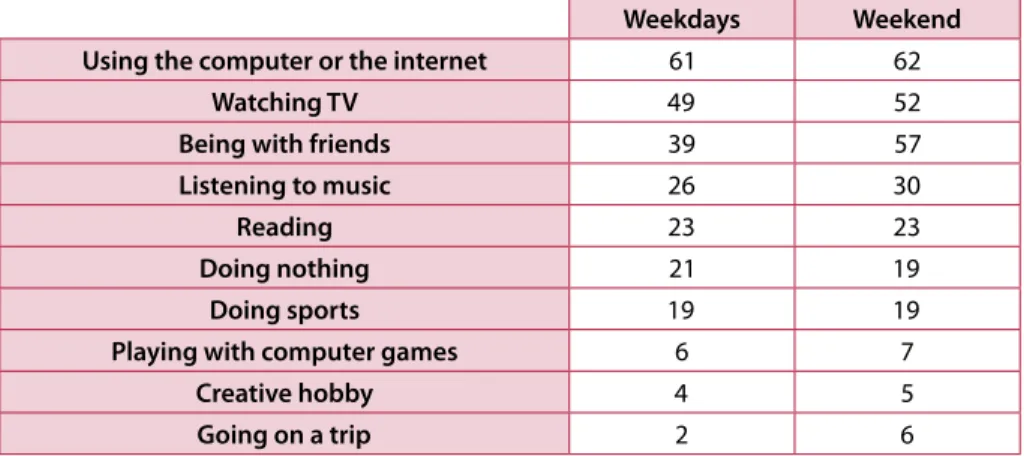
One fifth of Generation Z spend most of their free time “doing nothing” (Table 6). A specific characteristic of this generation’s leisure-time consumption is the dominance of time spent watching TV and using the internet. The latter is more important when compared to watching TV: 6 out of 10 young people indicated internet use as the most popular form of leisure-time activity compared to 5 out of 10 who preferred watching television. Overall, however, these mediated forms of leisure-time consumption are much more important than offline activities such as doing sports, going on trips or reading. Even listening to music is a much less popular activity compared to using the internet or watching TV. Some caution, however, is warranted, as some of these activities can be done online. Unfortunately, the 2012 data do not allow separating online and offline forms of leisure-time activities, so we are not able to assess to what extent these activities are increasingly carried out online.
Table 6: Most popular19 leisure-time activities in 2012 (15- to 17-year-olds;
N = 1 301 weekdays, N = 1 344 weekend; %)
Weekdays Weekend
Using the computer or the internet 61 62
Watching TV 49 52
Being with friends 39 57
Listening to music 26 30
Reading 23 23
Doing nothing 21 19
Doing sports 19 19
Playing with computer games 6 7
Creative hobby 4 5
Going on a trip 2 6
Source: Magyar Ifjúság 2012
In general, the amount of time spent watching television among people belong- ing to Generation Z is lower than in Generation Y youth, with the former spending on average 122 minutes watching TV on weekdays and 216 minutes during the weekend (Hack-Handa and Pintér 2015). This implies that television continues to be a key element of free time for the younger generation, but that its relative importance has decreased significantly. Our data strongly suggest that this is com- pensated by a much higher use of computers and the internet by Generation Z.
19. The question was asked in an open format. Young people could provide an answer by naming the two most visited recreation spaces. Thus, it is possible that the frequency of certain response options yields an overall result higher than 100%.
If Generation Y youth used computers and the internet on a non-daily basis, Generation Z uses them on average several hours a day. Indeed, Generation Z spends an average of 121 minutes in cyberspace on weekdays, and 214 minutes during the weekend.
This is virtually the same amount of time they spend watching television.
These averages, however, conceal important social differences. Subjective financial status, for example, is clearly related to television consumption (Table 7). Both on weekdays and during the weekends, young people in the worst financial situation spend most of their time watching TV. Roughly speaking, we find a 50% to 60%
difference in television consumption between young people in the best and worst economic situations. More difficult financial situations bring with them a decrease in cultural expenditure, as well as a lack of diverse experience in spending free time. An examination of the effect of subjective financial status on leisure-time preferences and activities indicates that economic status is significant in determining the choice of leisure-time uses (Fazekas 2014). After all, it is not only status management of the current situation but also future prospects that have a strong influence on the habits of young people in relation to leisure time. The worst financial situation is clearly asso- ciated with resignation, and a negative vision of the future is in favour of home leisure time as well as passive pastimes. In contrast, an economically secure situation goes with diversified leisure-time consumption. An optimistic perspective makes it more likely that one will be engaged in active pastimes, including those outside the home.
Table 7: Average amount of time spent watching television, by subjective financial status, in 2012 (15- to 17-year-olds; N = 1 200; p ≤ 0.001; minutes)
Weekdays Weekend
Live without problems 99 188
They get along well with their income by budgeting 105 193 They hardly get along with their income 130 220 They have financial problems month after month 152 271
Live in deprivation 158 286
Source: Magyar Ifjúság 2012
An examination of the relationship between young people’s internet use and their financial position clearly shows that financial difficulties reduce the amount of time spent on the internet (Table 8). Young people experiencing the living conditions of their families as secure spend (both on weekdays and during the weekend) nearly thrice the amount of time in cyberspace than their peers living in deprivation.
Table 8: Average amount of time spent on the internet, by subjective financial status, in 2012 (15- to 17-year-olds; N = 1 200; p ≤ 0.05; minutes)
Weekdays Weekend
Live without problems 147 294
They get along well with their income by budgeting 129 231 They hardly get along with their income 126 215 They have financial problems month after month 101 165
Live in deprivation 54 108
Source: Magyar Ifjúság 2012
Obviously, Generation Z is attracted by online space: 47% have a smartphone with internet access; 77% were members of a social network site in 2012; 74% considered the internet a very important source of information. Indeed, these young people considered the internet the second most important source of information (after family and friends, Figure 5). Although television has not lost its significance it is considered less important as a source of information compared to the internet.
Traditional information channels like radio and newspapers play only a minor role in providing young people with information.
Figure 5: Importance of sources of information in 2012 (15- to 17-year-olds;
N = 1 271 to 1 341; from 1 = not important at all, to 5 = full importance)
Source: Magyar Ifjúság 2012
Young people use virtual space mostly for communication purposes (Figure 6).
Online mailing, chatting and the exchange of messages occupy a key role. People engage less in the world of blogs and online forums.
Figure 6: Importance of online forms of communication in 2012 (15- to 17-year- olds; N = 1 320 to 1 326; %)
Source: Magyar Ifjúság 2012
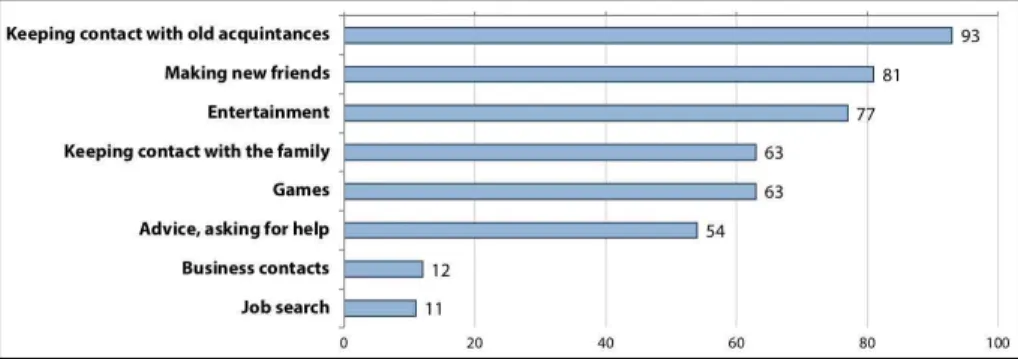
Generation Z uses social network sites primarily as a communication tool (Figure 7).
Most visit these sites to keep in touch with old friends and acquaintances and make new friends. Besides this, entertainment, gaming and communicating with family were also important goals for using social network websites. Only about half used social network sites for counselling reasons, and 11% to 12% used them for work-related purposes.
Figure 7: Aims in using social networking sites in 2012 (15- to 17-year-olds;
N = 1 013 to 1 017; %)
Source: Magyar Ifjúság 2012
Against the background of the increasing availability of ICT tools, it is surprising to find that on average, about 12% of Generation Z does not use the internet at all.
This average conceals a clear social gradient (Figure 8). Indeed, more than half of the young people who struggle with serious financial problems do not use the internet at all. Among those with a stable material situation this was just 4%. As a result, we can say that the World Wide Web (as well as the acquisition of skills necessary for using it) is not equally available to the members of Generation Z. Financial difficulties clearly go together with the partial or non-acquisition of digital skills and with a low degree of proficiency in cyberspace.
Figure 8: Ratio of young people who do not use the internet, by subjective financial status, in 2012 (15- to 17-year-olds; N = 1 204; p ≤ 0.000; %)
Source: Magyar Ifjúság 2012
DISCUSSION
The internet has, to various degrees, become an integral part of everyday life for European citizens. This is especially true for young people who are also very recep- tive to innovations in virtual space. For young people, online tools and the internet provide many opportunities for keeping contact with friends and relatives. They use the internet primarily for communication. For the EU as a whole, Sweden and the Netherlands are the most active and most open towards online space. Citizens of
these countries reported the highest number of internet consumers both in 2002 and 2014. Moreover, the growth in the overall share of internet users between 2002 and 2014 was highest in these countries. These observations contrast with those found for central and eastern European countries.20 In the latter, only 5 to 6 people (older than 15) out of 10 use the internet on a daily basis.
We found that there were generational differences in the Mannheimian sense in Hungary and it became clear that the consumption patterns of Generation X were more homogeneous compared to the two younger generations. For the young people of Generation X, online tool use was much less diverse and consumption was basically determined by access. Financial concerns dictated the forms and frequency of online space use and only a small amount of leisure time was spent online. In contrast, in the case of Generation Y youth, access was not really a major problem as the internet had been introduced into nearly every household. For Generation Z, virtual space and online activities are an integral part of their socialisation. In their case, the question is no longer whether to use the internet, but how, when and for what. Therefore, gathering detailed information concerning young people’s online activities should occupy a central place in the next wave of youth research.
As with Generation Y, Generation Z spends a considerable part of its leisure time outside the home. While time spent in front of a computer screen is constantly grow- ing, other cultural spaces remain closed to many; diverse leisure time is narrowing.
Media consumption thematises the habits and activities of leisure time, and for a significant proportion of young people, idleness is the primary leisure-time activity (Table 6). The use of television and especially the internet, as determined by financial situation, draws attention to a major phenomenon. From the data in this chapter it is clear that labour market success, social inclusion, and digital literacy and the use of tools (providing space for equal access of knowledge) remains unattainable for some young Hungarians. Though a whole range of information and communication tools exists that can enable the fulfilment of these criteria, for disadvantaged young people, the minimal use of online tools does not result in, or only does so to some extent, their useful, conscious and knowledge-based use.
In terms of access to the tools of the information society, disadvantaged social groups are seen to be disadvantaged in other dimensions as well. Several studies have confirmed the recognition that digital inequality – the so-called digital gap – can be reproduced along traditional lines, and that these dimensions interact with each other:
Therefore, the existence of knowledge related to ICT tools, primarily the existence of knowledge needed for the use of computers and the internet, can directly affect the social status of the individual. Even if knowledge related to ICT tools does not provide an advantage, its lack can be a disadvantage in other dimensions such as the labour market (Székely and Urbán 2009: 21-2).
What also became apparent from our analysis, in addition to the fact that a growth in internet use supports social equality, is that the difference of the online-type
20. Based on data from the Eurobarometer report of 2015 (see Figure 1), in addition to Hungary, Romania, Poland, Croatia, Slovakia and the Czech Republic occupy a low ranking terms of internet use frequency.
consumption is significant: for young people who regularly experience financial problems there is much less opportunity to exploit the opportunities provided by online space than for their peers in a comfortable situation. And the dangers of the virtual world concern mostly those young people who are the least familiar with it: it is fair to say that in this regard we can speak about the most vulnerable group.
CONCLUSION
In this chapter, building on Mannheim’s concept of generations, we attempted to distinguish the different age groups based on their leisure-time consumption and their use of ICTs. The results indicate that the “youth of camps” of previous years, by all indications, have morphed into “screenagers” – while revealing many new features about themselves as autonomous culture-creating generations. Data collected in 2004 already show that the vast majority of young people can basically be reached at home or at their friends’ (Szabó and Bauer 2005). As Nagy (2013c: 226) concludes:
From the waves of previous large-scale youth research we can see that young people typically consider free time to be that time when they engage in some kind of passive activity, especially in their homes in a largely mediated environment (and much less activities that are active, authentic leisure-time activities). The 2012 data on Hungarian youth lifestyles also reinforce the conclusion that in non-institutionalised youth leisure time, electronic media is becoming increasingly important; in the beginning this was radio, then television, and today, it is the internet that takes up a large proportion of leisure time.
This also means that the sociological discourse discussed here is transformed into a youth drama: the spaces where young people are present, and the effective ways of addressing young people, are fundamentally different from those used in earlier times, and this has a fundamental impact on youth work, its approaches and methods.
REFERENCES
Fazekas A. (2014), “Státuszészlelés és szabadidő”, in Nagy Á. and Székely L. (eds), Másodkézből – Magyar Ifjúság 2012, ISZT Alapítvány-Kutatópont, Budapest, pp. 219-44.
Hack-Handa J. and Pintér R. (2015), “Generációs különbségek a magyar médiafogy- asztásban”, Információs Társadalom XV. No 2, pp. 7-17.
Howe N. and Strauss W. (1991), Generations: the history of America’s future, 1584 to 2069, William Morrow & Company, New York.
Mannheim K. (1978), “Das Problem der Generationen”, in Kohli M. (eds), Soziologie des Lebenslaufs, Neuwied, Darmstadt.
Nagy Á. (2013a), “Az ifjúsági korosztályok meghatározásának egyéni életúton alapuló paradigmája”, in Székely L. (ed.), Magyar Ifjúság 2012 – Tanulmánykötet, Kutatópont, Budapest.
Nagy Á. (2013b), “Szocializációs közegek”, Replika 83, XXIV, No. 2, pp. 95-108.
Nagy Á. (2013c), “Szabadidős tervek és tevékenységek”, in Székely L. (ed.), Magyar Ifjúság 2012 – Tanulmánykötet, Kutatópont, Budapest.
Nagy Á. and Székely L. (2014), Másodkézből, Magyar Ifjúság 2012, ISZT Alapítvány- Kutatópont, Budapest.
Nagy Á. and Székely L. (2015), Harmadrészt, Magyar Ifjúság 2012, ISZT Alapítvány, Budapest.
Nagy Á. and Tibori T. (2016), “Narratívák hálójában: az ifjúság megismerési és éretelmezési kísérletei a rendszerváltástól napjainkig”, in Nagy Á. and Székely L.
(eds), Negyedszázad – Magyar Ifjúság 2012, Iuvenis Ifjúságszakmai Műhely – ISZT Alapítvány – Excenter Kutatóközpont, Új Ifjúsági Szemle Alapítvány, Budapest.
Prensky M. (2001), “Digital natives, digital immigrants”, available at www.marcprensky.
com/writing/Prensky%20-%20Digital%20Natives,%20Digital%20Immigrants%20 -%20Part1.pdf, accessed 26 February 2018.
Rab Á., Székely L. and Nagy Á. (2008), “Virtuális ifjúsági munka”, in Nagy Á. (ed.), Ifjúságügy, Palócvilág Alapítvány – Új Mandátum Kiadó, Budapest.
Szabó A. and Bauer B. (eds) (2005), Ifjúság 2004. Gyorsjelentés, Mobilitás Ifjúságkutató Iroda, Budapest.
Szabó A. and Bauer B. (eds) (2009), Ifjúság 2008. Gyorsjelentés, Szociálpolitikai és Munkaügyi Intézet, Budapest.
Szabó A., Bauer B. and Laki L. (eds) (2001), Ifjúság 2000. Tanulmányok, Nemzeti Ifjúságkutató Intézet, Budapest.
Székely L. (ed.) (2013a), Magyar Ifjúság 2012 – Tanulmánykötet, Kutatópont, Budapest.
Székely L. (2013b), “Módszertani jegyzet”, in Székely L. (ed.), Magyar Ifjúság 2012 – Tanulmánykötet, Kutatópont, Budapest.
Székely L. (2014), “Az új csendes generáció”, in Nagy Á. and Székely L. (eds), Másodkézből – Magyar Ifjúság 2012, ISZT Alapítvány-Kutatópont, Budapest.
Székely L. and Urbán Á. (2009), A bevonódás útjai avagy hogyan kezdtünk internetezni?, Excenter Füzetek I. Excenter Kutatási Központ, Budapest.
Tari A. (2010), Y generáció, Jaffa Kiadó, Budapest.
Databases
Eurobarometer (2003), Internet and the public at large, Flash 135, available at http://ec.europa.eu/COMMFrontOffice/PublicOpinion/index.cfm/ResultDoc/
download/DocumentKy/58889, accessed 26 February 2018.
Eurobarometer (2013), Cyber security, Special 390 (EB77.2), available at http://ec.europa.eu/COMMFrontOffice/PublicOpinion/index.cfm/ResultDoc/
download/DocumentKy/56966, accessed 26 February 2018.
Eurobarometer (2015), Cyber security, Special 423 (EB82.2), available at http://ec.europa.eu/COMMFrontOffice/PublicOpinion/index.cfm/ResultDoc/
download/DocumentKy/64573, accessed 26 February 2018.
Ifjúság 2000 youth research database Ifjúság 2004 youth research database Ifjúság 2008 youth research database Magyar Ifjúság 2012 youth research database