R E S E A R C H Open Access
Comparative analysis of sports
consumption habits in Hungary, Poland and Germany
Dávid Paár1* , Antal Kovács1, Miklós Stocker2, Márk Hoffbauer1, Attila Fazekas1, József Betlehem1, Barbara Bergier3and Pongrác Ács1
Abstract
Background:The so-called sports consumption models are looking for the factors that influence the sports spending of households. This paper aims to examine the Hungarian, Polish and German households’sports expenditures which can be an important indicator of physical activity and sporty lifestyle.
Methods:Surveying of households in three countries (Hungary, Poland and Germany) has been conducted with a self-designed questionnaire. We have used descriptive and bivariate non-parametric and parametric statistical methods: (1)χ2test, Mann-Whitney test and Kruskal-Wallis test for checking the relationship between
sociodemographic and physical activity variables and (2) independent sample t-test and ANOVA for checking the differences in sports expenditures.
Results:Our research concluded that men, especially previous athletes, exercise more than women and those who have no history as registered athletes. The choice of sports venues is obviously different between the countries in the sample. Members of the study population spend the most on sports services while they spend the least on sports equipment. German households have the highest spending rates compared to the other two countries.
Conclusions:Results are in line with our previous research findings and with other literatures. The difference in preferences of sports venues could have the reason of different supply of sports clubs or the different living standards too. It needs further researches to clear it. Material wealth, income level and sport socialisation can be a determining factor regarding the level of sports spending.
Keywords:Sports consumption, Sports venues, household’s expenditures, Sports services, Sports shoes, Sportswear
Background
The end consumers and the consumer sports market mean the heart of the sports industry, which fundamen- tally determine the development and growth potential of further sports markets (e.g. the market of sponsorship, sports equipment, sportswear, sports professionals, etc.) for leisure sports and professional sports alike [1,2].
The spending of sports consumers in the leisure and professional sports markets can be compared in different extent to the frequency and duration of sports activities that also require physical activity. The literature usually analyses people’s time spent in sports and their sports habits, as well as their expenditure on sports–which in- clude both passive and active sports consumption –, using the same demographic, socioeconomic and sports socialization factors [3–7].
The study of active sports activities is not only con- stantly at the forefront of researches because the costs
© The Author(s). 2021Open AccessThis article is licensed under a Creative Commons Attribution 4.0 International License, which permits use, sharing, adaptation, distribution and reproduction in any medium or format, as long as you give appropriate credit to the original author(s) and the source, provide a link to the Creative Commons licence, and indicate if changes were made. The images or other third party material in this article are included in the article's Creative Commons licence, unless indicated otherwise in a credit line to the material. If material is not included in the article's Creative Commons licence and your intended use is not permitted by statutory regulation or exceeds the permitted use, you will need to obtain permission directly from the copyright holder. To view a copy of this licence, visithttp://creativecommons.org/licenses/by/4.0/.
The Creative Commons Public Domain Dedication waiver (http://creativecommons.org/publicdomain/zero/1.0/) applies to the data made available in this article, unless otherwise stated in a credit line to the data.
* Correspondence:david.paar@etk.pte.hu
1University of Pecs, Faculty of Health Sciences, Pecs, Hungary Full list of author information is available at the end of the article
associated with it are generating an ever-growing market and the sports industry is becoming increasingly import- ant in the developed, welfare states’economies [8,9]. It is also important to analyse them because there are a number of other health and economic benefits realised at the societal level in addition to pure market transac- tions. However these are not immediately realised and possibly not only by sports consumers in many cases but also by other members of society, by social welfare sys- tem or by enterprises that employ physically active people [10,11].
As an extension of our previous research in Hungary [12–15] we have analysed and compared sports con- sumption of three EU member states (Hungary, Germany, Poland) in this study. Although there are sev- eral approaches of analysing sports habits [16], current questionnaire is based on the leisure-demand model elaborated in detail by Pawlowski [17].
We were interested in the influence of those sociode- mographic and economic factors on sport consumption expenditures which are widely accepted in the literature as affecting the frequency and extent of participation in sports consumption. However these factors have been less frequently examined regarding the expenditure side.
We have investigated whether there are any differences in sports spending between the three countries surveyed.
It is important for the stakeholders appearing on the supply side of the sports market to be aware of the dif- ferences between types of households consuming sports.
Furthermore these results may determine governmental sports policy, as different interventions may be appropri- ate for stimulating active or passive sports consumption for the three countries.
Methods
Sampling was done online using convenience sampling techniques. The online questionnaire was made using Google Docs™. The survey was carried out from January 2018 to October 2018 in the three countries (Hungary, Poland and Germany).
We used our own, anonymous, online self- administered questionnaire to collect the data which in- cluded questions about the sports habits and sports spending of households. The basic questionnaire was de- veloped in 2011 (we had already used it two times in Hungary) and contained 45 closed questions that fo- cused on sports consumption, healthy lifestyle and qual- ity of life in addition to demographic factors. The data on sports consumption have been always gathered in the currency of the single countries and these values were converted at the current exchange rate (on the 21 Janu- ary 2019, the euro average rate [1 EUR = 318.20 HUF]).
Microsoft Office Excel 2013 Standard suite and the
analyse the questionnaire. We have used descriptive and bivariate statistical methods in statistical data processing.
Mean values, dispersion and ratios were calculated as de- scriptive statistical indicators. Statistical tables and figures were prepared for presenting the data. Both parametric and non-parametric tests were used after checking nor- mality tests as bivariate statistics. We have appliedχ2test, Mann-Whitney test and Kruskal-Wallis test when check- ing the relationship between the frequency categories of physical activity and some nominal and ordinal categories of sociodemographic variables and when checking the dif- ferences between countries’preferred sports locations. In- dependent sample t-test has been used when checking the differences between men’s and women’s sports expendi- tures. ANOVA has been used to test the differences of sports expenditures by marital status, by previous personal sport history and by countries. The significance value was determined to bep< 0.05.
Results
The number of interviewees was 566, of whom 68.6%
were Hungarian (388), 19.4% Polish (110) and 12% Ger- man (68) citizens. The proportion of men (49.8%) and women (50.2%) was almost the same in the sample. The average age of respondents was 33.75 ± 12.4 years, the youngest participant was 18 years old and the oldest was 72 years old (Table 1). The respondents typically live in villages (17.3%), in towns with a population of 50,000 to 100,000 (15.9%), in cities with a population of 100,000 to 200,000 (14.8%) and in the capitals (7.2%). The respon- dents live in three (25.5%) or four (24.5%) member households most commonly.
Table 1Summary of sample characteristics Sample characteristics (N= 566)
Age 33.75 ± 12.4 ys
Gender Male 49.80%
Female 50.20%
Level of Education Elementary 5.80%
Vocational 9.50%
Secondary 38.50%
Tertiary 46.10%
Marital status Single 41.50%
Married 29.90%
Divorced 6.90%
Widow/er 1.10%
Domestic Partnership 20.70%
Nationality Hungarian 68.6%
German 12%
Polish 19.40%
Total (respondents) 566
Respondents mostly do sports alone (38%) or with friends (27.7%). They started to do sports primarily mo- tivated by parents and friends (23.1%) or due to the popularity of the sport (17.7%). Only 11.5% of the re- spondents stated that they never have done sports in their childhood, while 63.3% reported practicing sport for more than 5 years in their childhood.
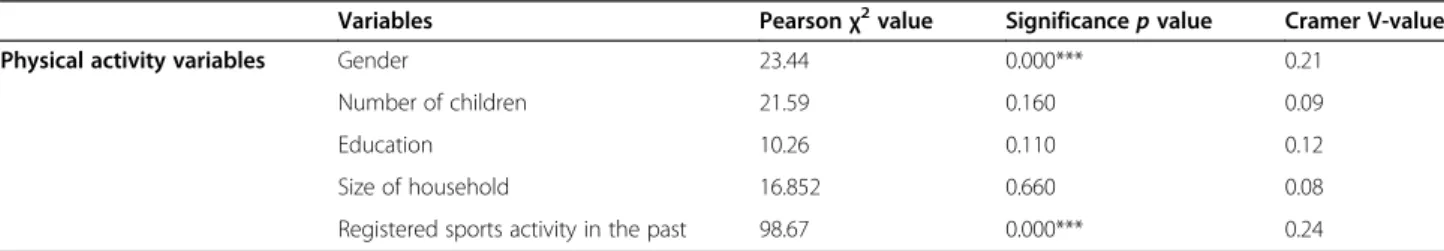
We have examined sociodemographic factors that have an effect on physical activity rates most frequently (Table2).
Cross-tabulation analysis shows after checking the standardised residuals that category doing physical activ- ity regular (based on Eurobarometer nomenclature 1–2 or 3–4 times a week) typically includes men; moreover men who used to be registered athletes. The results of previous studies [15, 18] also draw a clear link between earlier habitual physical activity and current sports habits. Retired or currently active athletes are more likely to engage in regular physical activity. Women pre- fer non-traditional sporting forms, additionally they pre- fer to exercise at home individually or in groups in fitness clubs.
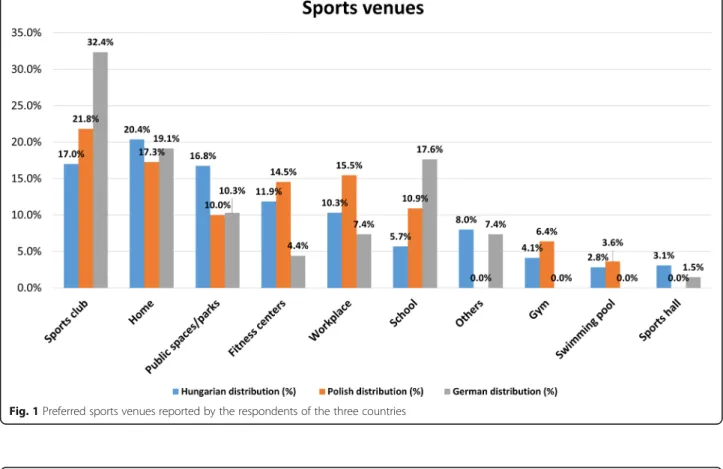
We also have looked to establish a pattern regarding the choice of sports venues (Fig.1). In terms of the countries surveyed, it can be stated that the respondents are the most active in sports clubs, at home and in public/out- doors/parks. We also have quantified the difference be- tween the three countries in the ranking of preferred sports locations (χ2= 48.645;p< 0.01) [15,19–21].
It can be stated that most of the respondents prefer sports clubs in Poland and Germany, while the Hungar- ians prefer their home as a sports venue. Doing sports in the open air (public spaces and parks) is very common (16.8%) in Hungary, while this is less popular in Poland (10%) and Germany (10.3%).
We have examined the items and volume of annual sports expenditures.
Figure2shows that the average value of annual sports spending is HUF 91,856 (EUR 288). It can be seen that the expenditure on sports services has the highest aver- age value with HUF 34,149 (EUR 107) in the examined countries. This item is followed by sports shoes with a value of HUF 22,546 (EUR 70) and by sportswear with almost the same value of HUF 20,950 (EUR 66). It can
also be stated that respondents spend the least amount of money on sports equipment with HUF 16,552 (EUR 52) on an annual basis.
We have examined the effects of sociodemographic and further factors on the volume of sports expenditure per item (Table3).
It can be stated that men’s average spending is more in each examined category – with the exception of sports shoes – but these are not significant differences.
Only the average annual total sports expenditure cat- egory shows a close valuee to the significance threshold (p= 0.061), and the difference in spending on sports ser- vices was significant atp< 0.01.
We have examined the annual sports spending and ex- penditure items in terms of education but no significant differences were found regarding the single items ac- cording to the one-factor variance analysis (ANOVA).
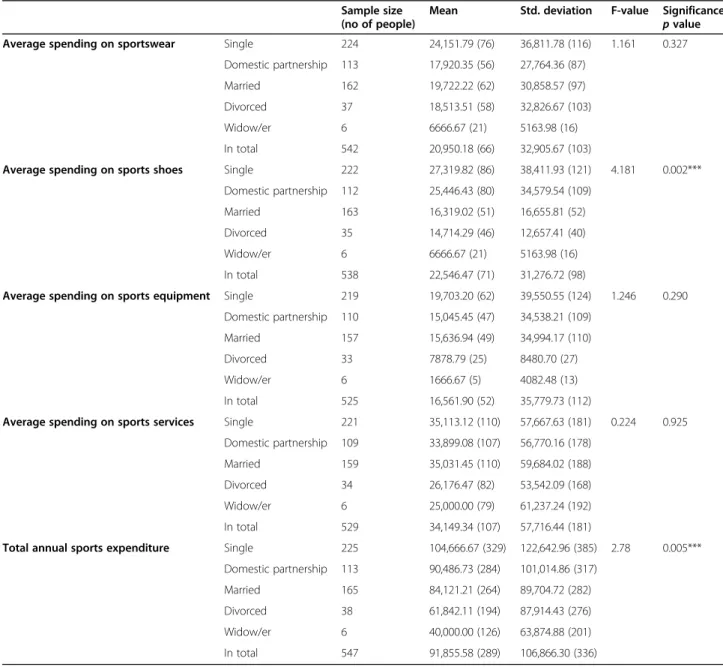
We have examined next the relationship between marital status and annual sports spending (Table4).
The study shows that significant differences were found in the annual average sports spending category (p= 0.005) and in the annual average sports shoes ex- penditure category (p= 0.002). Singles spend signifi- cantly more compared to widow/ers and divorcees in both categories based on our results.
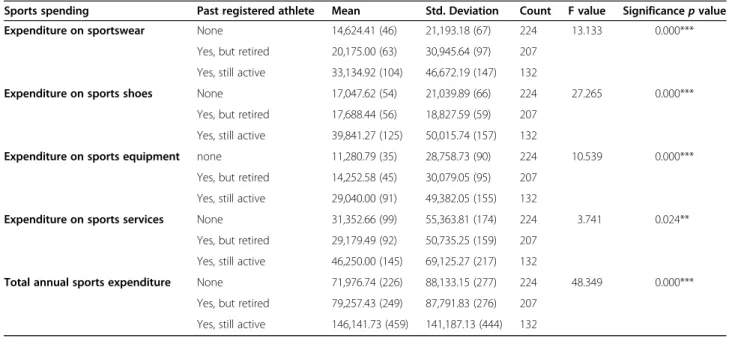
We have got an interesting result when we checked the annual sports spending categories by the factor reg- istered athlete history (Table 5). The three categories (I have never been a registered athlete; Yes, but I am re- tired; I am still a registered athlete) differed significantly in each spending categories (p< 0.000). It can be seen that spending by currently registered athletes is always the highest in each categories while spending is the low- est in the case of people without history of being regis- tered athletes. We only identified one exception in the case of sports services, as respondents who have never been registered athletes are ranked the second in spend- ing on sports services.
The relative value and structure of annual sports spending have been examined too (Tables 6 and 7).
Variance analysis showed that we can identify a signifi- cant difference between the researched countries (F = 6.427; p= 0.002) regarding the average annual total sports expenditure (HUF 91,885).
Table 2Summary of variables affecting physical activity rates
Variables Pearsonχ2value Significancepvalue Cramer V-value
Physical activity variables Gender 23.44 0.000*** 0.21
Number of children 21.59 0.160 0.09
Education 10.26 0.110 0.12
Size of household 16.852 0.660 0.08
Registered sports activity in the past 98.67 0.000*** 0.24
***p< 0.01
Fig. 1Preferred sports venues reported by the respondents of the three countries
Fig. 2The aggregated values for sports expenditures per household for the whole sample in 2017 (HUF)
Table 3The average annual sports expenditure per household by gender of the household’s head in HUF (EUR) Gender
Female Male T-value Significance
pvalue
Mean Std. Deviation Mean Std. Deviation
Expenditure on sportswear 19,540.44 (61) 30,093.15 (95) 22,370.37 (70) 35,514.43 (112) 1.01 0.317 Expenditure on sports shoes 22,769.51 (72) 30,840.93 (97) 22,323.42 (70) 31,762.46 (100) −0.17 0.869 Expenditure on sports equipment 14,131.27 (44) 31,089.99 (98) 18,928.57 (59) 39,735.90 (125) 1.54 0.123 Expenditure on sports services 29,923.95 (94) 52,674.59 (166) 38,327.07 (120) 62,119.20 (195) 1.68 0.091 Annual total expenditure 83,527.27 (262) 93,416.08 (294) 100,275.73 (315) 118,510.19 (372) 1.84 0.061
Table 4Sports spending per household by marital status in HUF (EUR in brackets) Sample size (no of people)
Mean Std. deviation F-value Significance pvalue Average spending on sportswear Single 224 24,151.79 (76) 36,811.78 (116) 1.161 0.327
Domestic partnership 113 17,920.35 (56) 27,764.36 (87)
Married 162 19,722.22 (62) 30,858.57 (97)
Divorced 37 18,513.51 (58) 32,826.67 (103)
Widow/er 6 6666.67 (21) 5163.98 (16)
In total 542 20,950.18 (66) 32,905.67 (103)
Average spending on sports shoes Single 222 27,319.82 (86) 38,411.93 (121) 4.181 0.002***
Domestic partnership 112 25,446.43 (80) 34,579.54 (109)
Married 163 16,319.02 (51) 16,655.81 (52)
Divorced 35 14,714.29 (46) 12,657.41 (40)
Widow/er 6 6666.67 (21) 5163.98 (16)
In total 538 22,546.47 (71) 31,276.72 (98)
Average spending on sports equipment Single 219 19,703.20 (62) 39,550.55 (124) 1.246 0.290 Domestic partnership 110 15,045.45 (47) 34,538.21 (109)
Married 157 15,636.94 (49) 34,994.17 (110)
Divorced 33 7878.79 (25) 8480.70 (27)
Widow/er 6 1666.67 (5) 4082.48 (13)
In total 525 16,561.90 (52) 35,779.73 (112)
Average spending on sports services Single 221 35,113.12 (110) 57,667.63 (181) 0.224 0.925 Domestic partnership 109 33,899.08 (107) 56,770.16 (178)
Married 159 35,031.45 (110) 59,684.02 (188)
Divorced 34 26,176.47 (82) 53,542.09 (168)
Widow/er 6 25,000.00 (79) 61,237.24 (192)
In total 529 34,149.34 (107) 57,716.44 (181)
Total annual sports expenditure Single 225 104,666.67 (329) 122,642.96 (385) 2.78 0.005***
Domestic partnership 113 90,486.73 (284) 101,014.86 (317)
Married 165 84,121.21 (264) 89,704.72 (282)
Divorced 38 61,842.11 (194) 87,914.43 (276)
Widow/er 6 40,000.00 (126) 63,874.88 (201)
In total 547 91,855.58 (289) 106,866.30 (336)
***p< 0.000
The results supported our hypothesis that the average annual sports spending of German households is the highest HUF 131,397 (EUR 413), followed by Hungarian ones.
It seems that there is a significant difference between the examined nations only in terms of expenditures on sports services and in the total annual sports expend- iture. It is clear that the sports consumption of German households is the highest for both items.
Discussion
Our research concluded that men – especially previous athletes – exercise physical activity more than women and those who have no history as registered athletes.
This result is in line with our previous research findings [14,15]. The international literature’s similar results sug- gest that men do sports with higher possibility than women and they send more time with it too. However there are some sports with different characteristics – these are the so called sports for women [22–25]. Based
on Breuer and Wicker [26] the gender differences de- crease with age.
The choice of sports venues is obviously different be- tween the countries in the sample. Doing sports at home is preferred the most in Hungary–which is in line with our previous results [14, 15]– sports clubs are domin- antly the venue of choice in the other two countries at the same time. The question arises whether the reason for this is the limited choice possibilities of sports clubs or the lack of available income that limits Hungarian consumers from using such services.
Members of the study population spend the most on sports services, while spending the least on sports equip- ment as it was expected on the basis of previous re- searches conducted in Hungary [12, 14, 15]. Although there is no significant difference between amount of sports expenditures of single items, it can be clearly stated that men spend more overall on sports than women, which is also consistent with findings by previ- ous researches. Similarly, it has been confirmed that sin- gles spend the most on sports.
Table 5Correlation between sports spending and competitive sport in HUF (EUR)
Sports spending Past registered athlete Mean Std. Deviation Count F value Significancepvalue
Expenditure on sportswear None 14,624.41 (46) 21,193.18 (67) 224 13.133 0.000***
Yes, but retired 20,175.00 (63) 30,945.64 (97) 207 Yes, still active 33,134.92 (104) 46,672.19 (147) 132
Expenditure on sports shoes None 17,047.62 (54) 21,039.89 (66) 224 27.265 0.000***
Yes, but retired 17,688.44 (56) 18,827.59 (59) 207 Yes, still active 39,841.27 (125) 50,015.74 (157) 132
Expenditure on sports equipment none 11,280.79 (35) 28,758.73 (90) 224 10.539 0.000***
Yes, but retired 14,252.58 (45) 30,079.05 (95) 207 Yes, still active 29,040.00 (91) 49,382.05 (155) 132
Expenditure on sports services None 31,352.66 (99) 55,363.81 (174) 224 3.741 0.024**
Yes, but retired 29,179.49 (92) 50,735.25 (159) 207 Yes, still active 46,250.00 (145) 69,125.27 (217) 132
Total annual sports expenditure None 71,976.74 (226) 88,133.15 (277) 224 48.349 0.000***
Yes, but retired 79,257.43 (249) 87,791.83 (276) 207 Yes, still active 146,141.73 (459) 141,187.13 (444) 132
**p< 0.05; ***p< 0.01
Table 6Indicator of annual sports spending per household in HUF (EUR in brackets) in 2017 Nationality Annual sports expenditures (2017)
Mean Std. Deviation Sample size (no. of people) F value Significance
pvalue
Hungarian 89,986.45 (283) 102,981.04 (324) 388 6.427 0.002***
Polish 73,681.82 (232) 96,173.77 (302) 110
German 131,397.06 (413) 132,751.72 (417) 68
In total 91,855.58 (289) 106,866.30 (336) 566
Although there is an identifiable trend that the in- crease in the level of education results increase in sports spending but it is not significant. One of the reasons could be that the sample size at some levels of education was relatively low. There is some contradiction between our conclusions and some international researches that suggest that more educated social groups have increased willingness for engaging in sports [3,4,27,28].
Not surprisingly, German households with the highest living standards have the highest spending rates com- pared to the other two countries. This aspect is only sig- nificant in the category of annual total sports expenditures and annual sports service expenditures – Polish and Hungarian spending figures do not differ sig- nificantly in the case of sportswear, sports shoes and sports equipment. However, a similar trend is observable in all categories when comparing category averages which suggests that material wealth and income level can be a determining factor in the amount of sports spending [13].
Women prefer non-traditional sports opportunities based on the results of our study which is consistent with international researches [19]. They prefer to exer- cise at home individually or in groups in fitness clubs.
Breuer et al. [29] identified cycling and running as men dominated sports, however women were overrepresented in swimming, fitness and gymnastics. Borgers et al. [30]
identified cycling as a sport which is done with higher frequency by men and men spend more time on a cyc- ling, running or tennis training session like women.
It is worth comparing our results with Eurobarometer [31,32] data. While the citizens of the EU would like to
do sports in parks and in nature, Hungarian citizens would like to do the same mostly at home. Some loca- tions popularity grew during the past period in Hungary.
The popularity of doing sports at home (8%), in the workplace (6%), in a sports centre (3%) or in fitness- wellness centres (3%) continued to increase comparing the figures of Eurobarometer 2014 and 2018 [31, 32].
There is a significant difference in terms of the popular- ity of sports centres, sports clubs and fitness-wellness centres, as these sports venues are much less popular in Hungary compared to the EU. The most popular sports venues are parks in 17 of the countries in the EU, it is most prominently in Finland (67%). Respondents nomi- nated the household as the most popular sports venue in nine countries, mainly in Eastern Europe.
The popularity of parks and open-air venues decreased slightly in Germany but they still remained the most popular sports venues in 2018 (39%) consistent with the average EU rate (40%). Home is ranked as the second most popular sports venue both in Germany and the EU in 2018, similarly to the 2014 figures (46%), although this popularity decreased slightly (41%)., The popularity of doing sports in the workplace (18%) and at sports centres (9%) continued to increase compared to 2014 data of Germany. The popularity of fitness centres de- creased slightly (14%) in 2018; however, the popularity of sports clubs (21%) and universities (4%) did not change.
More than half of the respondents (53%) believe that the authorities do not make a sufficient effort at local level to provide residents appropriate infrastructure to do physical activity in Poland. Polish positive Table 7Annual sports spending per household per item in HUF (EUR) in the surveyed countries in 2017
Sports expenditure items Nationality N Mean Std. Deviation F value Significancepvalue Expenditure on sportswear Hungarian 364 19,505.49 (61) 31,915.91 (100) 2.062 0.128
Polish 110 21,181.82 (67) 30,732.10 (97)
German 68 28,308.82 (89) 40,266.00 (127)
Expenditure on sports shoes Hungarian 360 22,277.78 (70) 32,546.61 (102) 0.117 0.889
Polish 110 22,363.64 (70) 24,200.13 (76)
German 68 24,264.71 (76) 34,762.14 (109)
Expenditure on sports equipment Hungarian 347 15,792.51 (50) 34,434.20 (108) 1.705 0.183
Polish 110 14,454.55 (45) 33,306.65 (105)
German 68 23,897.06 (75) 44,936.49 (141)
Expenditure on sports services Hungarian 351 35,911.68 (113) 60,041.85 (189) 10.57 0.000***
Polish 110 15,681.82 (49) 28,344.84 (89)
German 68 54,926.47 (173) 71,401.18 (224)
Total annual sports expenditure Hungarian 369 89,986.45 (283) 102,981.04 (324) 6.427 0.002***
Polish 110 73,681.82 (232) 96,173.77 (302) German 68 131,397.06 (413) 132,751.72 (417)
***p< 0.000
respondents identified parks and outdoor venues as the most frequent sports venues (42%). This location was sec- ond placed (35%) in 2014 and 37% of respondents marked their household as the sports venue they chosen in that year., The number of people exercising in health and fit- ness centres and sports clubs did not change significantly in 2018 compared to the data gathered 4 years previously.
However more than twice as many people (15%) exercised in sports centres in 2018 then in 2014 (6%) [31,32].
Limitations
It must be stated that the sample cannot be considered as representative one because of the convenience sam- pling techniques. However it is able to show tendencies due to large sample size.
Our research is limited only for three countries however a wider range of the EU states would be interesting re- garding their households’sport expenditures similarly like researches of Downward et al. [20] and Hovemann and Wicker [33] about sports participation rates in the EU.
Conclusion
The main findings of the paper are that men–and espe- cially men with previously registered sport history –are more involved into physical activity like women. How- ever we didn’t find a significant effect of the children number in the households, respondents’ educational level and size of households.
There are big differences in preferred sports venues of the three countries. Sports clubs are extremely popular in Germany whilst Hungarians prefer home and public park activities.
The most important sports expenditure category is sports services and we can find significant differences re- garding the category total sports expenditures based on the marital status of the respondents. Previous individual sports past supports the amount of sports expenditures in all categories and German households spend signifi- cantly more on sports than Hungarians and Poles.
Acknowledgements Not applicable.
About this supplement
This article has been published as part of BMC Public Health Volume 21 Supplement 1, 2021: Level and Determinants of Physical Activity in the V4 Countries–Part 2. The full contents of the supplement are available online at URL.https://bmcpublichealth.biomedcentral.com/articles/supplements/
volume-21-supplement-1.
Authors’contributions
DP was the leader of the complete research, has coordinated the different co-authors’work, has systematized the dataset, has summarised the literature related to sports consumption models and has contributed to the conclu- sions. MS, MH and BB have organised the data collection and data structur- ing, they have contributed to the conclusions from the results. PA has made statistical calculations and has contributed to the conclusions from the re- sults. AK, JB, AF have revised the results and have contributed to the conclu-
Authors’information Not applicable.
Funding
This research was partially supported by the Human Resource Development Operational Programme, grant No.: HRDOP-3.6.2-16-2017, Cooperative Re- search Network in Economy of Sport, Recreation and Health.
Availability of data and materials
The datasets used and/or analysed in the current study are available from the corresponding author on reasonable request.
Ethics approval and consent to participate
The ethical approval was granted for the study by Ethics Committee of University of Pécs (Nr. 6955/2017). Participants were informed about the research aim and methods before signing the informed consent form. The investigation conforms to the principles outlined in the Declaration of Helsinki.
Consent for publication Not applicable.
Competing interests
The authors declare that they have no competing interests.
Author details
1University of Pecs, Faculty of Health Sciences, Pecs, Hungary.2Corvinus University of Budapest, Corvinus Business School, Budapest, Hungary.3Pope John Paul II State School of Higher Education in Biala Podlaska, Biala Podlaska, Poland.
Received: 31 January 2021 Accepted: 1 February 2021 Published: 23 April 2021
References
1. András K. The economic foundations of professional sports [A hivatásos sport gazdaságtani alapjai]. In: Ács P, editor. Sport and Economy [Sport és Gazdaság].
Pécs: University of Pécs Faculty of Health Sciences; 2015. p. 434–82.
2. Szabó Á. Economic issues of recreational sports [A szabadidősport gazdasági kérdései]. In: Ács P, editor. Sport and Economy [Sport és Gazdaság]. Pécs:
University of Pécs Faculty of Health Sciences; 2015. p. 434–82.
3. Lera-López F, Rapún-Gárate M. Sports participation versus consumer expenditure on sport: different determinants and strategies in sports management. Eur Sport Manag Q. 2005;5(2):167–86.
4. Lera-López F, Rapún-Gárate M. The demand for sport: sport consumption and participation models. J Sport Manag. 2007;21:103–22.
5. Lera-López F, Rapún-Gárate M. Determinants of sports participation and attendance: differences and similarities. Int J Sports Mark Spons. 2011;12(2):66–89.
6. Thibaut E, Eakins J, Vos S, Scheerder J. Time and money expenditure in sports participation: the role of income in consuming the most practiced sports activities in Flanders. Sport Manag Rev. 2017a;20:455–67.
7. Thibaut E, Eakins J, Vos S, Scheerder J. The determinants and income elasticities of direct and indirect sports expenditure categories. Eur Sport Manag Q. 2017b.https://doi.org/10.1080/16184742.2017.1341539. Accessed 9 July 2020.
8. Davies LE. Consumers’expenditure on sport in the UK: increased spending or underestimation? Manag Leis. 2002;7:83–102.
9. Sport Industry Research Centre (SIRC). Sport market forecasts (2004-2008).
Sheffield: SIRC; 2004.
10. Alt R, Binder A, Helmenstein C, Kleissner A, Krabb P. The economic benefits of exercise–The economic benefits of exercise, the economic costs of inactivity and the potential of more exercise, Der volkswirtschaftliche Nutzen von Bewegung–Volkswirtschaftlicher Nutzen von Bewegung, volkswirtschaftliche Kosten von Inaktivität und Potenziale von mehr Bewegung. Wien: SpEA SportsEconAustria Institut für Sportökonomie; 2015.
https://www.spea.at/wp-content/uploads/2018/12/1512_SpEA_Nutzen_
Bewegung_Endbericht-2.pdf. Accessed 9 July 2020.
11. Ding D, Lawson KD, Kolbe-Alexander T, Finkelstein EA, Katzmarzyk PT, Van Mechelen W, Pratt M. The economic burden of physical inactivity: a global analysis of major non-communicable diseases. Lancet Phys Act Series. 2016;
–
12. Paár D. Economic study of the sports consumption of Hungarian households [a magyar háztartások sportfogyasztásának gazdasági szempontú vizsgálata]. Sopron: University of West Hungary Faculty of Economics; 2013.https://www.tankonyvtar.hu/hu/tartalom/tamop422b/201 0-0018_kotet_04_paar_david/adatok.html. Accessed 6 Apr 2019.
13. Paár D. The income and Price dependency of the Hungarian sport goods consumption. Period Polytech Soc Manag Sci. 2011;19(1):11–7http://www.
pp.bme.hu/so/article/view/1576/894. Accessed 6 Apr 2019.
14. Kovács A, Paár D, Elbert G, Zs W, Stocker M, Ács P. Survey of sports consumption habits of Hungarian households [A magyar háztartások sportfogyasztási szokásainak felmérése]. Pécs: University of Pécs Faculty of Health Sciences; 2015.
15. Kovács A, Paár D, Zs W, Fürész D, Elbert G, Stocker M, Ács P. Current situation of sports consumption habits [Sportfogyasztási szokások alakulásának aktuális helyzete]. Hungarian Sports Sci Rev. 2016;17(68):17–22.
16. Grima S, Grima A, Thalassinos E, Seychell S, Spiteri JV. Theoretical models for sport participation: literature review. Int J Econ Bus Adm. 2017;5(3):94–116.
17. Pawlowski T. The demand for services in the leisure sector–An economic modeling of the spending behavior of private households in Germany based on data from current economic accounts, Die
Dienstleistungsnachfrage im Freizeitsektor–Eine ökonomische
Modellierung des Ausgabenverhaltens von Privathaushalten in Deutschland auf Basis von Daten der Laufenden Wirtschaftsrechnungen. Köln: Deutschen Sporthochschule; 2009.
18. Telama R, Yang X, Viikari J, Välimäki I, Wanne O, Raitakari O. Physical activity from childhood to adulthood: a 21-year tracking study. Am J Prev Med.
2005;28(3):267–73.
19. Troped PJ, Wilson J, Matthews CE, Cromley EK, Melly SJ. The built environment and location-based physical activity. Am J Prev Med. 2010;38(4):429–38.
20. Downward P, Lera-López F, Rasciute S. The correlates of sports participation in Europe. Eur J Sport Sci. 2014;14(6):592–602.
21. Van Tuyckom C, Scheerder J, Bracke P. Gender and age inequalities in regular sports participation: a cross-national study of 25 European countries.
J Sport Sci. 2010;28(10):1077–84.
22. Humphreys BR, Ruseski JE. Economic Determinants of Participation in Physical Activity and Sport. Working Paper Series, Paper No. 06–13, North American Association of Sport Economists; 2006.http://www.holycross.edu/
departments/economics/RePEc/spe/HumphreysRuseski_Participation.pdf.
Accessed 6 Apr 2019.
23. Poupaux S, Breuer C. Does Higher Sport Supply Lead to Higher Sport Demand? A City Level Analysis. Working Paper Series, Paper No. 09–05, North American Association of Sport Economists; 2009.http://www.
holycross.edu/departments/economics/RePEc/spe/PoupauxBreuer_
SupplyDemand.pdf. Accessed 6 Apr 2019.
24. Widdop P, King N, Parnell D, Cutts D, Millward P. Austerity, policy and sport participation in England. Int J Sport Policy Politics. 2018;10(1):7–24.
25. Eakins J. An analysis of the determinants of sports participation and time spent in different sporting contexts. Managing Sport Leisure. 2018;23(3):157–73.
26. Breuer C, Wicker P. Demographic and economic factors concerning the inclusion in the German sport system. A micro-analysis of the years 1985 to 2005. Eur J Sport Soc. 2008;5(1):33–42.
27. Weber W, Schneider C, Kortlücke N, Horak B. Die wirtschaftliche Bedeutung des Sports. Hofmann: Schorndorf; 1995.
28. Thrane C. Sport spectatorship in Scandinavia. A class phenomenon? Int Rev Sociol Sport. 2001;36(2):149–63.
29. Breuer C, Hallmann K, Wicker P. Determinants of sport participation in different sports. Manag Leis. 2011;16(4):269–86.
30. Borgers J, Breedveld K, Tiessen-Raaphorst A, Thibaut E, Vandermeerschen H, Vos S, Scheerder J. A study on the frequency of participation and time spent on sport in different organisational settings. Eur Sport Manag Q. 2016;16(5):635–54.
31. Special Eurobarometer 412–Sport and physical activity [http://ec.europa.
eu/commfrontoffice/publicopinion/archives/ebs/ebs_412_en.pdf. Accessed 6 Apr 2019.
32. Special Eurobarometer 472–Sport and physical activity.https://ec.europa.
eu/sport/news/2018/new-eurobarometer-sport-and-physical-activity_en.
Accessed 6 Apr 2019.
33. Hovemann G, Wicker P. Determinants of sport participation in the European Union. Eur J Sport Soc. 2009;6(1):51–9.
Publisher’s Note
Springer Nature remains neutral with regard to jurisdictional claims in published maps and institutional affiliations.