Training models employing physico-chemical properties of DNA for protein binding site detection
Gergely Pap Institute of Informatics
University of Szeged Szeged, Hungary papg@inf.u-szeged.hu
László Tóth Institute of Informatics
University of Szeged Szeged, Hungary tothl@inf.u-szeged.hu
Krisztián Ádám Institute of Biophysics Biological Research Centre Eötvös Loránd Research Network
Szeged, Hungary adamk@brc.hu Zoltán Hegedűs Institute of Biophysics Biological Research Centre Eötvös Loránd Research Network
Szeged, Hungary hegedus@brc.hu
Zoltán Györgypál Institute of Biophysics Biological Research Centre Eötvös Loránd Research Network
Szeged, Hungary csovi@brc.hu
Abstract—Transcription Factors (TFs) are one of the most important agents acting on gene expression regulation, fundamentally determining the organized functional operation of cellular machinery. At a molecular level, this effect is achieved by the sequence specific physical binding of TF proteins to particular parts of the DNA. Transcription Factors regulate gene expression in complex ways and the detection of their binding sites is an important part of many experiments.
Predicting Transcription Factor Binding Sites (TFBS) from DNA sequence data has been a challenging task in the field of bioinformatics. The abundance of available DNA sequences strongly encourages the use of machine learning for this problem. Until now most of these efforts were primarily based on the traditional nucleotide-based representation of DNA. To elaborate a more detailed description of this macromolecule, we have worked out a new Physico-Chemical Descriptor (PCD) based DNA representation and used it as input for training neural networks to predict TFBSs. We show that the PCD representation is a viable format for deep learning models, and our feature selection investigation highlights the importance of proper PCD subset choices. The distinct prediction efficiencies detected upon the usage of arbitrarily selected feature subsets indicates that the different DNA features affect the DNA binding process of TFs to various extent.
Keywords—convolutional neural networks, transcription factor binding site, physico-chemical and conformational descriptors
I. INTRODUCTION
Transcription Factors play an important role in biology as they regulate gene expression, which is one of the most fundamental cell physiological processes. TFs can bind to DNA strands to control the rate of transcription. Determining if a sequence of DNA contains a Transcription Factor Binding Site (TFBS) is a challenging task. Statistical pattern recognition methods and artificial neural networks have been applied with different success rates to this classification problem. Most of these works [1, 2, 3, 4, 5, 6] use a nucleotide- based data representation, describing the linear chemical structure of the DNA as a string of characters reflecting the order of the nucleotide monomers in the DNA fragments.
However, the DNA-protein interactions are seriously influenced by DNA features not directly represented in the classical nucleotide-based sequence models. Our motivation was to establish a new DNA representation comprising a set of Physico-chemical and Conformational DNA Descriptors (PCDs), which are metrics describing different molecular
characteristics of DNA. This new DNA representation provides an opportunity to establish novel TFBS prediction algorithms and might open a unique way in understanding the molecular events behind the gene expression regulation processes. Here we introduce deep learning models trained on the PCD DNA representation resulting in competitive prediction accuracy compared to the traditional training strategies. In addition to establishing new deep learning based TFBS prediction algorithms, we have also applied feature selection strategies to investigate the roles of different DNA properties during the TF-DNA docking procedure.
II. RELATED WORK
Since the introduction of convolutional networks to the problem of TFBS classification in 2015 by Alipanahi et al. [1], many approaches tried to improve upon the model. Zeng et al.
trained networks to determine the optimal architecture for this task [4]. DeeperBind extended the CNN with a recurrent neural network (RNN) by using Long Short-Term Memory (LSTM) cells [2]. DeepSEA used more convolutional layers to classify the sequences [5]. FactorNet also applied a CNN+RNN architecture and incorporated reverse- complement sequences [3]. Park et al. further improved the performance of deep learning models by using an attention mechanism [6]. Other approaches used DNA shape features and physical properties to enhance the prediction accuracy of SVMs [7, 8]. To the best of our knowledge, this work is the first to use deep neural networks with more than 50 PCD features. Other papers using DNA shape features [9] have a different machine learning approach or dataset, therefore a comparison regarding performance is difficult.
III. NETWORK STRUCTURE
Similarly to previous studies in the field (Alipanahi et al.
[1] and Zeng et al. [4]), our approach also uses convolutional neural networks. One key difference is the size and format of the input space. The number of channels, which would be 4 in case of a DNA sequence, were the number of PCD input types in our method. As we will see, this significantly increases the input size and also the parameter count of our models. As for the number of layers and neurons, after concluding a sparse grid search, two convolutional layers were found to be best with 256 and 64 neurons and ReLU activations. The strides were set to 1 and the size of the convolutional windows was 24. After automatic feature extraction, a max pooling layer followed and finally two fully connected layers were attached
to complete the classification with 1000 and 300 units. We introduced dropout with a probability of 0.5 after the first dense layer to prevent overfitting.
IV. TRANSCRIPTION FACTOR BINDING SITE CLASSIFICATION USING A PHYSICO-CHEMICAL DESCRIPTOR SET
The DNA sequence can be represented by data formats different from a nucleotide-based one . The native, and almost exclusively used representation of DNA is based on the string- like concatenation of letters (A, C, G, T) reflecting the order of the chemical units (nucleotides) of the DNA sequence.
However, other DNA representations can also be used for bioinformatics and deep learning investigations. For this paper, we decided to use physico-chemical descriptors (PCD) as an input for machine learning models. A more detailed description of the PCD DNA representation can be found in our recently released DNA visualisation web portal DRV (DNA Readout Viewer) [10]. The DNA strands physical and chemical properties are not uniform, they inherently form specific patterns contributing to the recognition and detection of TFBSs. The numerical values of PCDs used for deep learning are either derived from physico-chemical measurements or from molecular simulations of all the possible nucleotide dimer and trimer structures. These PCD values correspond to numerous physical and shape properties of the DNA strands, such as the thermodynamic attributes, and the width or depth of the minor or major groove of the double helix.
V. TRAINING MODELS ON ALL 55PCD FEATURES First, we have developed a deep learning system for TF binding site predictions using a collection of 55 PCDs. To test our algorithm, we used the benchmark data for the task of TFBS classification from the Encyclopedia of DNA Elements, ENCODE-DREAM in vivo Transcription Factor Binding Site Prediction Challenge1. We obtained the pre-processed nucleotide sequences from the work of Zeng et al. [1] and website of Convolutional Neural Network Architectures for Predicting DNA-Protein Binding [http://cnn.csail.mit.edu/].
Our networks were trained in a way where the positive sequences contained a TFBS and the negative entities were dinucleotide shuffled versions of them. The DNA sequences were converted to PCD representations by self-developed scripts. First we measured if the PCD DNA representation is suitable for deep learning based TFBS prediction, and whether its efficiency is comparable to the traditional nucleotide based approaches. We selected six TFs (Sp1, Mafk, Cjun, Cmyc, Max and Mxi1) for examination regarding classification accuracy. All investigations were done by using three parallel trainings. The test accuracies of the individual runs were averaged. The overview of our pipeline is shown in Fig. 1. The results of the learned models on PCD and on nucleotide data are in Table I. The observed performance values on both data formats are close to each other.
TABLE I. TFBS ACCURACIES OF 55PCDS AND NUC. RUNS
Fig. 1. The main steps of our workflow. We convert the DREAM5 benchmark nucleotide sequences to PCDs then preprocess them for the convolutional neural network. After the convolutions and a maximum pooling operation, two dense layers are used to classify the entities.
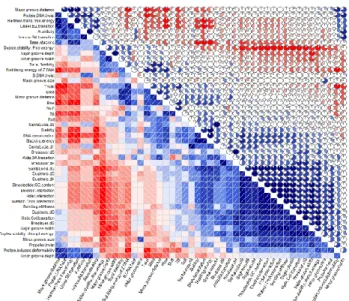
VI. CORRELATION OF PCD VALUES
Our PCD library collected by thorough literature mining contains many PCDs, which correlate with each other in various degree. The reason of this phenomena is that there are several PCDs defined and determined by different concurrent labs TFBS accuracies of 55 PCDs and nuc. runs targeting the same or very similar molecular features. To alleviate this redundancy in our data representation we conducted a correlation analysis. All against all PCD correlation matrix of dimer and trimer PCDs was calculated by the ‘pearson’
method of the ‘corrgram’ R package (Fig. 2.).
A. Creating feature subsets for the learner
Our approach of feature selection for reducing the number of input PCDs was based on thresholding by their correlation values. The main steps are shown in Algorithm 1. We created 3 subsets with different ρ values, after measuring the Pearson- correlation of the 46 Physico-Chemical Parameters (pcp-2) from dimers and the 11 physico-chemical features (pcp-3) from trinucleotides. These subsets are shown in Table VI. For the ρ = 0.5 threshold we further defined two smaller groups,
Fig. 2. Pearson correlogram, determining the Pearson-correlation of dimer PCD features. The shades of blue and red colours and the embedded pie charts indicate the strength of the correlation.
TFs Sp1 Mafk Cjun Cmyc Max Mxi1
PCD 0.6957 0.9258 0.8320 0.7265 0.7387 0.6946 Nuc. 0.7289 0.9238 0.8462 0.7593 0.7662 0.7290
1[https://www.synapse.org/#!Synapse:syn6131484/wiki/]
pcd_3v2 and pcd_3v3 containing [Base stacking, B-DNA twist, Shift, Slide, Major groove depth, Major groove size, Bendability (DNAse), DNAse I] and [Base stacking, B-DNA twist, Shift, Slide, Major groove depth, Major groove size], respectively. To train models without any pcp-3 feature, we dropped the ‘Bendability (DNAse)’ and ‘DNAse I’ features to get the ρ < 0.5v3 group.
B. Results of the models trained using the thresholded subsets
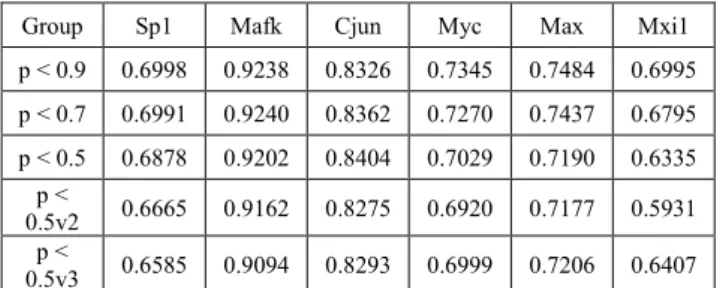
To examine the effect of removing features based on their correlation, we trained CNNs using the thresholded PCD feature groups as the input. Given that some of these values could be considered redundant and the PCD input space is relatively large (compared to nucleotide sequences for example), it is feasible to try and minimize the required features from the input while maintaining high accuracy scores. Our results are shown in Table II. In the case of Sp1, the decrease of accuracy was less than 0.01% when comparing the 0.9 and 0.7 subsets. The largest gap was 4% between the 0.9 and the 0.5v3 feature groups, as was expected. Still, the 0.5v3 subset has 26 less parameters than the parameters of the 0.9 group, so the decrease in the input space size is significant while the obtained prediction accuracy was only slightly decreased.
VII. INCLUDING INDIVIDUAL PCDS IN A SET ORDER We ran model trainings to measure classification performance when the feature set only contains one PCD, and then we started adding PCDs from the ρ <0.5v3 group until we had the same features as in the experiment described in section VII/B. To determine the order of inclusion for the PCD parameters we selected the Sp1 TF and trained models on a reduced ρ <0.5v3 group, where we systematically removed a different PCD from the group until all possible subgroups containing 5 features were used for model input. The ρ <0.5v3 group contains the following elements: [Base stacking (BS), B-DNA twist (BDT), Shift (SH), Slide (SL), Major groove depth (MGD), Major groove size (MGS)]. The results of the Sp1 reductions are in Table III. Test accuracies were averaged from 5 runs. We then increased the size of the feature set from
TABLE II. AVERAGED TEST ACCURACIES OF THE PCD SUBSETS
Group Sp1 Mafk Cjun Myc Max Mxi1
p < 0.9 0.6998 0.9238 0.8326 0.7345 0.7484 0.6995 p < 0.7 0.6991 0.9240 0.8362 0.7270 0.7437 0.6795 p < 0.5 0.6878 0.9202 0.8404 0.7029 0.7190 0.6335
p <
0.5v2 0.6665 0.9162 0.8275 0.6920 0.7177 0.5931 p <
0.5v3 0.6585 0.9094 0.8293 0.6999 0.7206 0.6407
TABLE III. REMOVING ONE PCD FROM THE Ρ <0.5V3 GROUP
PCD MGD MGS BS BDT SL SH
ACC 0.6598 0.6536 0.6535 0.6513 0.6442 0.6394
one up to six incrementally and measured the classification performance for six different TFs (Table IV. and Fig. 3.). The distinct PCDs have a different impact on the ρ < 0.5v3 PCD feature groups’ final model performance. Furthermore, the individual effect of the solo PCDs addition on classification accuracy differ from TF to TF. We averaged the PCD inclusion run results for the selected 6 TFs and observe a steady increase in performance (Fig. 4.).
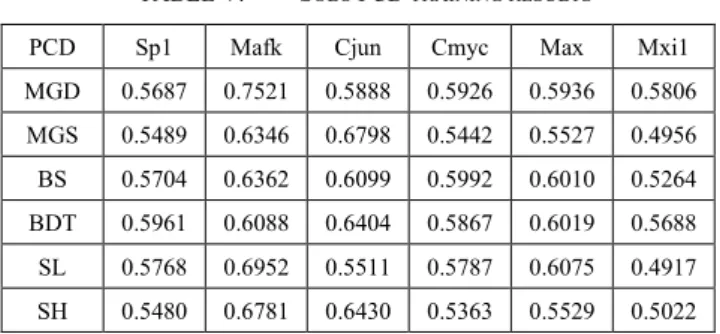
VIII. SOLO PCD TRAINING FROM THE 0.5V3 GROUP To directly test if there is substantial difference between the prediction capacity of different PCDs we have conducted solo feature learnings. Even one PCD is enough to start training, therefore neural networks were trained only using one feature from the ρ < 0.5v3 group for the six TFs used above. The corresponding accuracy averages are in Table V.
for the 6 solo PCDs. In the case of Mxi1, only MGD and BDT resulted in more than 5% accuracy improvement over the baseline 50%. For Mafk, MGD was the most efficient feature from this group. The usage of standalone PCDs for training on a given TF data set results in different prediction performance.
For a given PCD the classification accuracy can vary based on the current TF.
IX. DISCUSSION
Training deep learning models for Transcription Factor Binding Site classification with PCD DNA representation is feasible and comparable to nucleotide-based approaches. The selection of features from the PCD set is of key importance to achieve accuracy close to optimal while decreasing computation costs. The different PCD features influence classification performance in distinct measures. For example the Shift PCD was responsible for an accuracy of 54.8% and 67.8% when trained on Sp1 and Mafk, respectively. We theorize that the PCDs’ effects are TF specific. Apart from the implementation of a PCD representation based convolutional neural network predictor, the analysis of PCD feature selection experiments could provide new insight about the properties of the examined biological systems. This analysis might highlight connections which could help to identify which physico-chemical and conformational properties of
Fig. 3. Adding 1 feature incrementally from the ρ < 0.5 v3 group. Y axis shows the accuracy on the test set.
0 0.2 0.4 0.6 0.8 1
Sp1 Mafk Cjun Cmyc MaxI Mxi1
MGD MGD+MGS
MGD+MGS+BS MGD+MGS+BS+BDT
MGD+MGS+BS+BDT+SL MGD+MGS+BS+BDT+SL+SH
TABLE IV. INCREASING PCD COUNT FROM THE Ρ <0.5V3 GROUP
Fig. 4. Averaging classification performance for the 6 TFs while increasing the learnable PCDs. Vertical axis: accuracy measured on test set.
TABLE V. SOLO PCD TRAINING RESULTS
PCD Sp1 Mafk Cjun Cmyc Max Mxi1
MGD 0.5687 0.7521 0.5888 0.5926 0.5936 0.5806 MGS 0.5489 0.6346 0.6798 0.5442 0.5527 0.4956 BS 0.5704 0.6362 0.6099 0.5992 0.6010 0.5264 BDT 0.5961 0.6088 0.6404 0.5867 0.6019 0.5688 SL 0.5768 0.6952 0.5511 0.5787 0.6075 0.4917 SH 0.5480 0.6781 0.6430 0.5363 0.5529 0.5022 DNA play important roles that are influencing the TF-DNA binding events. This could further help to better understand the binding mechanisms of distinct TFs or TF families.
X. CONCLUSIONS
In this paper we presented neural networks trained on physico-chemical descriptors for the task of Transcription Factor Binding Site classification. While our goal was not to surpass the achievable accuracy of nucleotide sequence-based methods, we show that PCD models are on pair with them and the ability to use PCD features or subsets of features to train models with relatively competitive accuracy could provide insight into the importance of PCDs for different DNA-protein binding events. Future work includes the examination of more advanced architectural choices for the neural networks, such as LSTMs and attention modules. Furthermore, after establishing the effectiveness of solo input features, we will be able to rationally design efficient PCD subsets and use them in bulk TFBS prediction tasks.
XI. ACKOWLEDGEMENT
Gergely Pap and László Tóth were supported by the National Research, Development and Innovation Office of
Hungary through the Artificial Intelligence National Excellence Program (grant no.: 2018-1.2.1-NKP-2018- 00008). This research was supported by grant NKFIH-1279- 2/2020 of the Ministry for Innovation and Technology, Hungary. This research was supported by grant NKFIH-1279- 2/2020 of the Ministry for Innovation and Technology, Hungary. This work was a collaboration between the Bioinformatics Group of the Biological Research Centre, Szeged and the Institute of Informatics, University of Szeged.
ZH and LT equally contributed to this study. The research presented in this paper, carried out by GP and LT was supported by the Ministry of Innovation and the National Research, Development and Innovation Office within the framework of the Artificial Intelligence National Laboratory Programme.
XII. REFERENCES
[1] B. Alipanahi, A. Delong, M. T. Weirauch and B. J. Frey, “Predicting the sequence specificities of DNA- and RNA-binding proteins by deep learning,” Nature Biotechnology, vol. 33, p. 831–838, 8 2015.
[2] H. R. Hassanzadeh and M. D. Wang, “DeeperBind: Enhancing prediction of sequence specificities of DNA binding proteins,” in 2016 IEEE International Conference on Bioinformatics and Biomedicine (BIBM), 2016.
[3] D. Quang and X. Xie, “FactorNet: A deep learning framework for predicting cell type specific transcription factor binding from nucleotide-resolution sequential data,” Methods, vol. 166, p. 40–47, 2019.
[4] H. Zeng, M. D. Edwards, G. Liu and D. K. Gifford, “Convolutional neural network architectures for predicting DNA-protein binding,”
Bioinformatics, vol. 32, p. i121–i127, 2/14.
[5] J. Zhou and O. G. Troyanskaya, “Predicting effects of noncoding variants with deep learning-based sequence model,” Nature Methods, vol. 12, p. 931–934, 2015.
[6] S. Park, Y. Koh, H. Jeon, H. Kim, Y. Yeo and J. Kang, “Enhancing the interpretability of transcription factor binding site prediction using attention mechanism,” Scientific Reports, vol. 10, p. 13413, 2020.
[7] J. Li, J. M. Sagendorf, T.-P. Chiu, M. Pasi, A. Perez and R. Rohs,
“Expanding the repertoire of DNA shape features for genome-scale studies of transcription factor binding,” Nucleic Acids Res, vol. 45, p.
12877–12887, 2/14.
[8] W. Ma, L. Yang, R. Rohs and W. S. Noble, “DNA sequence+shape kernel enables alignment-free modeling of transcription factor binding,” Bioinformatics, vol. 33, p. 3003–3010, 2/14.
[9] S. Wang, Z. Shen, Y. He, Q. Zhang, C. Yuan, X. Qin, H. Wu and X.
Zhao, “A New Method Combining DNA Shape Features to Improve the Prediction Accuracy of Transcription Factor Binding Sites,” in Intelligent Computing Theories and Application, Cham, 2020.
[10] K. Adam, Z. Gyorgypal and Z. Hegedus, “DNA Readout Viewer (DRV): visualization of specificity determining patterns of protein- binding DNA segments,” Bioinformatics, vol. 36, p. 2286–2287, 12 2019.
0.5 0.55 0.6 0.65 0.7 0.75
MGD MGD+MGS MGD+MGS+BS MGD+MGS+BS+BDT MGD+MGS+BS+BDT+SL MGD+MGS+BS+BDT+SL+SH
Addition of PCDs Sp1 Mafk Cjun Cmyc Max Mxi1
MGD 0.5804 0.6957 0.5455 0.5841 0.6055 0.4917
MGD+MGS 0.5796 0.8377 0.7540 0.5711 0.6195 0.5088
MGD+MGS+BS 0.5974 0.8798 0.7353 0.6218 0.6644 0.5874
MGD+MGS+BS+BDT 0.6007 0.8968 0.7712 0.6426 0.6743 0.5898
MGD+MGS+BS+BDT+SL 0.6367 0.9048 0.8241 0.6890 0.7071 0.6291
MGD+MGS+BS+BDT+SL+SH 0.6588 0.9075 0.8271 0.7022 0.7225 0.6475
XIII. SUPPLEMENTARY MATERIAL
TABLE VI. 55PCDS (44 DIMER [PCD_2] AND 11 TRIMER [PCD_3])
GROUPED BASED ON THEIR CORRELATION
pcd_2 <0.5: pcd_2 <0.7: pcd_2 <0.9:
Base stacking Base stacking Base stacking
B-DNA twist B-DNA twist B-DNA twist
Shift Shift Shift
Slide Slide Slide
Major groove depth Major groove depth Major groove depth
Major groove size Major groove size Major groove size
Aida BA transition Aida BA transition
A-philicity A-philicity
Dinucleotide GC content Dinucleotide GC content
Rise Rise
Roll Roll
SantaLucia dH SantaLucia dH
Minor groove size Minor groove size
Breslauer dG Breslauer dH DNA denaturation Propeller twist Protein DNA twist
Protein induced deformability Sarai flexibility
Stability Sugimoto dH Tilt Twist
Major groove width Minor groove depth Minor groove distance
pcd_3 <0.5: pcd_3 <0.7: pcd_3 <0.9:
Bendability (DNAse) Bendability (DNAse) Bendability (DNAse)
DNAse I DNAse I DNAse I
Trinucleotide GC content Trinucleotide GC content Trinucleotide GC content
Consensus rigid Nucleosome rigid
![TABLE VI. 55 PCD S (44 DIMER [ PCD _2] AND 11 TRIMER [ PCD _3])](https://thumb-eu.123doks.com/thumbv2/9dokorg/998072.61755/5.892.73.819.219.978/table-vi-pcd-s-dimer-pcd-trimer-pcd.webp)
