Nuclear Engineering and Design xxx (xxxx) xxx
0029-5493/© 2020 The Authors. Published by Elsevier B.V. This is an open access article under the CC BY license (http://creativecommons.org/licenses/by/4.0/).
Infrared observation of ballooning and burst of nuclear fuel cladding tubes
Rich ´ ard Nagy
a,b, M ´ arton Kir ´ aly
a, P ´ eter Petrik
a,*, Zolt ´ an H ozer ´
aaCentre for Energy Research, Budapest, Konkoly-Thege Mikl´os Road 29-33, Hungary
bObuda University, Doctoral School on Material Sciences and Technologies Budapest, B´ ´ecsi Road 96/b, Hungary
A B S T R A C T
Nuclear fuel claddings can balloon and rupture at high temperatures under internal gas pressure in case of design basis accidents like loss-of-coolant-accident (LOCA).
The thermal phenomena surrounding the ballooning and cracking was investigated in a series of experiments performed using zirconium alloy cladding tubes at the Centre for Energy Research in Hungary.
The experiments were recorded using a high-speed infrared camera in the intermediate infrared range and the temperatures were measured in-situ. It was found that before the rupture of the cladding tube, the ballooned cladding surface forms a bulge and heats up locally, a hot spot appears. During crack propagation, the crack tip temperature is significantly warmer than the rest of the tube. The hot spot temperature and the rate of temperature increase was determined. The infrared emission coefficient of the slightly oxidized zirconium cladding samples in the intermediate infrared range was also determined. The emissivity coefficient that fit our measurements was found to be around ε =0.89.
1. Introduction
A nuclear fuel cladding should maintain good performance without serious degradation under normal operating conditions, and also under various accident conditions, such as loss-of-coolant accident (LOCA).
Understanding the failure mechanism of traditional and the new acci- dent tolerant fuel claddings is key to safety in case of accidents. It is very important to investigate the behaviour of fuel claddings under simulated accident conditions, especially after the severe accident at Fukushima Daiichi Nuclear Power Plant (The Fukushima Daiichi Accident).
The integrity of fuel cladding can be compromised by ballooning (diameter increment with wall thickness reduction) and burst (crack formation and propagation) caused by the pressure difference between the inner and outer sides of the cladding. First the wall thickness de- creases uniformly, then an area on the cladding experiences runaway expansion and the rapid weakening of the wall eventually results in burst. Local regions close to the crack could become oxidized and hydridized in reactors.
The ballooning and burst of nuclear cladding tubes has been inves- tigated for decades. Several integral tests were carried out on single fuel rods or cladding tubes to determine the failure pressure with respect to either the temperature or the pressure increment rate (Hozer, 2005; ´ Hozer et al., 2015; Wiesenack, 2013; Yegorova et al., 2005; Erbacher ´ and Leistikow, 1985; Erbacher et al., 1982; Powers and Meyer, 1980;
Billone, 2008; Billone et al., 2008; Brachet et al., 2017; Wu et al., 2018;
Shewfelt, 1988). Two methods were used to induce the burst, isothermal
or isobar conditioning. Multi-rod fuel assemblies with inserted heating elements were also investigated for experimental simulation of accident scenarios, coolability and assembly failures (Hozer et al., 2006; Stuckert ´ et al., 2013). The effect of dissolved hydrogen (Suman, 2020), secondary hydridization (Hozer et al., 2018) and hydrogen distribution around the ´ burst (Kozsda-Barsy et al., 2018) were also investigated, some of the samples were subjected to metallographic measurements (Stuckert et al., 2013).
A ballooning and burst test rig was developed (R. Nagy, M. Kir´aly, T.
Szepesi: Optical measurement of the high temperature ballooning of nuclear fuel claddings. Review of Scientific Instruments, Vol. 89, Issue 12, 2018) at the Centre for Energy Research in Hungary (EK, formerly KFKI AEKI). E110opt Zr1%Nb cladding tube samples were used for the tests. The E110 cladding, that has been used in VVER reactors for many decades in different countries (Shebaldov et al., 2000; Novikov et al., 2011; Design and Performance of WWER Fuel, 1996), is traditionally produced on electrolytic basis material. The Russian fuel manufacturer has introduced the newly developed alloy E110opt (sometimes called E110G) based on sponge zirconium material with reduced hafnium content and up to 500 ppm iron (Nikulin et al., 2011; Kir´aly et al., 2019).
The previous measurements (Nagy et al., 2017, 2018) gave an extensive and accurate picture of thermo-mechanical phenomena during the ballooning and burst. The increase in cladding diameter during the ballooning was measured based on the contour line of the samples captured by standard DSLR cameras at 50 frames/s. It was observed that the high-pressure argon caused an asymmetric bulge formation on the
* Corresponding author.
E-mail address: petrik.peter@ek-cer.hu (P. Petrik).
Contents lists available at ScienceDirect
Nuclear Engineering and Design
journal homepage: www.elsevier.com/locate/nucengdes
https://doi.org/10.1016/j.nucengdes.2020.110942
Received 23 August 2020; Received in revised form 3 November 2020; Accepted 4 November 2020
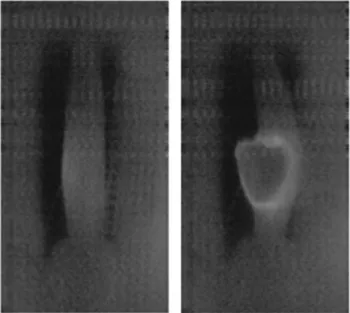
fuel cladding tube at around 75–80% of the maximum pressure before burst. The sample tube bent during bulge formation (ballooning), and this permanent deformation occurred before the crack formation (burst). The crack formation and propagation always occurred on the convex side of the bend. A high-speed optical camera with speeds up to 100,000 frames/s was also used in our previous tests. Using this camera, it was found that the surface of samples brightened near the bulge before the crack formation. After the burst, the edge of the rupture remained lighter, supposedly hotter than its environment (Fig. 1). The purpose of the infrared camera measurements detailed below was to confirm the existence of hot spot that appears before the crack opening. This infor- mation would be useful to support numerical and analytical theories to describe the ballooning and burst phenomena.
2. Experimental
The tests were conducted at isothermal conditions. The samples were heated up to high temperatures in inert atmosphere in a three-zone tube
furnace that was designed with two telescopes mounted on its sides. The quartz lens telescopes were able to operate at up to 1000 ◦C with min- imal picture error. A self-developed National Instruments LabView Virtual Instrument (VI) was used to control the pressure increment and also for data acquisition using a 12-channel A/D converter (MC-2408- 2AO) as seen in Fig. 2. A calibrated pressure transducer provided analogue signal to the program, which calculated the average pressure increment in time and controlled a stepper motor to operate the needle valve. The internal pressure increment rate was set between 2 kPa/s and 600 kPa/s, the pressure increase was linear (Nagy et al., 2018).
These samples made of E110opt alloy cladding tubes (9.1 mm external diameter and 0.67 mm wall thickness) were prepared as fol- lows: the samples were cut by lathe to 85 mm and were plugged at one end by a welded zirconium plug. An iron sealing adapter was welded to the other end of the tubes, which were then connected to an argon feeder tube by a cutting ring tube connector. 99.999% pure argon gas was used for the internal pressure increment during these tests. During the mea- surements, samples were hanging into the vertical, three-zone, electri- cally heated, stainless steel tube furnace within a flowing argon atmosphere. Temperature measurements were performed using K-type thermocouples. These were used to control the internal temperature of the furnace and the samples were also equipped with thermocouples to measure their surface temperature at different positions. The thermo- couples were attached to the samples by stainless steel wire near the upper and lower ends of the samples, 10 mm and 30 mm from the ends of the samples, respectively.
For the purpose of investigating the hot spot on the surface of clad- ding tube samples, our electrically heated three-zone tube furnace was paired with a high-speed, high resolution infrared camera. This article reports on the development on this new test, then describes calibrations and the results of the measurements. The goal of this measurement was to determine the actual temperature increase of the hot-spot that ap- pears prior to the crack formation and the temperature increase of the crack tip after the burst.
An infrared camera is a device that combines the benefits of ther- mographic and video measurements. A fast and high-resolution device is used to collect thermal information that cannot be measured so quickly by another device. The camera can be used for non-contact thermal and quantitative thermographic measurements, as well as for measuring the spatial distribution of the surface temperature of the object being measured. Changes in the temperature of the surface can be measured and can also be recorded over time.
The furnace had two camera holes on its sides, positioned opposite to each other. On one side the heat resistant lens was focused and a DSLR camera was used to capture the whole test at fullHD resolution. An InfraTec ImageIR 5300 HP, remote PC-driven camera was mounted to the side of the furnace. This camera had a germanium lens with anti- reflecting metal film coating. Effective focal length of the objective lens was 570 ±10 mm, the focal ratio was f/3, the object distance was 300 mm. The depth of field was more than 10 mm, larger than the diameter of the samples. The wavelength of the spectra captured by the camera was 2.0 to 5.7 µm (intermediate infrared range, MWIR). The detector was a quantum well infrared photodetector (QWIP, InSb) chip with resolution of 640 ×512. This type of detector is the most sensitive in the range of MWIR. The sensor was cooled by thermo-electric Peltier- device (doped bismuth telluride) that was monitored with an off-chip sensor.
In the camera, on-chip dark correction was integrated. The manu- facturer has set the same working point for each pixel, which gives the same photon gain factor. This setting depended on the surface temper- ature of the chip, so that the dark current correction was performed according to our detector temperature. The A/D converter had a 16-bit resolution. The chip could record up to 350 images in one second, which could be easily read by using snap-shot technology. The pixels simul- taneously integrate the signal per pixel over the entire chip surface in the exposure time interval. This allowed to get a sharp image of a fast- Fig. 1. A cladding sample right before the burst (left) and one frame later, just
after the burst. The edge of the rupture is lighter/hotter than its environment (recorded at 2000 frames/s).
Fig. 2. Flow chart of pressure control and data acquisition.
moving subject. Thermal resolution was around 100 mK at 800 ◦C. There was no internal memory in this camera. On-chip binning was not used either. The computer could register and record at 350 frames/s for up to 3 min, which was enough to capture the whole test for all the samples.
As the quartz lenses couldn’t be used for the infrared camera, the camera hole on the side of the furnace was open. During the burst, small pieces of metal broke off from the samples. These pieces could have damaged either the anti-reflective coating or the lens of the infrared camera. In order to protect the camera, a thin protective polyethylene film was used. This protective film also helped to keep an inert atmo- sphere inside the furnace. This film was mostly transparent in the infrared range we measured. Calibration measurements were made in order to eliminate the effect of the protective film and to determine the emission coefficients of the samples.
Eight samples were prepared for the tests. The pressure increment rate and the temperature were chosen to induce large scale ballooning of the samples. The samples were placed into the furnace so that the lower third of the sample was in view of the cameras. Based on previous measurements (Nagy et al., 2018), the crack formation was expected in this lower region. The results are summarized in Table 1. The first two samples were used to test the assembly and the cameras and only the following six tests were analysed in detail.
3. Calibration
The infrared camera sends raw intensity data to the computer. Three key parameters have to be given to the camera’s image conversion software (IRBIS-3 by InfraTec GmbH. (https://www.infratec.eu/ther- mography/thermographic-software/irbis3/) to transform the saved in- tensity data into temperature data: the background radiation temperature, the average emissivity of the sample and the transmissivity of the media between the camera and the sample. The goal of our cali- bration was to find an emissivity coefficient to achieve a good fit be- tween the measured and the calculated temperatures.
The infrared image of the object is generated by the exitances of two sources, namely self-emission and background reflection. The back- ground consists of two components: the laboratory background and the reflective radiation from the inner wall of the furnace. First, the back- ground infrared radiation had to be taken into account as it was reflected Table 1
Experimental data of samples.
Sample Pressure increment rate
(kPa/s) Temperature
(◦C) Burst pressure (kPa)
Test 1 42 790 6510
Test 2 48 795 5450
Sample 1 49 800 6570
Sample 2 53 800 8070
Sample 3 53 795 7220
Sample 4 218 860 5650
Sample 5 100 827 3960
Sample 6 91 853 4660
Fig. 3. Converted infrared image of Sample 1 at the beginning of the test (left) and right before the burst (right).
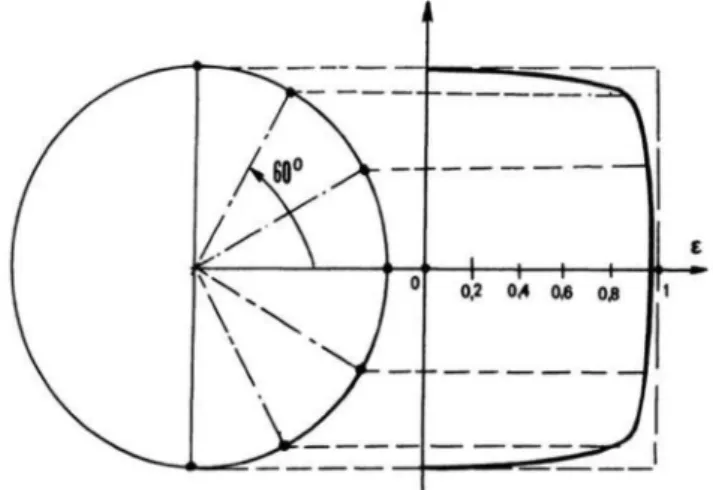
Fig. 4.Emission effectiveness of a cylindrical sample with the directional de- pendency of the emission coefficient.
from the surface of the samples. This radiation originated in the furnace.
The steel retort tube surface radiating heat was reflected from the samples. The temperature of the retort tube was determined by the K- type thermocouple data of the PID controller of the furnace.
Furthermore, the captured infrared images showed a clearly visible brighter band through the middle of the samples (see Fig. 3). This band had the same temperature as the rest of the sample, but it reflected the largest intensity of the 22 ◦C laboratory background radiation that entered into the furnace via the camera hole. This scattered laboratory background reflection caused a seemingly cooler central region on the tube, but this was negligible at the sides. In order to avoid this reflection, we only took measurements to the sides of this central band. The camera gave a sharp image of about 32 mm of the sample. The sides of the image show much colder temperatures as these were not directly visible through the camera hole.
The intensity measured by the infrared detector is a function of the temperature of the radiating element and the emissivity. The emission coefficient depends on the material and the direction of observation.
During the tests, an emission distribution was considered according to Fig. 4. This samples were considered as ideal, cylindrical, isothermal radiating black bodies with uniform surface temperatures. The camera was defined to be infinite distance away in paraxial approximation. The surface of the cylinder radiates into every angle with equal luminosity (energy integral of its Planck function). The video frames were consid- ered as a luminosity integral of the entire sample in the field of view of the camera.
As it can be seen on Fig. 4, the effective emission from the cylindrical sample in the direction of the camera decreases rapidly at the edges of the sample. This effect was detected on the recorded frames as cooler stripes at the very edges of the sample (as seen on Fig. 3). Therefore, the edges were also excluded from the temperature measurement, and only those points were used where the shape effect caused minimal distor- tion. The emission parameter is considered to be the same in the experiment in the interval of − 30◦<α <30◦and the error is small up to
±60◦. This was confirmed at the beginning on the tests as the surface temperature of the samples (excluding the edges and the central band) was found to be relatively uniform (left side of Fig. 3).
The formation of a thin zirconium-oxide layer is very rapid at high temperatures on the cladding tubes. As the furnace was not well sealed on the side of the infrared camera, oxygen or water vapor might have entered into the inert atmosphere, so it was expected that as the surface oxide layer thickens, the non-metallic emission coefficient becomes increasingly dominant. The expected emissivity of the metal and the ceramic oxide was very different in the infrared range of the camera. In the literature, the emission coefficient for most metals is very low, ε =
0.2, while the emission of non-metals is ε =0.7 in the MWIR. In general, the emissivity of fresh cladding is low, and when oxidation proceeds, the emissivity is higher. Therefore, it was expected for the emissivity of the metallic sample to be much lower than the emissivity of the oxidized surface, but in this experimental programme we found it to be otherwise.
In order to have the same surface temperature of the sample in the converted images as the values measured by the thermocouples, we had to input high emissivity coefficients in the IRBIS software.
The very low level of oxidation of the metallic samples (a few µm of oxide) may have been enough to obscure the pure metal completely, and in fact we have never been able to measure the emissivity of the pure metal. However, in this setup we could not achieve completely inert atmosphere as the infrared camera needed direct line of sight of the samples with no material other than a thin protective film in between. It was not seen as a crucial problem, as in a LOCA scenario, the claddings aren’t expected to be pure, as normal corrosion and oxidation in high temperature steam also produces oxide on the surface.
After the series of tests were completed, two samples were sent to InfraTec GmbH., the company that developed the IR camera we used.
One sample was part of this series, and was only minimally oxidized, while the other one was an older test sample, which had a white oxide layer of around 20 µm. The emission coefficient was measured in direct and indirect setup. In the direct measurement, the samples were in contact with an electric heater, and were partially covered in graphite- based paint, as seen in Fig. 5. These measurements were done at tem- peratures between 80 ◦C and 300 ◦C. In the indirect measurement the infrared light reflected from a heat radiator was measured on the room- temperature samples. The results are collected in Table 2. The purpose of this measurement was to estimate the error of the temperature mea- surement during the tests caused by the possible change in the infrared emission coefficients.
The results showed that the emissivity doesn’t depend on the sample temperature, and that the emissivity of the slightly-oxidized and the heavily-oxidized samples are close. It shows that the emissivity doesn’t change too much during the tests, so we could use the same emissivity coefficient for the whole test. On the converted IR image (right hand- side of Fig. 5) it can be seen that the oxidized sample is hotter than Fig. 5. Determination of the emission coefficient of the two burst samples. The direct measurement arrangement (left) and the result of the measurement can be seen in the image conversion software (right).
Table 2
The measured emission coefficients of the two samples seen on Fig. 5.
Sample Metallic sample Oxidized sample
Setup measured ε
(direct) measured ε
(indirect) measured ε
(direct) measured ε (indirect) Emissivity 0.91–0.98 0.89–0.94 0.74–0.93 0.8–0.93
the metallic sample, while the two were heated to the same temperature.
As the emissivity of the oxide is lower, the oxidized sample cools down more slowly. This is due to the different thicknesses of the oxide layer, as where the oxide is chipped and the metal comes to the surface, the local temperature measured is similar to the metallic sample. This method could also be used to estimate the thickness of the oxide on the surface of the tubes.
This effect was also seen in the captured burst tests, as the temper- ature of the inner metallic surface of the opened samples was 5–10 ◦C lower than the temperature measured on the slightly oxidized outer surface, depending on the extent of oxidation. The direct emissivity was considered in our measurements as the research question investigated here was the local heat-up of the samples, while the indirect reflection remained about the same.
To estimate the error in our measurement due to the inaccuracy of the emissivity coefficient, a simple calculation was used. In the image conversion software, the emission coefficient of the sample was
investigated in the interval of ε =0.7–0.95 using real captured data. The temperature of the surface of the samples changed by the change in emissivity, but the temperature difference between parts of the image remained similar, meaning the temperature difference was not sensitive to the error in the emissivity coefficient. The maximum error in tem- perature difference between ε =0.7–0.95 was 25%, meaning if for ε = 0.7 the ΔT between two points was measured as 20 ◦C, then using ε = 0.95 the ΔT was 15 ◦C. As the real emission coefficients in our tests did not differ so much, we could clearly state that the measured temperature differences were real and were only slightly influenced by the errors in emissivity. Furthermore, a reasonable uncertainty of ±3 ◦C for each measured temperature could be derived from this calculation.
The infrared transmission of the protective film was also determined.
The film decreased the intensity of the radiation passing through, so the measured temperature of the samples was below their true temperature.
To compensate for this difference, we performed a calibration mea- surement using an as-received tube sample and an already ballooned Fig. 6. Calibration measurement using Sample 5 (left) and an as-received tube (right). The colour scale was set to 0–600 ◦C temperature range. The bottom half of the image shows the effect of the protective film.
sample (Sample 5) that had a thin oxide layer (Fig. 6). These were heated to 800 ◦C in the furnace simultaneously. The measurement was per- formed by removing the samples from the furnace and placing them outside into the camera field of view. The field of view was divided into two parts, the lower half was covered by the thin polyethylene film, the other half was measured directly. The samples were equipped with thermocouples. The thermocouple data acquisition was synchronized to the infrared camera and the measured temperature series were compared. Even distribution of temperature and even cooling rate was considered on the surfaces of both samples in the area of interest. The transmissivity of the protective film was determined to be around 80%.
The infrared video measurements were then corrected by the trans- mission of the protective film using the conversion software.
4. Results
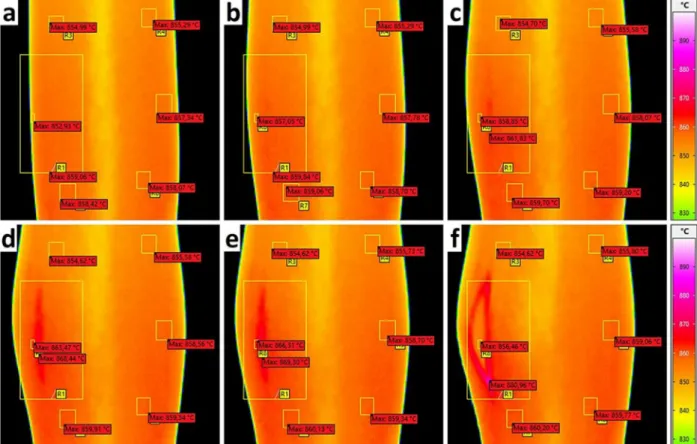
In Fig. 7 the burst of Sample 6 can be seen, broken down into indi- vidual frames. The room temperature as background noise was at 22 ◦C, reflection background was set to 950 ◦C and the emission coefficient of the sample was set to ε =0.89 in the software to fit the value given by the thermocouples. The thermocouples attached to the sample indicated 853 ±5 ◦C, the average temperature of the sample in this frame was 855.5 ◦C using this emission coefficient. This emissivity is halfway be- tween the previous metallic and oxidized samples, therefore this sample could be considered as slightly oxidized.
To examine the temperature change, small measurement regions were placed on the sequence of images in the software. The location of pixel with the highest temperature was marked in each region. The largest region (R1) covers the whole crack formation area and gives the maximal temperature of the sample. There is a slight rise in temperature during the inflation/ballooning stage. The hottest point was always near the position where the crack later occurred. After the rupture, the sud- den outflow of argon gas adiabatically cooled the tube, and small torn- off pieces of the cladding could be identified (as seen in previous
measurements (Nagy et al., 2018).
In order to find out if the local temperature increase is due to a change in the shape of the sample or a real increase in temperature, we examined the infrared images of Sample 6 where the crack had formed in view of the camera and we could see inside the tube (Fig. 7, frame f;).
When Sample 6 split open, the inner surface certainly could not be oxidized in such a short time. We also assumed that due to the good thermal conductivity of metal, the surface of the tube wall had the same average temperature inside and outside. The local heating of the samples before and during the burst was not caused by an optical phenomenon resulting from a change in the curvature of the tube, nor by an altered emission coefficient of the slightly oxidized outer surface. The evolution of the temperature change correlated with the local increase in tube Fig. 7. Crack propagation on Sample 6 in the last two seconds before the burst. The frame numbers for frames a; to f; are 1, 525, 640, 699, 700, 701 respectively.
Fig. 8. The maximum temperature of Sample 6 in an area around the burst (R1) and on the other side of the sample in a control region (R6) with the corre- sponding error bars.
radius, which also supports the fact that the heating can be attributed to the change in stress and the mechanical work in the metal, caused by the high-pressure gas.
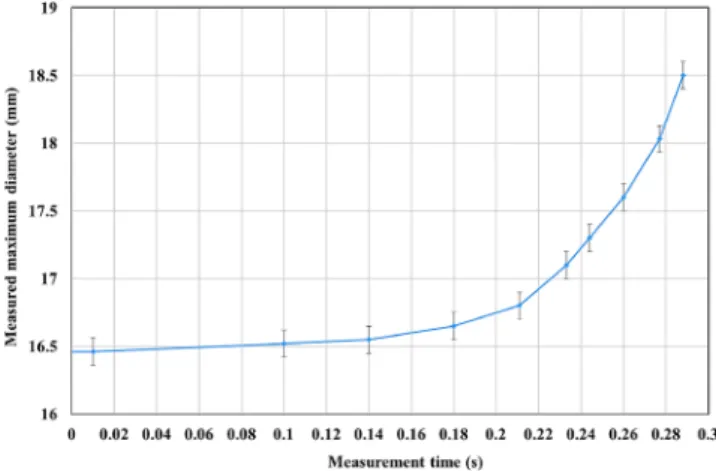
It can be seen in Fig. 7 that the average outside temperature of the sample was between 854 and 859 ◦C, while the temperature inside the tube was measured as 856 ◦C one frame after the cracking, while the adiabatic cooling effect of the escaping gas could not be felt. The local heat-up before the crack opening was around 869 ◦C, which is at least 10 ◦C higher than the average surface temperature measured on the other side of the bulge. It can also be seen that the tip of the crack right after the burst is 25 ◦C warmer than the average (maximum temperature on region R1 was 881 ◦C), significantly higher than the rest of the sample. Fig. 8 shows the temperature variation of the hottest point in region R1 (hot spot) and a ‘control’ region on the other side of the sample before the burst. It shows that the temperature increase is sig- nificant, higher than the range of accuracy and uncertainty of the measurement. The highest temperature in the burst region is the crack tip at the point of burst, the sudden decrease in temperature afterwards was caused by the adiabatic cooling effect of the escaping argon gas. In Fig. 9 the estimated outer diameter of Sample 6 is shown based on the video captured by the infrared camera. The calibration reference for the pixel scale to mm was based on the unloaded sample (diameter 9.1 mm) at the beginning of the test. The time scale on Figs. 8 and 9 are similar, which means 2 mm diameter increase in the last 0.3 s before the burst (about 100 video frames) corresponds to the local heap-up of approxi- mately 8 ◦C.
It is not likely that the heat-up was caused by increased oxidation as though the samples did oxidize slightly during the tests, the atmosphere was still mostly inert. Furthermore, increased oxidation would require
fresh metal to be available, but we did not see such high temperatures in the uniform swelling phase, even though during this phase the diameter increase was slow, but also significant, up to 30%. The same phenom- enon of local heat-up was observed at two measurement temperatures, though the bulge formation was different. We propose that the local heat-up, that is localized to the area of the non-uniform bulge formation, was caused by the fast mechanical work done by the inner pressure on the cladding wall, similarly to the intense heat-up of the crack tip.
Every measured sample behaved similarly, but the crack opening was different in each test. The approximate azimuthal position of the crack and the burst opening relative to the position of the IR camera was determined based on the captured images, as seen in Fig. 10. The results of the temperature measurements (without the additional uncertainty of
±3 ◦C) are shown in Table 3. Sample 5 ruptured in the opposite direction to the infrared camera, therefore the measured heat-up of this sample was not significant. For those samples that ruptured away from the camera, the exact temperature of the local heat-up of the bulge or the maximal temperature of the crack tip could not be determined, only Samples 2 and 6 provided good measurements in this regard. However, the burst of the other samples revealed other interesting phenomena, like the evolution of the diameter of the sample in the last seconds before the burst and the maximal pressure before the burst at different tem- peratures and pressure increments.
Determination of the hoop stress on the samples is not trivial, because the ballooning reduces the wall thickness of the tubes. As the bulge formation is not uniform, wall thickness variation was not pre- dictable. Therefore, the hoop stress was calculated only at the beginning of the bulge formation – a few seconds before the burst – assuming circular cross section. The maximum circular diameter was measured where the bulge formation starts, based on the captured infrared images.
The wall thickness was calculated with the assumption of constant sample length and therefore constant cross section area. The local maximum hoop stress (σh) was calculated by the following formula (1) used for thin walled tubes:
σh=p⋅D
2⋅s (1)
Fig. 9.The maximum diameter of Sample 6 before the burst, based on the frames captured by the infrared camera, with the corresponding error bars.
Fig. 10.The approximation of the azimuthal position of the crack and the burst opening relative to the position of the IR camera.
Table 3
Sample average and maximum temperature during ballooning and burst. The azimuthal position of the crack relative to the IR camera is also indicated.
Sample No. 1 2 3 4 5 6
Measured T by
thermocouple (◦C) 800 800 795 860 827 853
Measured T by IR camera
(◦C) 805.2 808.1 801.2 865.0 828.2 855.5
Maximum T at burst (◦C) 810.9 836.4 813.6 876.0 832.2 881.0 Approx. crack position (◦) 90 80 230 110 180 60
where s is the calculated minimum wall thickness (mm), D is the inner diameter (mm) and p is the internal gas pressure (kPa) based on the measured data. The results of the approximated hoop stresses are shown in Table 4. As it can be seen, the hoop stress right before the burst was around 100 MPa at 800 ◦C and around 50 MPa at 850 ◦C. This difference corresponds well with the literature (Yegorova et al., 1999), as the UTS of Zr1%Nb material is around 29 MPa at 800 ◦C and 16 MPa at 850 ◦C.
5. Summary
The thermal phenomena surrounding the ballooning and cracking was investigated in a series of experiments performed using nuclear fuel cladding samples. The experiments were recorded using a high-speed infrared camera and the surface temperatures were measured. In the infrared range of 2–5.7 µm wavelength (MWIR) the direct emission coefficient of the non-oxidized zirconium cladding tube was found to be around ε =0.94, but this emission coefficient decreases slightly as the tube is oxidized.
We were able to measure the temperature changes on the surface of the samples. The local hot spot on the ballooned cladding surface, that was assumed from a previous series of tests, was successfully measured.
This local heat-up was not a reflection error due to the deformation of the sample, or the result of the change in the emission coefficient due to the formation of a thin oxide layer. The samples typically warmed up 10–15 ◦C at the position of bulge formation. The rate of temperature increase was also determined. According to the captured data, the crack tip warmed up to 30 ◦C above the rest of the sample at the time of the burst.
CRediT authorship contribution statement
Richard Nagy: ´ Conceptualization, Methodology, Formal analysis, Investigation, Writing - original draft, Visualization. Marton Kir´ ´aly:
Conceptualization, Methodology, Validation, Formal analysis, Investi- gation, Data curation, Writing - original draft, Writing - review & edit- ing, Visualization. P´eter Petrik: Methodology, Formal analysis. Zolt´an H´ozer: Conceptualization, Methodology, Resources, Supervision, Proj- ect administration, Funding acquisition.
Declaration of Competing Interest
The authors declare that they have no known competing financial interests or personal relationships that could have appeared to influence the work reported in this paper.
Acknowledgements
The research activities presented were supported by Paks NPP (contract number: 4000172048.EK-G-1175/2015) and the National Research, Development and Innovation Fund of Hungary (contract number: NVKP_16-1-2016-0014). P. Petrik is grateful for support from OTKA grant nr. K131515. There is no conflict of interest in the funding and the publication of this research.
References
The Fukushima Daiichi Accident. IAEA Non-serial Publications, STI/PUB/1710, 2015.
H´ozer, Z., Gy˝ori, C.S., Horv´ath, M., Nagy, I., Maroti, L., Matus, L., Windberg, P., ´ Frecska, J., 2005. Ballooning Experiments with VVER Cladding. Nuclear Technology 152 (3), 273–285.
H´ozer, Z., Perez-Fer´o, E., Novotny, T., Nagy, I., Horv´ath, M., Pint´er-Csord´as, A., Vimi, A., Kunst´ar, M., Kem´eny, T. Experimental Comparison of the Behavior of E110 and E110G Claddings at High Temperature. 17th International Symposium on Zirconium in the Nuclear Industry, ed. B. Comstock and P. Barberis (West Conshohocken, PA:
ASTM International) 2015, pp. 932-951.
Wiesenack, W., 2013. Summary of the Halden Reactor Project LOCA test series IFA-650, Proceedings of the Enlarged Halden Programme Group Meeting. Storefjell, Norway.
Yegorova, L., Lioutov, K., Jouravkova, N., Konobeev, A., Smirnov, V., Chesanov, V., Goryachev, A., 2005. Experimental Study of Embrittlement of Zr-1 %Nb VVER Cladding Under LOCA-Relevant Conditions. NUREG/IA-0211.
Erbacher, F.J., Leistikow, S., 1985. A review of Zircaloy fuel cladding behavior in a loss- of-coolant accident. Kernforschungszentrum Karlsruhe Germany, Report KfK-3973.
Erbacher, F., Neitzel, H., Rosinger, H., Schmidt, H., Wiehr, K. Burst Criterion of Zircaloy Fuel Claddings in a Loss-of-Coolant Accident. 5th International Symposium on Zirconium in the Nuclear Industry, ed. D. Franklin (West Conshohocken, PA: ASTM International) 1982, pp. 271-283.
Powers, D., Meyer, R., 1980. Cladding swelling and rupture models for LOCA analysis.
NUREG-0630.
Billone, M. Cladding embrittlement during postulated loss-of-coolant accidents. NUREG/
CR-696, July 2008.
Billone, M., Yan, Y., Burtseva, T., Daum, R., Scott, H., 2008. Cladding Embrittlement During Postulated Loss-of-Coolant Accidents. NUREG/CR-6967.
J. C. Brachet, M. Dumerval, V. Lezaud-Chaillioux, M. Le Saux, E. Rouesne, D. Hamon, S.
Urvoy, T. Guilbert, Q. Houmaire, C. Cobac, G. Nony, J. Rousselot, F. Lomello, F.
Schuster, H. Palancher, J. Bischoff, E. Pouillier: Behavior of Chromium Coated M5 Claddings Under LOCA Conditions. Proceedings of Water Reactor Fuel Performance Meeting, September 10-14 2017, Jeju Island, South Korea.
Wu, A., Ribis, J., Brachet, J.-C., Clouet, E., Leprˆetre, F., Bordas, E., Arnal, B., 2018.
HRTEM and chemical study of an ion-irradiated chromium/Zircaloy-4 interface.
Journal of Nuclear Materials 504, 289–299.
Shewfelt, R.S.W., 1988. The Ballooning of Fuel Cladding Tubes: Theory and Experiment.
Res. Mechanics 25, 261–294.
H´ozer, Z., Mar´oti, L., Windberg, P., Matus, L., Nagy, I., Gyenes, G., Horv´ath, M., Pint´er, A., Balasko, M., Czitrovszky, A., Jani, P., Nagy, A., Prokopiev, O., T´ ´oth, B., 2006. Behavior of VVER fuel rods tested under severe accident conditions in the CODEX facility. Nuclear Technology 154 (3), 302–317.
Stuckert, J., Große, M., R¨ossger, C., Klimenkov, M., Steinbrück, M., Walter, M., 2013.
QUENCH-LOCA program at KIT on secondary hydriding and results of the commissioning bundle test QUENCH-L0. Nuclear Engineering and Design 225, 185–201.
Suman, S., 2020. Influence of hydrogen concentration on burst parameters of Zircaloy-4 cladding tube under simulated loss-of-coolant accident. Nuclear Engineering and Technology 52 (9), 2047–2053.
Z. Hozer, I. Nagy, A. Vimi, M. Kunst´ ´ar, P. Szab´o, T. Novotny, E. Perez-Fer´o, Z. Kis, L.
Szentmikl´osi, M. Horv´ath, A. Pint´er Csord´as, E. Barsy, K. Kulacsy, M. Grosse: High- Temperature Secondary Hydriding experiments with E110 and E110G Claddings.
18th International Symposium on Zirconium in the Nuclear Industry, ed. R.
Comstock and A. Motta (West Conshohocken, PA: ASTM International), 2018, pp.
1093-1113.
Kozsda-Barsy, E., Kulacsy, K., H´ozer, Z., Horv´ath, M., Kis, Z., Maroti, B., Nagy, I., ´ Nagy, R., Novotny, T., Perez-Fer´o, E., Pint´er-Csord´as, A., Szentmiklosi, L., 2018. ´ Post-test examinations on Zr-1%Nb claddings after ballooning and burst, high- temperature oxidation and secondary hydriding. Journal of Nuclear Materials 508, 423–433.
J. Stuckert, M. Steinbrueck, M. Grosse: Experimental program QUENCH at KIT on core degradation during reflooding under LOCA conditions and in the early phase of a severe accident. Proceedings of a Technical Meeting on Modelling of Water Cooled Fuel Including Design Basis and Severe Accidents, 28 October - 1 November 2013, Chengdu, China.
R. Nagy, M. Kir´aly, T. Szepesi: Optical measurement of the high temperature ballooning of nuclear fuel claddings. Review of Scientific Instruments, Vol. 89, Issue 12 (2018) paper 125114.
P. Shebaldov, M. Peregud, A. Nikulina, Y. Bibilashvili, A. Lositski, N. Kuz’menko, V.
Belov, and A. Novoselov: E110 Alloy Cladding Tube Properties and Their Interrelation with Alloy Structure-Phase Condition and Impurity Content. 12th International Symposium on Zirconium in the Nuclear Industry, ed. G. Sabol and G.
Moan (West Conshohocken, PA: ASTM International) 2000, pp. 545-559.
V. Novikov, V. Markelov, A. Gusev, A. Malgin, A. Kabanov, Yu. Pimenov: Some Results on the Properties Investigations of Zirconium Alloys for WWER-1000 Fuel Cladding.
Proceedings of International conference on WWER fuel performance, modelling and experimental support, September 17-24, 2011, Helena Resort, Bulgaria.
Design and Performance of WWER Fuel, 1996. Technical Report Series, STI/DOC/010/
379. International Atomic Energy Agency, Vienna.
Nikulin, S.A., Rozhnov, A.B., Belov, V.A., Li, E.V., Glazkina, V.S., 2011. Influence of Chemical Composition of Zirconium Alloy E110 on Embrittlement Under LOCA Conditions - Part 1: Oxidation Kinetics and Macrocharacteristics of Structure and Fracture. Journal of Nuclear Materials 418 (1–3), 1–7.
Kir´aly, M., H´ozer, Z., Horv´ath, M., Novotny, T., Perez-Fer´o, E., V´er, N., 2019. Impact of thermal and chemical treatment on the mechanical properties of E110 and E110G cladding tubes. Nuclear Engineering and Technology 55 (2), 518–525.
Table 4
Calculated maximum hoop stress before the bulge formation.
Sample
No. Maximum
circular outer diameter (mm)
Calculated uniform wall thickness (mm)
Measured pressure before the bulge formation (kPa)
Calculated hoop stress (MPa)
1 15.2 0.38 6520 123
2 12.5 0.47 7940 98
3 13.1 0.45 7110 97
4 10.6 0.56 5540 47
5 12.9 0.45 3810 50
6 10.8 0.55 4610 40
R. Nagy, M. Kir´aly, T. Szepesi: Visual Observation of Ballooning and Burst Phenomena of VVER Fuel Claddings. Proceedings of Water Reactor Fuel Performance Meeting, September 10-14, 2017, Jeju Island, South Korea.
Nagy, R., Kir´aly, M., Szepesi, T., 2018. Optical observation of the ballooning and burst of E110 and E110G cladding tubes. Nuclear Engineering and Design 339, 194–201.
https://www.infratec.eu/thermography/thermographic-software/irbis3/.
L. Yegorova, V. Asmolov, G. Abyshov, V. Malofeev, A. Avvakumov, E. Kaplar, K. Lioutov, A. Shestopalov, A. Bortash, L. Maiorov, K. Mikitiouk, V. Polvanov, V. Smirnov, A.
Goryachev, V. Prokhorov, V. Pakhnitz, A. Vurim: Data Base on the Behavior of High Burnup Fuel Rods with Zr-1%Nb Cladding and UO2 Fuel (VVER Type) under Reactivity Accident Conditions: Description of Test Procedures and Analytical Methods. NUREG/IA-0156, Volume 2, IPSN 99/08-2, NSI RRC KI-2179 (1999).