Post-test examinations on Zr-1%Nb claddings after ballooning and burst, high-temperature oxidation and secondary hydriding
Eszter Kozsda-Barsy, Katalin Kulacsy, Zoltán Hózer, Márta Horváth, Zoltán Kis, Boglárka Maróti, Imre Nagy, Richárd Nagy, Tamás Novotny, Erzsébet Perez-Feró, Anna Pintér-Csordás, László Szentmiklósi Centre for Energy Research, Hungarian Academy of Sciences (MTA EK), H-1525 Budapest, P.O. Box 49.
ABSTRACT
The objective of the present study was to provide further data on E110G cladding behaviour. The results presented here are from new post-test examinations (PTEs) carried out on samples of secondary hydriding experiments conducted earlier in MTA EK.
The as-received Zr-1%Nb cladding samples were pressurised at high temperature to balloon and burst and then oxidised in steam atmosphere. The post-test investigation was focusing on geometric change in the cladding, ductility, oxidation and hydrogen absorption.
Outer and inner oxide layers were formed on the samples, with increasing thickness near the thermal centre. The results include radial and axial distribution of oxygen in the cladding after oxidation. The hydrogen uptake of the alloy shows the expected characteristic axial distribution. Mechanical testing of the oxidised and non-oxidised samples confirmed the results of the previous mechanical tests that after ballooning the samples still had notable flexural strength, whereas after oxidation this
decreased.
The results were evaluated against those obtained through simulations, making it possible to estimate the level of oxidation, and to develop better models through further simulation.
1. INTRODUCTION
The safety of nuclear power plants requires not only normal operational testing, but also
experimental and analytical studies on accident, especially LOCA (loss-of-coolant accident) scenarios.
During LOCA (in pressurised water reactors - PWRs) the pressure drops because of the leakage in the coolant pressure boundaries thus making steam formation and increase in temperature possible.
These circumstances lead to the high-temperature steam oxidation of the cladding. Moreover, when the difference between the rod inner pressure and the reactor cooling system pressure becomes high enough the cladding may balloon and burst. Then the inner surface also reacts with the steam, resulting in secondary (inner surface) oxidation and hydriding. The importance of better
understanding this process lies in anticipating the changes of the mechanical properties of the cladding. Studies have shown that during LOCA with increasing oxidation and hydrogen uptake zirconium alloys become more brittle [1,2,3,4].
In order to predict fuel behaviour under accident conditions in a nuclear reactor, detailed numerical models are needed. The development and validation of fuel behaviour models and computer codes must be supported by experimental data. The numerical simulation of such complex phenomena as cladding ballooning, oxidation, hydrogen absorption and embrittlement may call for special
examination of samples produced in representative experiments.
The secondary hydriding phenomenon was first observed in the experimental series performed by Japanese scientists with Zircaloy-4 cladding [2]. In their tests the pressurised fuel rod specimens were placed in the centre of an infrared furnace and heated in steam flow. The fast heat-up rate (15-
20 °C/s) lead to cladding rupture between 850 °C and 950 °C. After the burst, the steam partially oxidised the cladding inner surface through the opening. The ruptured and oxidised cladding
specimens were then cut into segments, which were subjected to compression tests using a universal testing machine. The embrittlement was found to be influenced primarily by the amount of hydrogen absorbed in the Zircaloy. Peaks have formed in the distribution of the hydrogen absorbed on the inner surface, at a distance of 15-45 mm both sides of the rupture opening in the axial direction.
Numerous LOCA tests were conducted at the Argonne National Laboratory (ANL), Japan Atomic Energy Research Institute (JAERI) and Halden Reactor Project (HRP) with irradiated fuel samples [15,16,23]. High hydrogen absorption in the vicinity of ballooned regions was observed in these experiments. The mechanical load bearing capabilities of ballooned and oxidised samples was tested with four-point bending tests.
The Studsvik LOCA test program included the examination of high-burnup fuel under high- temperature accident conditions [16,17]. The experiments were focused on pellet fragmentation phenomena, but the formation of a hydrogen-rich region typical for secondary hydriding was also identified.
The QUENCH facility at KIT is used for the examination of fuel bundle behaviour under accident conditions [18,19]. The QUENCH LOCA test series included several experiments with electrically heated bundles, where the secondary hydriding phenomenon could be identified. The post-test examination of the fuel samples included the application of neutron radiography, which showed the formation of hydrogen enriched bands at the boundary of the cladding area that suffered inner oxidisation.
M5 cladding samples were tested in France with two-step thermal-mechanical transients, which consisted of temperature ramp tests under internal pressure up to ballooning and burst and subsequent oxidation in flowing steam at 1100-1200 °C [6]. Very detailed post-test examinations with advanced techniques were applied in order to get more fundamental insights into the microchemical changes associated with secondary hydriding.
The high temperature secondary hydriding of nuclear fuel claddings consists of several chemical, mechanical, heat and mass transfer phenomena. The ballooning creates a special geometrical arrangement in the fuel rod. The thinning of the cladding wall significantly reduces the mechanical load bearing capabilities of the tube. At high burnup the fuel pellet can fragment as it was observed in several experiments [14,17]. The temperature increase can significantly enhance fission gas release from the pellet. At the time of the burst the internal overpressure is instantaneously relieved by the release of helium and fission gases from the fuel and the pressure in the rod remains equal to the system pressure in the reactor. Gas flow out of the breach continues because of thermal
expansion and fission gas release. The gas outflow may essentially suppress the internal oxidation, and this partially explains the rather limited area of internal oxidation around the breach [20].
The above listed experiments were performed with Western type claddings, but there were no secondary hydriding tests with VVER type claddings. In order to support the safe operation of VVER reactors in Hungary, the secondary hydriding phenomenon was investigated in a recent experimental series with E110 type claddings, which is a zirconium alloy used in VVER reactors. The E110 has different variants, but the basis is zirconium with a 1% niobium content. Niobium is known to reduce oxidation and hydrogen absorption in zirconium [3,4]. The high-temperature behaviour of two varieties of cladding under LOCA conditions was tested at the Hungarian Academy of Sciences Centre for Energy Research (MTA EK) [7]. The E110 alloy is in use today at Paks NPP, while E110G
(sometimes referred to as sponge-based E110 Opt) is a new development. The fabrication process of
E110G differs from that of the E110 alloy: instead of the electrolytic refinement it is fabricated from sponge zirconium, which also leads to a lower level of hafnium and halogens. It was shown that E110G is more resistant to LOCA conditions in terms of hydrogen absorption, oxidation and embrittlement than E110 [1,3,8].
The present study covers post-test examinations performed following earlier secondary hydriding tests in MTA EK [7], providing further data on E110G behaviour. The objectives of this study are extending the secondary hydriding test results with data on VVER type cladding behaviour and comparing the E110G alloy to its predecessor E110. In addition, numerical simulations were also carried out to evaluate the measured results. These data will be used for model development in the future.
2. MATERIALS AND METHODS 2.1 Materials and setup
Two types of as-received Zr-1%Nb cladding samples were used, provided by the Russian fuel supplier:
E110 and E110G. The composition of these materials is presented in Table 1. The measurements were made by spark ionisation source mass spectrometer (type MS-702R).
Table 1. Material composition of the Zr-1%Nb samples (in weight ppm)
Nb Mg Al Si Cr Mn Fe Ni Cu Hf
E110G 10000 1.5 10 35 30 5 500 15 5 10 E110 10000 0.5 0.5 1 10 0.1 45 15 0.5 100
The samples used in the secondary hydriding tests were 300 mm long with an inner diameter of 7.73 mm and outer diameter of 9.1 mm. They were filled with inert Al2O3 pellets. The experimental setup included means to control the temperature and inner pressure of the rod. It provided sufficient steam flow for the oxidation to occur, and argon flow to carry the steam or to slowly cool down the samples. Quenching with water was also possible. The experimental facility consisted therefore of two loops. In the first loop high purity argon gas was used, controlled by a stepper motor through a needle valve, and connected to the inner volume of the sample situated in the resistance-type tube furnace. The second loop was for the oxidation of the rod and the quenching. Its components were a steam generator, another high purity argon tank, a precision pump and a thermal conductivity detector (TCD). The schematics of the setup is presented in Figure 1.
Figure 1. Schematics of the experimental loops (the dotted lines represent data transfer while the
solid lines represent material transfer)
Argon atmosphere was used during the entire time of each experiment first as a protective gas (in order to avoid oxidation during the ballooning and burst phase), then as a carrier gas for the steam and finally as cooling atmosphere (except when water quenching was applied). Argon and steam were introduced into the vertical furnace from the bottom.
The samples were subjected to a specific pressure increase rate by injecting argon into them through pipes connected to their top ends. An argon gas cylinder was connected to the stepper motor- controlled needle valve. The high purity argon gas was injected through a buffer tank in order to keep the volume flow steady. The inner pressure of the cladding tube was measured by an industrial pressure transducer. The stepper motor had the ability to control the gas pressure during the
ballooning with the feedback from the transducer. An analogue manometer was also attached to the buffer tank, so the pressure could be monitored safely.
In the furnace was a retort containing the cladding tube. There was also a spacer, which positioned the sample in the middle of the furnace. A thermocouple was in the 10 mm gap between the sample and the wall of the furnace, at the thermal centre of the furnace. Welding the thermocouple onto the sample surface would have altered the ballooning results. The required temperature was regulated with the feedback of this thermocouple. The nominal heating power of the furnace was 2.5 kW, which could provide a maximum of 1300 °C.
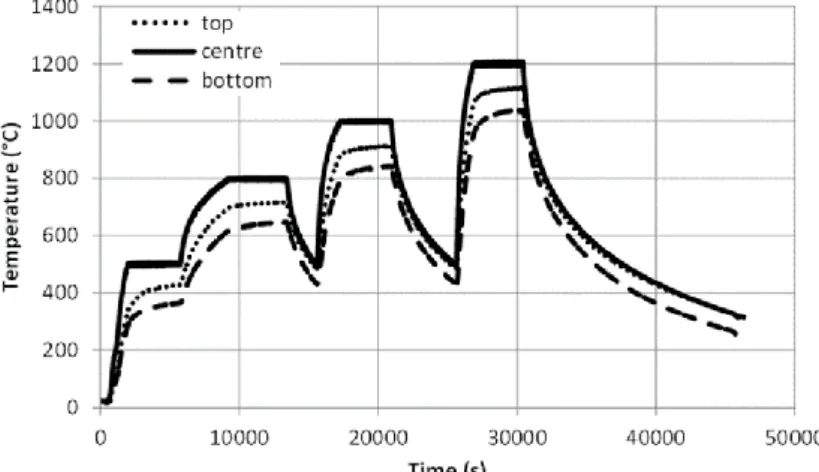
The time evolution of the axial temperature profile (Figure 2) after reaching any of the constant temperatures relevant to the experiments was measured and could be approximated as
𝑇 = [𝐴𝑠− 𝑝𝑒−𝑞𝑡]𝑥2+ 𝑇𝑠 (1)
where
T is the calculated temperature (°C) at a given time (t) and axial position (x),
t is the time elapsed since the central thermocouple reached the target temperature (s), x is the distance from the thermal centre (mm),
Ts is the measured centre temperature (°C) and
𝐴𝑠= −3 ∙ 10−7𝑇 − 8.95 ∙ 10−3 𝑝 = 8.6 ∙ 10−6𝑇 − 5.32 ∙ 10−3 𝑞 = 6.25 ∙ 10−7𝑇 − 7.03 ∙ 10−5
Figure 2. Time-dependent temperature measurement in the furnace at three positions along the sample
As part of the arrangement, a data acquisition unit was installed, which had the role of recording the evolution of temperature and pressure. The analogue signals from the thermocouple and the pressure transducer were converted into digital signals and logged.
The second argon gas cylinder was connected through its pressure regulator and a manually set valve to the steam generator, which produced the necessary steam for the oxidation. The steam generator consisted of a stainless-steel tank and a cylindrical, electrically heated block. A pump provided the specified amount of water through a capillary tube, which dripped onto the heated block and evaporated almost instantly. The pump used water from the tank.
The steam and argon gas were mixed in a stainless-steel pipe before introducing into the furnace. In this loop the argon was used as a carrier gas for the steam. The flow rate could be set with a pump.
The gas-steam mixture (which flowed upwards in the furnace at a constant rate) could get in direct contact with the cladding tube. The tubes going into and coming from the furnace were additionally heated to prevent condensation (which would have interfered with the TCD signal). Also, the inlet of the furnace was equipped with a safety valve.
Leaving the furnace, the argon-steam-hydrogen mixture reached the TCD, with which the argon-to- hydrogen ratio was determined (zirconium got oxidised releasing hydrogen). After condensing the steam out of the mixture, the detector measured the thermal conductivity (thermal conductivity of argon is 17.72 mW/m K, while for hydrogen it is 181.5 mW/m K) and the composition of the gas mixture, i.e. the hydrogen content could be determined. The TCD used a twin-cell gas
chromatography technique, which means there was a measuring and a reference section. The reference flow contained only the carrier gas, and the other flow was a mixture of the carrier and sample gases. The detector compared the thermal conductivities by electrical resistance sensors in a Wheatstone-bridge. The hydrogen signal was recorded in an analogue and a digital way, the other parameters were recorded only digitally.
2.2 Post-test examinations (PTEs)
Four-point bending technique was used to test the flexural strength of the samples. The testing system was an INSTRON universal testing machine installed with a four-point bend test fixture. The sample was placed on two support anvils 200 mm apart, and the crosshead applied a force on the specimen from above at two positions, 130 mm apart. The loading rate was 1 mm/min. Upon failure, the force and the deflection were recorded. Both oxidised and reference (ballooned-only) samples were tested in order to make comparisons.
Eight segments of each ballooned sample were prepared for metallography. One side (cross section) of the 15 mm long sample segments was polished. The polishing consisted of a mechanical and a chemical step, the latter was performed with 0.5% HF. With the use of a Reichert Me-F2 optical microscope the grain structure was examined at two different resolutions.
The hydrogen to zirconium ratio was measured by prompt gamma activation analysis (PGAA). The visualisation of the neutron beam was done by means of a scintillation screen and the digitalisation was done by a sensitive camera equipped with a CCD chip (Andor iKon-M 934 1024×1024 pixels, 16- bit greyscale). The achieved spatial resolution was 500 μm. The gamma detector was a lead-
protected, 23% efficiency, n-type, coaxial, Compton Suppression HPGe (Canberra GR 2318/S) Spectrometer, with a FWHM (full width at half maximum) of 2.2 keV at 1332 keV. The advantage of this technique is the high sensitivity for light elements, in this study hydrogen, because of the favourable difference between the neutron cross sections of the H and Zr (H: 0.3326 b; Zr: 0.185 b).
The variation in the atomic ratio of these two elements was therefore measured axially. The durations of the examinations were 18000 and 21300 s. Hydrogen was also measured by hot extraction for comparison [7], and the results were in good agreement, therefore PGAA was used further on.
Several cladding tubes were prepared for scanning electron microscopy (SEM). The preparation consisted of resin casting, fine polishing and etching. Carbon coating was applied to the surfaces of the samples to make them electrically conductive. The device for the SEM examinations was a JEOL JSM-5600 LV microscope, operating at a 25 kV accelerating voltage, in secondary electron image (SEI) and backscattered electron image (BEI) modes. The SEM was coupled with an energy-dispersive X-ray spectroscope (EDX). The atomic composition of the samples was examined by an Iridium X-ray Fluorescence (IXRF) EDX and its Iridium Ultra Software. These investigations were conducted in steps of 10 µm, starting at the outer oxide layer.
3. EXPERIMENTAL PROCEDURES
The main purpose of the experiments was to simulate LOCA (loss-of-coolant accident) conditions in order to understand the behaviour of the cladding during such events. Furthermore, it had to meet the following criteria: possible comparison between E110 and E110G samples (similar
circumstances), large crack after burst, oxidation for different durations (to analyse time
dependence), and possible comparison to results of similar tests performed in other laboratories.
The experiments were not aimed at being completely representative of real LOCA conditions but were focused on the investigation of selected phenomena under well-defined conditions. The rather complex temperature and pressure histories were represented in a simplified way applying linear pressurisation rate and isothermal burst and oxidation conditions. Furthermore, the burst phase was carried out in inert atmosphere and oxidation started only after rod bursting and pressure
equilibration. The two step experiments (similarly to the CEA tests [6]) were selected for the following reasons:
The prevention of oxidation in the ballooning and burst phase results in larger deformation and opening [22]. The rods were intended to have a large opening in order to enhance the
penetration of steam into the inner volume of the sample in the oxidation phase.
The experimental data supports the numerical modelling. The separation of oxidation and burst phenomena allows the code developers to improve their models individually for the burst and for the oxidation process without interference.
The burst of E110 claddings in oxidizing atmosphere with typical transient conditions was investigated in another tests series with electrically heated fuel rod bundles in the CODEX (Core Degradation EXperiment) facility [21]. The post-test examination of the CODEX-LOCA bundles provided additional data on the mechanical properties, oxygen and hydrogen distribution in the cladding tubes and will be compared to the secondary hydriding results.
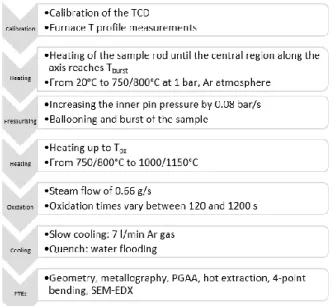
The steps of the test procedure are summarised in Figure 3, the on-line measured parameters are in Table 2.
Figure 3. Flow-chart diagram of the experiment Table 2. Parameters measured on-line
Parameter Instrument Position
Temperature thermocouple close to the sample, at the thermal centre*
Pressure manometer end of the sample and in buffer tank
Flow rate bubble flow meter after the TCD
Hydrogen concentration TCD TCD
*The thermocouples were not on the samples, but the measured temperature is in parallel with the surface temperature of the samples.
The tests started at room temperature (20 °C), the sample was inserted into the furnace and fastened in the thermal centre (both axially and radially). Then the argon flow was started around the sample and kept at a rate of 0.12 l/min. The furnace heating was turned on and kept on for approx. 20 minutes, until the thermal centre of the furnace as measured by the thermocouple reached the desired ballooning temperature (750-800 °C). After a short equilibration time (while the temperature at the middle of the sample reached a steady state) the pressurisation by argon started
at a rate of 8 kPa/s. The gas was supplied until the burst happened, typically between 4.5-5.5 MPa, then the pressurisation was stopped.
As the next step, the furnace was heated to the temperature of the oxidation. After the furnace reached the desired temperature, and after some transition time, the TCD was connected to the system and the steam generator was switched on, providing a 0.66 g/min steam supply in the 0.12 l/min argon flow. The oxidation was performed for a specific duration, between 120 and 1200 seconds. During the oxidation of the cladding the temperature rose due to the exothermic reaction, but it was not significant (4-7 °C) because the steam and argon flow transported most of the excess heat. After reaching the end of the oxidation time, the steam supply and the heating were turned off, but the TCD still kept going in order to detect the stagnant hydrogen still leaving the furnace. At the same time, the argon flow rate was increased, reaching a value of 7 l/min. The duration of the cooling phase was approx. 4-5 hours in inert atmosphere. For the quench tests the cooling phase was much shorter because the furnace was flooded with cold water. Afterwards the samples were photographed, categorised and sent for post-test examinations.
First, the non-destructive PGAA was carried out on two of the cladding tubes. All the tubes were submitted to the mechanical tests. After the mechanical tests, sample preparation was needed for the other examinations. First, the sample pieces (the ones that were broken during the four-point bending) were placed back into their original positions and cast with a two-component resin. Then long sections (15 mm) for microscopic analysis (metallography) and thin sections (3 mm) for hydrogen content (hot extraction) measurements were cut. In case of hot extraction, the resin was removed before testing. For two samples (GSH12, GSH22) a different cutting plan was made because of the different PTEs to be carried out: all the pieces were cut to the same length (10 mm) and then polished the same way as the other samples. The zero position represented the centre of the burst.
The cutting positions were chosen according to the PGAA results on the hydrogen distribution.
4. RESULTS
4.1
Ballooning and burstThe secondary hydriding experimental programme conducted at MTA EK included eleven successful tests [7]. Some of the samples were broken during the oxidation phase or during handling of the cladding tubes after the tests. For this reason, only eight samples were available for further
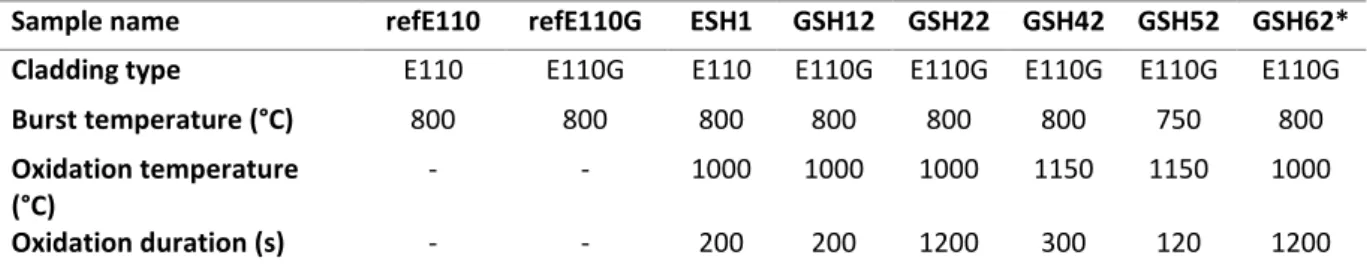
examinations. Table 3 summarises the post-test examinations performed on each sample. The target ECR (equivalent cladding reacted) values indicated here have been calculated using an average ballooned diameter of 20 mm along with the relevant best-estimate oxidation kinetic correlations (see chapter 5.1) at the thermal centre. The ECR results are therefore more realistic for the tested alloys than those calculated using either the Cathcart-Pawel or the Baker-Just correlations. Due to the position of the thermocouple there was a ±5 °C uncertainty in the temperature, and that resulted in a ±4% uncertainty of the ECR.
Table 3. Test matrix of the examined samples (the reference rods were not oxidised)
Sample name refE110 refE110G ESH1 GSH12 GSH22 GSH42 GSH52 GSH62*
Cladding type E110 E110G E110 E110G E110G E110G E110G E110G
Burst temperature (°C) 800 800 800 800 800 800 750 800
Oxidation temperature (°C)
- - 1000 1000 1000 1150 1150 1000
Oxidation duration (s) - - 200 200 1200 300 120 1200
Target ECR (%) - - 7.8 6.8 14.7 26.4 16.7 14.7
PTEs
Four-point bending x x x x x x x
Metallography x x x x x x
PGAA x x x
Hot extraction x
SEM - EDX x x x x
Geometry x x x x x x x x
*quenched sample
Burst time (time counted from the beginning of pressurisation until the burst) and the burst pressure indicate the mechanical properties of the cladding. Both quantities depend on the state of the cladding (fresh or oxidised), on temperature and on the pressurisation rate. In most cases the burst of E110 samples happened at higher pressures, for example, at 800 °C the E110 samples burst around 5.0 MPa, the E110G samples around 4.8 MPa. At lower temperature (750 °C) the burst happened later, and the claddings endured almost fifty percent higher inner pressure [7].
The samples ballooned to more than twice their original diameter (9.10 mm) at the location of burst (Figure 4). Lower temperature means higher burst pressure, as it was expected. The ballooned diameter of the samples was quite similar, partly because of the similar conditions (pressurisation rate, temperature) and partly due to the similar mechanical properties of the E110 and E110G alloys.
The length of burst openings was also similar, about 21 mm.
Figure 4. Geometry of rods after burst at 800 °C 4.2 Oxidation and secondary hydriding
The ballooned section (where the wall thickness was considerably less) oxidised more quickly and was therefore more brittle compared to the non-ballooned sections of the tubes. Another
observation was that the inner surface oxidation is localised within an 80-100 mm distance from the centre of burst opening. The E110G cladding tended to form a compact oxide layer (no oxide spallation occurred) (Figure 5).
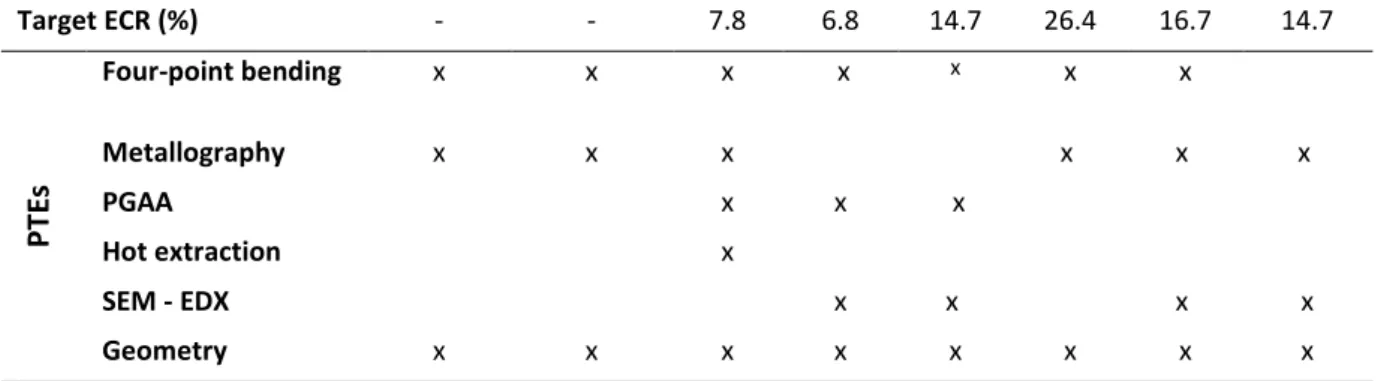
Figure 5. Inner and outer oxide layers of cladding tube GSH42 at axial position -18.3 mm The thickness of the oxide layer varies from point to point, therefore several points were selected at each axial position along the circumference. The results were multiple values for each cutting position. There is a significant difference between the inner and outer oxide layers in terms of the axial profile. Whilst the outer layer covers the whole rod in most cases, the inner oxide layer formed only in the vicinity of the burst opening (Figure 6).
Figure 6. Inner (A) and outer (B) oxide layers of cladding tube GSH42
The results of the four-point bending tests (Table 4) indicate that the high-temperature oxidation causes the claddings to become brittle, even after short oxidation times [7].
Table 4. Results for the four-point bending tests Sample Max. force
(N)
Crosshead displacement (mm)
Failure type
ESH1 691 2.20 Brittle
GSH12 640 1.81 Brittle
GSH22 223 0.61 Brittle
GSH42 51 0.23 Brittle
GSH52 46 0.15 Brittle
refE110 890 8.56 Ductile
refE110G 1074 9.09 Ductile
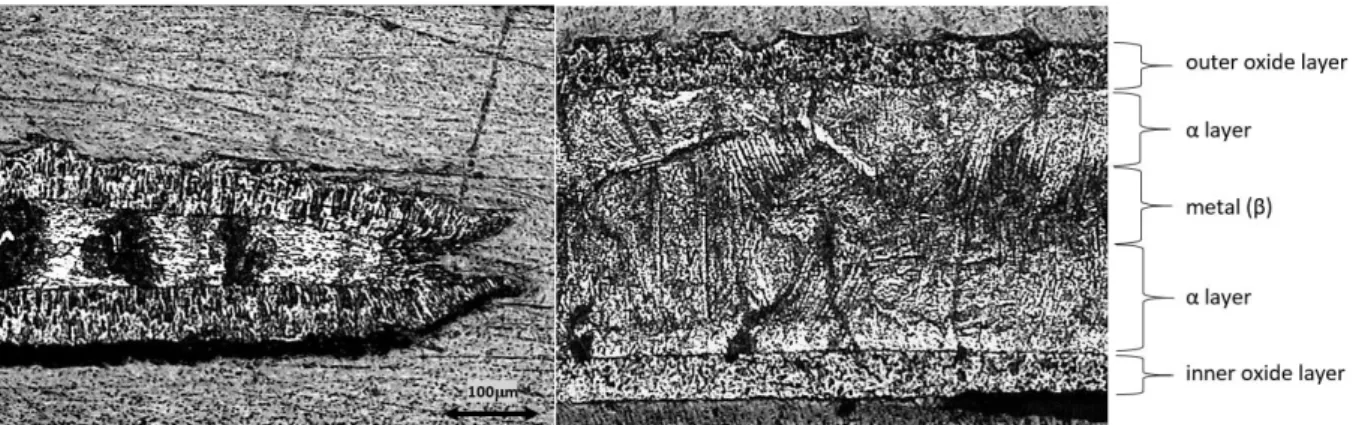
The results obtained from EDX measurements indicate a non-uniform radial and axial distribution of the oxygen in the cladding after oxidation. The radial distribution (Figure 7) shows a high oxygen content in the oxide layer. After the oxide-metal interface (O/M) the mass ratio drops rapidly, and then slightly increases again in the metal. The labelled points of measurement are marked in the BEI image (Figure 8). Figure 9 shows the axial distribution of the oxygen content (radially averaged).
Figure 7. Radial distribution of oxygen in sample GSH52 (at axial position -18.3 mm)
Figure 8. BEI image and points of SEM-EDX measurements in sample GSH52 (at axial position - 18.3 mm) The numbers increase from the oxide layer (1,2) towards the metal (3-7)
Figure 9. Oxygen content at different axial positions in different layers of the sample GSH22 (note that the column width does not represent the layer width)
Both PGAA and hot vacuum extraction indicated that the axial distribution of the absorbed hydrogen was not uniform. The highest hydrogen content (in weight percentage) is not in the burst region but a few centimetres further (Figure 10). This corresponds to other experimental results on different claddings (e.g. Zircaloy-4 [2]). As mentioned before, the results of the two types of hydrogen content measurements were in very good agreement for E110 [7], therefore only PGAA was used for the E110G samples. An integrated estimate of the absorbed hydrogen for the 100 mm long middle section of the rod (density of the cladding tube is 0.119 g/mm) is 70.5 cm3.
Figure 10. Axial distribution of hydrogen and oxygen in sample GSH22 (in weight percent) 5. DISCUSSION
5.1 Cladding oxidation
As part of the cross-checking process, a standalone Fortran code was written to calculate the oxidation of the E110G cladding and to estimate the amount of hydrogen generated. These values were then compared to the measurements. The schematics of the calculations is in Table 5.
Table 5. Steps of calculation Step Input
parameter
Calculation Output parameter Measurement Approximations
1 T, E110G oxidation kinetics in
Fortran
oxide layer thickness, + uniform T,
t, bound oxygen mass - one-sided oxidation,
alloy compact oxide layer
2 bound oxygen mass, geometry
zirconium oxidation
generated hydrogen + no absorbed
hydrogen
New kinetic correlations have recently been established at MTA EK for the oxidation of the E110G alloy [10], these were used for the first part of the calculations (Equation 2, Table 6). For E110, previously established equations were used [9].
w(t,T)=k(T)∙tα(T) (2)
where w is the oxide layer thickness (m) or mass increase per unit surface area (g/cm2), t is the oxidation time (s), T is the temperature (K).
Table 6. Fitted parameters of the oxidation kinetics of E110G in Equation 2 [10]
Model Range w
dimension
k α
E110G
t ≤ 500 s or 1335 K –
1473 K
m g/cm2
5.276 ∙ 10−11𝑒(7.6783∙10−3∙𝑇)
8.678 ∙ 10−9𝑒(7.6783∙10−3∙𝑇) 0.5 t > 500 s and
873 K – 1276 K
m g/cm2
8.038 ∙ 10−12𝑒(1.0044∗10−2∙𝑇)
1.322 ∙ 10−9𝑒(1.0044∗10−2∙𝑇) 0.7776 − 3.573 ∙ 10−4∙ 𝑇 t > 500 s and
1276 K – 1335 K
m g/cm2
9.407 ∙ 𝑒(−1.1735∙10−2∙𝑇)
1547 ∙ 𝑒(−1.1735∙10−2∙𝑇) −3.561 + 3.042 ∙ 10−3∙ 𝑇
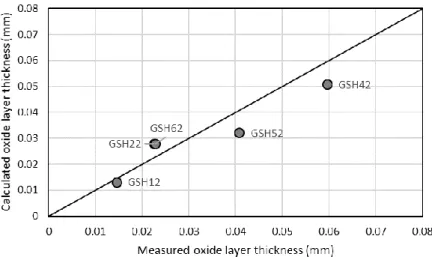
The mass gain due to oxidation was calculated. The outer oxide layer thickness (Figure 11) was calculated to evaluate the corresponding experimental results. The correlation was R2=0.8908 with an average difference of 5.8 µm.
Figure 11. Experimental results compared to the simulations (outer oxide layer thickness) During the oxidation of zirconium in steam, hydrogen forms according to the equation:
Zr + 2H2O = ZrO2 + 2H2 (3)
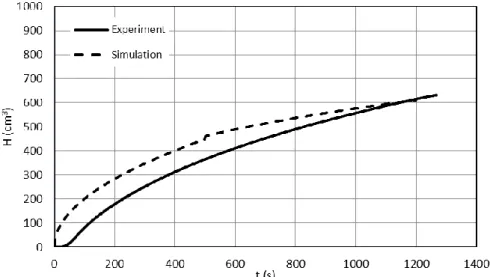
Some amount of hydrogen is absorbed by the metal, while most of it is released and detected by the TCD; the sum of the released and the absorbed hydrogen equals in principle to the generated quantity.
The on-line hydrogen release measurements with the TCD produced voltage graphs with a typical sampling rate of 0.5 s. The voltage values could be converted into volume, the hydrogen release of the samples could therefore be monitored – theoretically. In practice, the inner geometry of the furnace affected the results – some hydrogen could not be flushed out right away, there was a build-up. As a result, there was a difference between the time distribution of the released and the detected hydrogen.
As the hydrogen measurements continued after the end of oxidation, all the hydrogen could be detected, and the final, cumulative values were therefore relevant.
As only the conceivable limits of hydrogen release were of interest, the calculations were made applying the following assumptions: the temperature of the sample is uniform, the entire surface is oxidised, no hydrogen is absorbed by the cladding. As a result, the calculated generated hydrogen and the measured released hydrogen could be compared, giving an estimate for absorbed hydrogen seen on Figure 12. The solid curve shows the measured data (the TCD signal converted to hydrogen volume), represented for the whole duration of the measurement, which was usually longer than the actual oxidation time. The dashed curve shows the calculated values, considering a nominal temperature, but neglecting secondary oxidation together with secondary hydriding. The difference between the two curves is the absorbed hydrogen, with an average value of 65.6 cm3. It is comparable with the result in Section 4.2.
Figure 12. Sample for time evolution of hydrogen release (GSH62) 5.2 Embrittlement
According to the bending tests [7], the weakest part of the rod is the ballooned section because the cladding is thinner and more oxidised. On this section even a small force leads to fracture, contrary to the non-ballooned section. Testing of the oxidised and non-oxidised (reference) samples confirmed the results of the previous mechanical tests that after the ballooning the samples still had notable flexural strength, whereas it decreased after oxidation (Table 4).
The main results of the mechanical tests are as follows:
- Each sample showed signs of embrittlement, but the less oxidised samples tended to break under higher loads.
- The non-oxidised reference samples were ductile.
5.3 Hydrogen absorption and oxide layer
A typical axial distribution of hydrogen and the oxide layer thickness were determined after the experiments, the oxide layer thickness was maximum in the centre, and the hydrogen content had two peaks near the rupture.
The oxidation of the cladding samples was most intense in the middle part of the furnace at the thermal maximum (Figure 10). The more intense the oxidation, the more hydrogen is produced which can then migrate into the metal at locations with thinner oxide layers. (As mentioned before, the oxide layer inhibits hydrogen absorption.)
As seen in Figure 10 there is a significant difference between the inner and the outer oxide layer thickness in terms of axial profile. Whilst the outer oxide layer covers the whole rod in most cases, the inner oxide layer covers only the vicinity of the burst due to the flow characteristics [12] of the gas in and around the sample. While the atmosphere around the samples contained mostly steam, inside the gap the partial pressure of hydrogen was higher due to the inner surface oxidation [13]. The barely oxidised inner surface around the rupture is the location of the highest hydrogen absorption, causing two maxima in the axial hydrogen distribution, on both sides of the rupture [2].
6. CONCLUSIONS
Post-test examinations were carried out to obtain data regarding the effects of oxidation and secondary hydriding on VVER claddings. The examinations covered the characterisation of geometry after the ballooning and burst, ductility, oxidation and hydrogen absorption. Oxide layer formed on
the samples, with increasing thickness near the thermal centre. Due to burst the inner surface was oxidised as well. However due to the geometry and flow characteristics the inner oxide was not formed along the entire length of the cladding. The hydrogen produced from steam could penetrate the metal at positions where there was less oxide on the inner surface near the burst section, this caused the measured double-peak in the axial hydrogen distribution. Oxidation and hydrogen uptake then caused embrittlement of the cladding, weakening it near the rupture.
The results were evaluated by simulations, making it possible to estimate expected values of oxidation.
The measured data will be published in the next issue of the ‘Experimental database of E110 cladding exposed to accident conditions’ included in the International Fuel Performance Experiments (IFPE) database of the OECD NEA [11], and it can be used for validation purposes and model development.
ACKNOWLEDGMENTS
The secondary hydriding tests were supported by the Paks Nuclear Power Plant, Hungary.
The present work was supported by the National Research, Development and Innovation Fund of Hungary (contract number: NVKP_16-1-2016-0014).
REFERENCES
[1] S. A. Nikulin, V. G. Khanzhin, A. B. Rozhnov, V. A. Belov, E. V. Li, Crack resistance of zirconium cladding pipes after high-temperature oxidation, Met. Sci. Heat Treat. 55 (2013) 1-2. (English translation) https://doi.org/10.1007/s11041-013-9589-5
[2] H. Uetsuka, T. Furuta, S. Kawasaki, Zircaloy-4 cladding embrittlement due to inner surface oxidation under simulated loss-of-coolant condition, J. Nucl. Sci. and Tech. 18:9 (1981) 705-717.
DOI: 10.1080/18811248.1981.9733309
[3] L. Yegorova, K. Lioutov, N. Jouravkova, A. Konobeev, V. Smirnov, V. Chesanov, A. Goryachev, Experimental study of embrittlement of Zr-1%Nb VVER cladding under LOCA-relevant conditions, NUREG/IA-0211, (2005)
[4] A. Couet, A. T. Motta, R. J. Comstock, Hydrogen pickup measurements in zirconium alloys:
Relation to oxidation kinetics, J. Nucl. Mater. 451 (2014) 1-13.
https://doi.org/10.1016/j.jnucmat.2014.03.001
[5] S. Suman, M.K. Khan, M. Pathak, R.N. Singh, J.K. ChakravarttyHydrogen in Zircaloy: Mechanism and its impacts, Int. J. Hydrogen Energy., 40 (2015) 5976-5994
https://doi.org/10.1016/j.ijhydene.2015.03.049
[6] J-C. Brachet, D. Hamon, M. Le Saux, V. Vandenberghe, C. Toffolon-Masclet, E. Rouesne, S. Urvoy, J-L. Béchade, C. Raepsaet, J-L. Lacour, G. Bayon, F. Ott: Study of secondary hydriding at high temperature in zirconium based nuclear fuel cladding tubes by coupling information from neutron radiography/tomography, electron probe micro analysis, micro elastic recoil detection analysis and laser induced breakdown spectroscopy microprobe, J. Nucl. Mat. 488 (2017) 267- 286. https://doi.org/10.1016/j.jnucmat.2017.03.009
[7] Z. Hózer, I. Nagy, A. Vimi, M. Kunstár, P. Szabó, T. Novotny, E. Perez-Feró, Z. Kis, L. Szentmiklósi, M. Horváth, A. Pintér Csordás, E. Barsy, K. Kulacsy, M. Grosse: High-Temperature Secondary Hydriding Experiments with E110 and E110G Cladding, Zirconium in the Nuclear Industry: 18th International Symposium, ASTM STP1597, R. J. Comstock and A. T. Motta, Eds., ASTM
International, West Conshohocken, PA, 2018, pp. 1093–1113, http://dx.doi.org/10.1520/STP159720160031
[8] S. A. Nikulin, A. B. Rozhnov, V. A. Belov, E. V. Li, V. S. Glazkina, Influence of chemical composition of zirconium alloy E110 on embrittlement under LOCA conditions – Part 1: Oxidation kinetics
and macrocharacteristics, J. Nucl. Mater. 418 (2011) 1-7.
https://doi.org/10.1016/j.jnucmat.2011.07.017
[9] Cs. Győri, P. Van Uffelen, A. Schubert, J. van de Laar, G. Spykman, Z. Hózer, "An Update of the Nuclear Fuel Behaviour Simulation under LOCA Conditions with the TRANSURANUS Code", KTG Technical Expert Meeting on "Status of LWR Fuel Development and Design Methods", Dresden, Germany, 2-3 March 2006. http://publications.jrc.ec.europa.eu/repository/handle/JRC33766 [10]M. Király, K. Kulacsy, Z. Hózer, E. Perez-Feró, T. Novotny, High-temperature steam oxidation
kinetics of E110G cladding alloy, J. Nucl. Mater. 475 (2016) 27-36.
https://doi.org/10.1016/j.jnucmat.2016.03.007
[11] E. Perez-Feró, C. Győri, L. Matus, L. Vasáros, Z. Hózer, P. Windberg, L. Maróti, M. Horváth, I.
Nagy, A. Pintér-Csordás, T. Novotny, Experimental database of E110 cladding exposed to accident conditions, J. Nucl. Mater. 397 (2010) 48-54.
https://doi.org/10.1016/j.jnucmat.2009.12.005
[12]M. S. Veshchunov, V. E. Shestak, Modeling of Zr alloy burst cladding internal oxidation and secondary hydriding under LOCA conditions, J. Nucl. Mater. 461 (2015) 129-142.
https://doi.org/10.1016/j.jnucmat.2015.03.006
[13] T. Furuta, S. Kawasaki, Reaction behavior of Zircaloy-4 in steam-hydrogen mixtures at high temperature, J. Nucl. Mater. 105 (1982) 119-131. https://doi.org/10.1016/0022-3115(82)90366- X
[14] W. Wiesenack: Accident-related fuel experiments in Halden - HRP LOCA Test Series IFA-650, IAEA, TWGFPT Orientation 24 April 2014,
[15]M. Billone, Y. Yan, T. Burtseva, R. Daum, “Cladding Embrittlement during Postulated Loss-of- Coolant Accidents”, NUREG/CR–6967, ANL–07/04, (June 2008).
[16] M. Flanagan, “Mechanical Behavior of Ballooned and Ruptured Cladding”, NUREG-2119, US NRC, 2012.
[17]Peter Askeljung, Johan Flygare, Daniele Minghetti, “NRC LOCA Testing Programme at Studsvik, Recent Results on High Burnup Fuel”, “Transactions of TOPFUEL 2012, Manchester.
[18] J. Stuckert, M. Große, C. Rössger, M. Klimenkov, M. Steinbrück, M. Walter, “QUENCH-LOCA program at KIT on secondary hydriding and results of the commissioning bundle test QUENCH- L0”, Nuclear Engineering and Design 255 (2013) 185-201.
[19] M. Grosse, J. Stuckert, C. Roessger, M. Steinbrück, M. Walter, A. Kästner, “Analysis of the secondary cladding hydrogenation during the quench-LOCA bundle tests with Zircaloy-4 claddings and its influence on the cladding embrittlement”, Zirconium in the Nuclear Industry:
17th International Symposium, STP 1543, (Robert Comstock and Pierre Barberis Eds.) pp. 1054- 1073, doi:10.1520/STP154320120155, ASTM International West Conshohocken, PA 2015.
[20] D.R. Olander, “Materials chemistry and transport modeling for severe accident analyses in light- water reactors II: Gap processes and heat release, Nuclear Engineering and Design 148 (1994) 273-292”
[21] Z. Hózer, I. Nagy, N. Vér, R. Farkas: Simulation of Loss-of-Coolant Accidents in the CODEX Integral Test Facility, 40th Enlarged Halden Programme Group Meeting, 24th -29th September, 2017, Lillehammer, paper F2.7
[22]Z. Hózer, Cs. Győri, M. Horváth, I. Nagy, L. Maróti, L. Matus, P. Windberg, J. Frecska: Ballooning Experiments with VVER Cladding, Nucl. Technology, Vol. 152, 2005, pp. 273–285.
[23] Hiroshi UETSUKA, Teruo FURUTA & Satoru KAWASAKI (2012) Zircaloy-4 Cladding Embrittlement due to Inner Surface Oxidation under Simulated Loss-of-Coolant Condition, Journal of Nuclear Science and Technology, 18:9, 705-717, DOI: 10.1080/18811248.1981.9733309

![Table 6. Fitted parameters of the oxidation kinetics of E110G in Equation 2 [10]](https://thumb-eu.123doks.com/thumbv2/9dokorg/1405794.118213/13.892.107.788.105.258/table-fitted-parameters-oxidation-kinetics-e-g-equation.webp)