Co-transmission of acetylcholine and GABA regulates hippocampal states
Virág T. Takács
1, Csaba Cserép
1,4, Dániel Schlingloff
1,2, Balázs Pósfai
1, András Sz ő nyi
1,2, Katalin E. Sos
1,2, Zsuzsanna Környei
3, Ádám Dénes
3, Attila I. Gulyás
1, Tamás F. Freund
1& Gábor Nyiri
1The basal forebrain cholinergic system is widely assumed to control cortical functions via non-synaptic transmission of a single neurotransmitter. Yet, we find that mouse hippocampal cholinergic terminals invariably establish GABAergic synapses, and their cholinergic vesicles dock at those synapses only. We demonstrate that these synapses do not co-release but co- transmit GABA and acetylcholine via different vesicles, whose release is triggered by distinct calcium channels. This co-transmission evokes composite postsynaptic potentials, which are mutually cross-regulated by presynaptic autoreceptors. Although postsynaptic cholinergic receptor distribution cannot be investigated, their response latencies suggest a focal, intra- and/or peri-synaptic localisation, while GABA
Areceptors are detected intra-synaptically. The GABAergic component alone effectively suppresses hippocampal sharp wave-ripples and epileptiform activity. Therefore, the differentially regulated GABAergic and cholinergic co- transmission suggests a hitherto unrecognised level of control over cortical states. This novel model of hippocampal cholinergic neurotransmission may lead to alternative pharma- cotherapies after cholinergic deinnervation seen in neurodegenerative disorders.
DOI: 10.1038/s41467-018-05136-1
OPEN
1Laboratory of Cerebral Cortex Research Institute of Experimental Medicine, Hungarian Academy of Sciences, Szigony u 43, Budapest 1083, Hungary.2János Szentágothai Doctoral School of Neurosciences, Semmelweis University, Budapest 1085, Hungary.3Momentum Laboratory of Neuroimmunology, Institute of Experimental Medicine, Hungarian Academy of Sciences, Szigony u 43, Budapest 1083, Hungary.4Present address: Momentum Laboratory of
Neuroimmunology, Institute of Experimental Medicine, Hungarian Academy of Sciences, Szigony u 43, Budapest 1083, Hungary. These authors contributed equally: Virág T. Takács, Csaba Cserép, Dániel Schlingloff. Correspondence and requests for materials should be addressed to G.N. (email:nyiri@koki.hu)
1234567890():,;
T he cholinergic system arising from the basal forebrain1,2
has a fundamental role in controlling cortical functions including attention
3, learning and memory
4, plasticity
5, sleep–wake alternation
6, and is implicated in neurodegenerative diseases
7.
Contemporary models of the basal forebrain cholinergic system and efforts to develop pro-cholinergic treatments have been based largely on the assumption that cholinergic cells release only a single transmitter and it is released non-synaptically
8–13. The seemingly rare synapses on cholinergic fibres (see Supplementary Discussion) supported the concept of non-synaptic transmission.
However, highly precise cholinergic transmission during reward and punishment
14, recordings of phasic release
10,15,16, and the dependence of hippocampal synaptic plasticity on the millisecond-scale timing of the cholinergic input
17challenge this textbook model of non-synaptic transmission by cholinergic fibres.
Therefore, we hypothesised that all cholinergic terminals establish synapses. After immunolabeling, we analysed the real incidence of synapses, localised vesicle pools using STORM super- resolution imaging and we also localised membrane-docked neurotransmitter vesicles using electron tomography. Because previous data suggested the co-localisation of acetylcholine and GABA in retina and other brain areas
18–23, we also hypothesised that hippocampal cholinergic fibres may be GABAergic as well.
Using immunolabelling and optogenetics combined with in vitro electrophysiology, we investigated the possible presence and sub- cellular regulation of hippocampal co-transmission of acetylcho- line and GABA, and the role of its GABAergic component in controlling hippocampal network activity.
Challenging a decades-old model, we show that all hippo- campal cholinergic terminals establish GABAergic synapses, where cholinergic vesicles are released as well, and these synapses evoke composite (hyperpolarising and depolarising) postsynaptic potentials. Our data suggest synaptic release and action of GABA and synaptic release and a focal, synaptic and/or peri-synaptic action of acetylcholine. GABA and acetylcholine transmissions are modulated by distinct calcium channels and were mutually regulated by presynaptic autoreceptors. We demonstrate here that synaptic release of GABA from cholinergic terminals alone can suppress hippocampal sharp wave-ripples effectively and it can attenuate hippocampal epileptiform activity as well.
Our data urge the re-interpretation of previous studies about the basal forebrain cholinergic system and offer a new explana- tion for the emergence of hippocampal epileptiform activity associated with Alzheimer’s disease-related loss of cholinergic innervation.
Results
All hippocampal cholinergic axon terminals form synapses.
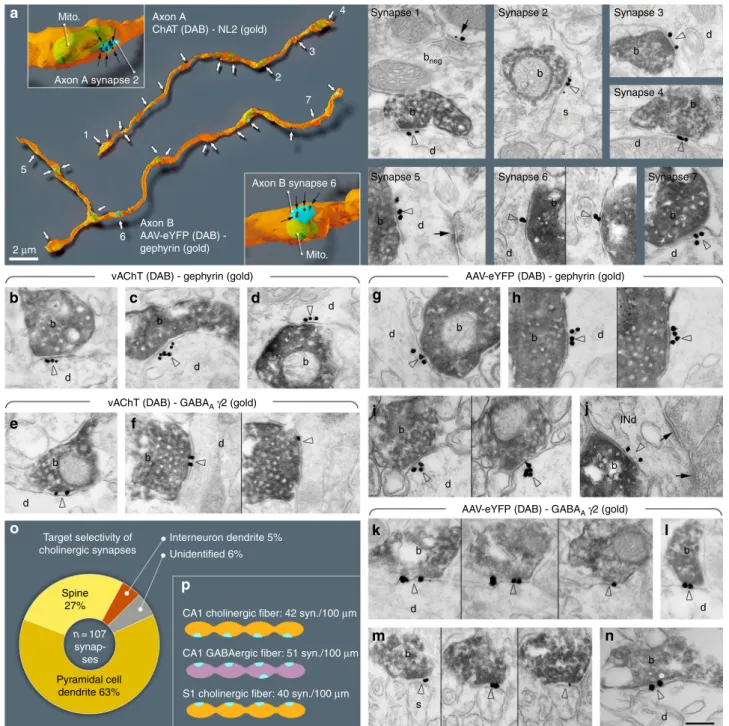
Previous studies concluded that few cholinergic terminals form synapses (see Discussion and Supplementary Discussion). We hypothesised that all cholinergic terminals form synapses. By identifying synapses with neuroligin 2 (NL2) labelling (Fig. 1, Supplementary Figure 1
24,) on cholinergic fibres, we could test the incidence of synapses with three-dimensional serial electron microscopic reconstructions in the hippocampus. We recon- structed randomly selected, long axonal segments [6–33 µm, average: 21 µm, n = 17, labelled either with anti-choline acetyl- transferase (ChAT) antibody in wild-type (WT) mice or with eYFP-adeno-associated viruses (AAV) injected in ChAT-Cre mice, Fig. 1, Supplementary Figure 1, Supplementary Table 4, for controls see Supplementary Note 7 and Supplementary Figure 2]
and identified their synapses with NL2 or gephyrin immunogold labelling. All of them established synapses abundantly (Fig. 1,
Supplementary Figure 1, Supplementary Note 1). The average density of synapses was 42 synapses/100 µm. Some of these contact sites would not have been considered synapses earlier, because of their weak membrane thickening and narrower intercellular synaptic gap (e.g. Figure 1a, synapse 2–3);
24however, NL2 and gephyrin labelling clearly identified their active zones.
For comparison, we have also reconstructed GABAergic axonal segments (labelled for cannabinoid receptor type-1, CB
1; n = 2, 18 and 29 µm, Supplementary Figure 1, Supplementary Table 4), which are known to establish synapses abundantly. Having ver- ified that all hippocampal cholinergic terminals originate from basal forebrain cholinergic cells (for controls see Supplementary Note 7 and Supplementary Figure 2), we found that practically all hippocampal cholinergic terminals examined established one or more NL2-positive synapses (Fig. 1, Supplementary Figure 1;
Supplementary Table 4, Supplementary Note 1). As a con- sequence, the linear density of synapses along cholinergic axons was similar to that along GABAergic axons (Supplementary Figure 1, Supplementary Table 4, number of synapses per 100 µm cholinergic axons: 42 in CA1, 40 in S1, number of synapses per 100 µm CB
1-positive axons: 51).
Using electron microscopy in hippocampal CA1, we found that NL2 and gephyrin positive cholinergic synapses (n = 107, collected from four mice) predominantly innervated pyramidal dendritic shafts (63%) and spine-necks (27%), and they also innervated interneuron dendrites (5%), while some (6%) post- synaptic targets could not be classified (Fig. 1o, Supplementary Table 4).
All innervated spines received another, putatively glutamater- gic asymmetric, type-I input from an unlabelled terminal, suggesting that, contrary to previous suggestion
25, cholinergic synapses alone do not induce spine formation. These data suggest that about 90% of these synapses target pyramidal cells in CA1, whereas they also innervate interneurons (at least 5%), which ratio is close to the neuronal ratios in CA1.
We tested whether these synapses are GABAergic as well. First, we localised the elements of postsynaptic GABAergic signalling machinery in these contacts. We localised gephyrin first, because it is known to interact with both GABA
Areceptors and NL2. We found, that at least 81% of synapses on hippocampal cholinergic fibres contained gephyrin postsynaptically, on dendrites and spine-necks (Fig. 1, Supplementary Note 2, Supplementary Table 3). In addition, we found that at least 80% of these synapses showed GABA
Areceptor gamma2 subunit labelling that was also readily detected on both dendrites and spine-necks (Fig. 1, Supplementary Figure 1, Supplementary Table 3, and Supplementary Note 2).
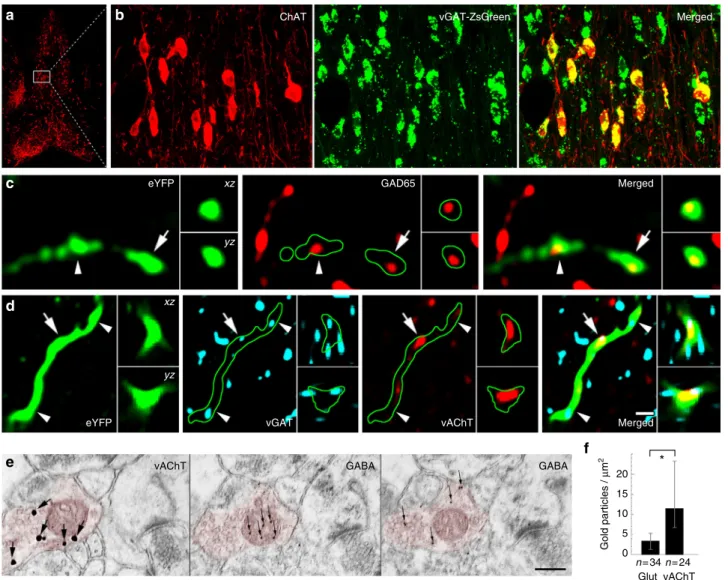
Then, we localised the elements of presynaptic GABAergic and cholinergic signalling machinery in these terminals. By crossing a zsGreen fluorescent reporter mouse-line with a vesicular GABA transporter (vGAT)-Cre mouse line and labelling the medial septum for ChAT, we found that all septo-hippocampal cholinergic cells are also vGAT positive (Fig. 2a, b, Supplemen- tary Note 3). Hippocampal cholinergic terminals expressed the GABA-synthesising enzyme, glutamate decarboxylase 65 (GAD65) as well (Supplementary Note 3, Fig. 2c). In addition, at least 83% of cholinergic septo-hippocampal terminals were vGAT positive (Fig. 2d, Supplementary Note 3), whereas vesicular acetylcholine transporter (vAChT) was detected in 64% of the septo-hippocampal cholinergic terminals (Supplementary Note 4, 5). Finally, using postembedding immunogold staining, we showed that GABA is detectable in cholinergic terminals (Fig. 2e, f, Supplementary Note 3).
Composite GABAergic – cholinergic postsynaptic responses. We
investigated the electrophysiological properties of these
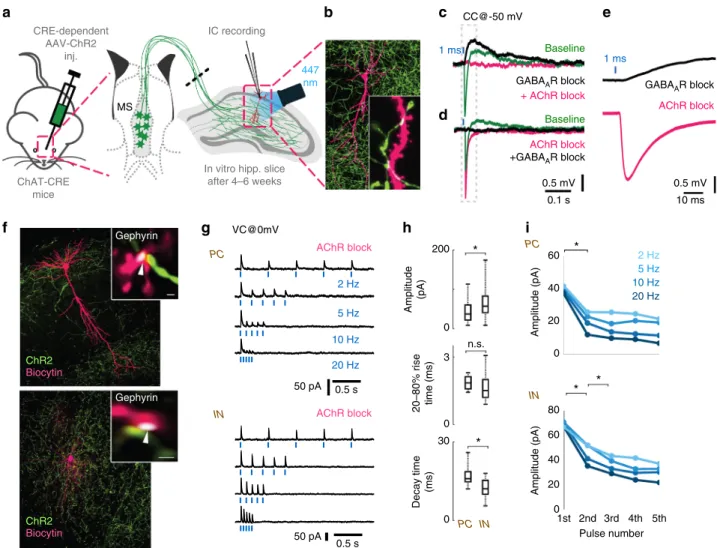
cholinergic responses in target neurons. We injected Cre- dependent, channelrhodopsin-2 (ChR2) expressing adeno- associated virus (AAV-ChR2) into the medial septum of ChAT- Cre knock-in mice (Fig. 3a, see Methods) and recorded
hippocampal cells. AAV-ChR2 labelled only cholinergic cells in the septo-hippocampal pathway (see Supplementary Note 7) and cells of wild-type mice did not respond to illumination, proving that membrane potential responses in ChAT-Cre mice were
Axon A
ChAT (DAB) - NL2 (gold)
Synapse 1 Synapse 2 Synapse 3
Synapse 5 Synapse 6 Synapse 7
Synapse 4 b b
bneg
b
d
s
d
b
b b
b
d
d d d
d d
d d
d
Target selectivity of cholinergic synapses
Interneuron dendrite 5%
Unidentified 6%
b
b
b b
d
d b d
d
INd
b b
b
b
b Axon B synapse 6
Mito.
Axon A synapse 2 Mito.
1
5
2 μm
6
2 7
4
3
Axon B
AAV-eYFP (DAB) - gephyrin (gold)
vAChT (DAB) - gephyrin (gold)
vAChT (DAB) - GABAAγ2 (gold)
AAV-eYFP (DAB) - gephyrin (gold)
AAV-eYFP (DAB) - GABAA γ2 (gold)
b
d
d b
s b CA1 cholinergic fiber: 42 syn./100 μm
Spine 27%
Pyramidal cell dendrite 63%
n= 107 synap-
ses CA1 GABAergic fiber: 51 syn./100 μm S1 cholinergic fiber: 40 syn./100 μm
a
b c
e f
d g h
i j
k l
m n
o
p
Fig. 1All cholinergic terminals establish synapses, express GABAergic markers and innervate pyramidal cells or interneurons.aThree-dimensional EM reconstructions show that hippocampal cholinergicfibres form synapses (arrows) frequently. Axon A is labelled for ChAT in a WT mouse. Axon B is an AAV-eYFP virus-labelled septo-hippocampalfibre in a ChAT-Cre mouse. Insets show two typical terminals with synapses (blue). The plasma membrane was made partially transparent to reveal mitochondria (mito, green). Gold labellings of NL2 (axon A, synapse 1–4) or gephyrin (axon B, synapse 5–7) were used to recognise synapses (black dots and arrows in the insets). EM images show terminal boutons (b) of the reconstructed axonal segments establishing synapses 1–7 (arrowheads, indicated by the same numbers on the left) on dendrites (d) and a spine (s). Next to synapse 1, a ChAT-negative, putative GABAergic terminal bouton (bneg) forming a NL2-positive synapse (arrow) is also shown.b–nEM images reveal the presence of gephyrin (arrowheads, gold;b–d;g–j) and GABAAγ2 receptor subunits (arrowheads, gold;e–f;k–n) postsynaptically in synapses established by vAChT-positive terminals in WT mice (b–f; DAB, b) or by AAV-eYFP-labelled septo-hippocampal terminals in ChAT-Cre mice (g–n; DAB, b). Images of consecutive sections are separated by thin black lines. Terminals innervate dendrites (d) or spines (s). Inj, the postsynaptic target is an interneuron dendrite (INd) that receives type-I synapses as well (arrows). Synapses are from str. ori. (a,b–e,g–j,l,m), str. rad. (k,n) and str. l-m (f). Scale bar is 200 nm for all EM images.oPostsynaptic target selectivity of reconstructed cholinergic axonal segments from str. oriens and radiatum. Spine: 27.1%, pyramidal cell dendrite: 62.6%, interneuron dendrite: 4.7%, unidentifiable: 5.6%.pComparison of the number of synapses per 100µm cholinergic axonal segments in CA1 and S1 cortex and GABAergicfibres in CA1
caused only by cholinergic fibres. NMDA- and AMPA-type glu- tamate receptors were blocked to prevent polysynaptic recruit- ment of neuronal activity in all in vitro recordings presented in Fig. 3.
We recorded the membrane potential of inhibitory neurons in CA1 str. lacunosum-moleculare, because they are known to display cholinergic responses
26. Cells were recorded using whole- cell patch-clamp in responses to 1 ms optical stimulation (Fig. 3a) that resulted in a composite membrane potential response: a GABA
Areceptor-dependent hyperpolarization (peak @ 13.8 ms), and a slightly delayed (peak @ 92 ms) acetylcholine receptor- dependent depolarisation (Fig. 3c–e, Supplementary Figure 3A–C). Although these synaptically released transmitters may act on non-synaptic receptors as well, both responses had relatively short onset latency (2.8 and 7.4 ms, Supplementary Figure 3A–C) compared to typical non-synaptic transmission that has a typical evoked onset latency of about 60–160 ms
27. Together
with our anatomical data these suggest synaptic release and action of GABA and synaptic release and a very focal, synaptic and/or peri-synaptic action of acetylcholine. Synaptic spill-over of GABA and acetylcholine may act extrasynaptically as well.
Next, we blocked both nicotinic and muscarinic acetylcholine receptors (AChR) and recorded inhibitory postsynaptic currents (IPSC) on pyramidal cells (PCs) and interneurons (INs) after optical stimulation of cholinergic fibres (Fig. 3f–i). Single IPSC kinetics and short-term plasticity in PCs and INs were tested using five short light pulses at physiologically relevant firing rates (at 2, 5, 10 and 20 Hz) measured in vivo
28,29. The amplitude of the evoked inhibitory currents (calculated for the first stimulus) was larger on INs than on PCs, but their rise time (20–80%) was not significantly different. IPSCs evoked in INs had a shorter decay time (Fig. 3h). The series of light pulses revealed strong short- term depression (STD) of inhibitory currents onto both PCs and INs (Fig. 3g, i). GABAergic STD was observed in every tested
ChAT
eYFP
eYFP vGAT vAChT
GAD65
GABA GABA
Gold particles / μm2
vAChT
Merged
Merged
vGAT-ZsGreen Merged
xz
yz
xz
yz
20 15 10 5 0
n= 34 Glut
*
n= 24 vAChT
a b
c
d
e f
Fig. 2Cholinergic cells express the molecular machinery required for GABA release.a,bThe cholinergic neurons of the MS are GABAergic. White box in acontains area enlarged inb. Images show neurons stained for ChAT in red, while the green labelling marks the vGAT-expressing neurons in vGAT-ZsGreen reporter mouse.c,dAAV-eYFP virus-traced septo-hippocampalfibres express GAD65 (c). AAV-eYFP virus-traced septo-hippocampalfibres express vGAT and vAChT (d). Insets showxzandyzprojections of the terminal labelled with an arrow. Arrowhead points to another terminal. Green line marks thefibre outline. (Scale bar ondis 210, 14, 2 and 1μm fora,b,candd, respectively.)e,fHippocampal cholinergic terminals contain GABA. Three consecutive EM sections of a vAChT-positive terminal (e, red pseudocolor) are shown. vAChT was visualised by pre-embedding immunogold method (thefirst panel ofe, silver- intensified gold particles, large arrows), whereas on the next ultrathin sections (the second and third panels ofe) postembedding GABA immunostaining was performed (smaller gold particles, thin arrows, some GABA molecules penetrate into mitochondria duringfixation). vAChT signal is absent in postembedding images, because of the etching procedure. Scale bar is 200 nm for all EM images.fCholinergic terminals contained significantly higher immunogold signal than glutamatergic ones (p< 0.05) suggesting the presence of GABA in cholinergic terminals (median and interquartile ranges, Supplementary Note8)
neuron and was accompanied by a decrease in transmission probability during the stimulation sequence (Supplementary Figure 3), suggesting a presynaptic mechanism for STD.
Calcium influx through ChR2 expressed on axon terminals can alter intrinsic short-term plasticity of the synapses
30. To exclude this possibility, we used a digital micro-mirror device (DMD) inserted into the optical path of the microscope, to illuminate cholinergic axons running towards the recorded cell, but not the terminals (Supplementary Figure 3D). This resulted in STD similar to that recorded with optic fibre illumination (Supple- mentary Figure 3E–F), excluding the possibility of ChR2-
mediated Ca
2+influx, as the reason for the observed STD. A series of stimuli could also decrease the driving force of chloride through GABA
ARs, resulting in apparent STD
31,32. In this case, the putative site of STD would be postsynaptic instead of presynaptic. When we used a high Cl
−intracellular solution to prevent shifts in Cl
-reversal, a series of stimuli resulted in STD similar to that shown above (Supplementary Figure 3G and H).
Cholinergic and GABAergic vesicle docking is restricted to synapses. Our physiological and anatomical data showed that cholinergic terminals establish synapses. Non-synaptic
In vitro hipp. slice after 4–6 weeks IC recording CRE-dependent
AAV-ChR2 inj.
ChAT-CRE mice
MS
447 nm
CC@-50 mV
1 ms 1 ms
GABAAR block GABAAR block Baseline
Baseline + AChR block
AChR block
AChR block +GABAAR block 0.5 mV
0.1 s
0.5 mV 10 ms
a b c e
d
Gephyrin VC@0mV
200
0
0
0 20–80% rise time (ms)Decay time (ms)
Amplitude (pA) Amplitude (pA)Amplitude (pA)
3
30 PC
IN Gephyrin
50 pA
50 pA 0.5 s 0.5 s ChR2
Biocytin
AChR block
AChR block 2 Hz 5 Hz 10 Hz 20 Hz
ChR2 Biocytin
* *
* *
n.s.
*
2 Hz 5 Hz 10 Hz 20 Hz 60
40 20 0
60 80
40 20 0 PC
PC
IN
IN
Pulse number 1st 2nd 3rd 4th 5th
f g h i
Fig. 3Optogenetic stimulation of cholinergicfibres elicits composite GABAergic and cholinergic postsynaptic responses.aMedial septum (MS) of ChAT- Cre mice were injected with Cre-dependent AAV containing Channelrhodopsin-2 (ChR2). Using whole-cell patch-clamp in horizontal hippocampal slices, we recorded voltage or current response from hippocampal neurons upon optical excitation of septo-hippocampal cholinergicfibres. NMDA and AMPA receptors were blocked with AP5 (50µM) and NBQX (20µM) in all experiments presented in Figs.3and5.bRepresentative post-hoc visualised CA1 pyramidal cell (magenta) and the surrounding cholinergicfibres (green) with putative contacts (inset, white arrowheads).cBlue light pulses elicited a composite membrane potential response from str. lacunosum-moleculare inhibitory neurons (green, average of 50 stimulations). Inhibition of GABAARs (10µM gabazine) abolishes the hyperpolarising component (nine from nine tested cells), resulting in a putative cholinergic excitatory potential (black).
Inhibition of all AChRs (1µM MLA, 1µM DHβE, 10µM atropine, four from four tested cells) blocks the remaining depolarising response (magenta).
dConversely,first blocking the AChRs, resulted in a putative GABAergic IPSP (magenta), which was blocked by GABAARs inhibitor gabazine (black). The increase of IPSP amplitude for AChR block is addressed in Fig.5.eMagnified cholinergic EPSP (black) fromc, and GABAergic IPSP fromd(magenta) demonstrate their short latency (see also Supplementary Figure3).fA representative recorded pyramidal cell (PC, top) and an inhibitory neuron (IN, bottom) post-hoc visualised in magenta and ChR2 positive cholinergic axons in green. Insets: Immunostaining for gephyrin (white) identify their putative synapses (white arrows).gWe blocked both nicotinic and muscarinic AChRs (1µM MLA, 1µM DHβE, 10µM atropine) and recorded inhibitory postsynaptic currents (IPSC) evoked by cholinergicfibre illumination. Traces show IPSC response of a PC and an IN tofive light pulses (1 ms) at increasing stimulation frequencies (2, 5, 10, 20 Hz, cells were recorded in VC@0 mV).hAmplitude and decay time of unitary GABAergic IPSCs from pyramidal cells (n=5) and inhibitory neurons (n=16) were statistically different (p< 0.05), while their rise time was not different (median values, interquartile ranges and min/max values, see Supplementary Note8).iAverages of IPSC amplitudes for thefive pulses presented ongshows strong short-term depression (STD) of GABAergic transmission evoked by stimulating cholinergicfibres (for details see Supplementary Note8and Supplementary Figure3)
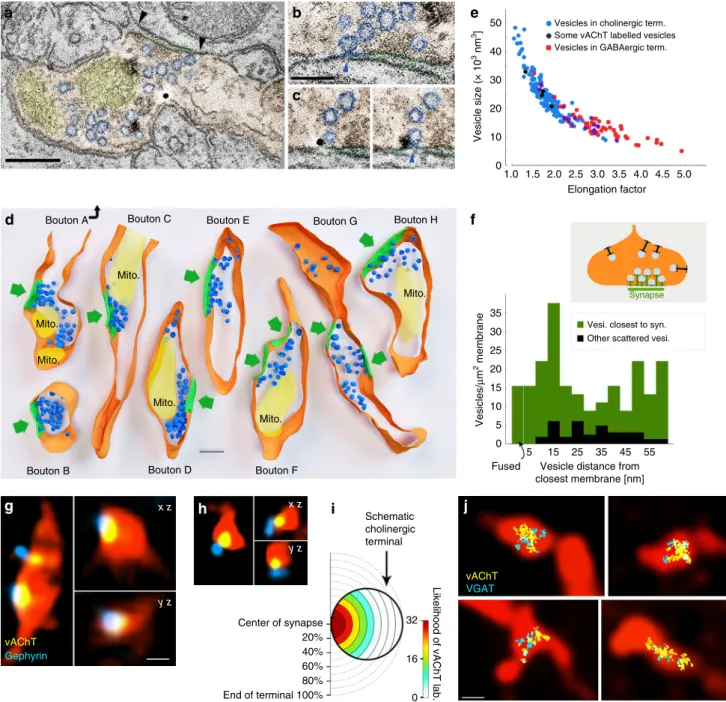
acetylcholine release, however, might still be possible, if choli- nergic vesicles could be docked and fused outside of the synaptic active zones as well. Using advanced electron tomography tools, we were able to reconstruct cholinergic fibre segments, to localise vesicles with 1 nm resolution and to analyse the precise dis- tribution of synaptic vesicles in hippocampal cholinergic term- inals. We identified terminals using vAChT immunogold labelling and reconstructed them using electron tomography (Fig. 4a–d). Three-dimensional reconstruction revealed that synaptic vesicles clustered close to the active zones (Fig. 4d). We measured the distances of vesicles to the closest (synaptic or non- synaptic) cell membranes, and compared their density at different distance intervals from the membranes (Fig. 4f). The density of the vesicles within 60 nm from the membranes was 6.5 times higher in the synaptic active zone than extrasynaptically (Fig. 4d, f). We did not find any docked (<5 nm from the membrane) or fused (undergoing exocytotic fusion) vesicles non-synaptically, but we detected both of these at synapses (Fig. 4b, c, f). The distribution of vesicles in cholinergic terminals was similar to that found at other glutamatergic or GABAergic terminals, arguing against non-synaptic vesicular docking or release in cholinergic terminals.
Vesicular volume can correlate with its transmitter content
33. Therefore, using electron tomography, we compared the vesicular morphology between cholinergic and GABAergic terminals (Fig. 4e). Vesicles of cholinergic terminals were significantly (p
< 0.001), about 60% larger than those in GABAergic terminals (Fig. 4e, Supplementary Note 4) and their volumes were significantly more variable as well (p < 0.001). Smaller (putatively GABAergic) vesicles of cholinergic terminals were similar to those in purely GABAergic terminals (Fig. 4e, see Supplementary Note 4), suggesting an even larger difference between the two types of vesicles.
Acetylcholine and GABA in different vesicles and same vesicle pool. To further confirm that the two transmitter systems use the same active zones, we used confocal fluorescent imaging in mouse hippocampus and found that vAChT-positive vesicles were con- centrated at gephyrin-labelled synapses (Fig. 4g, h, Supplemen- tary Note 5). Scale-free analysis confirmed that the likelihood of vAChT labelling was the highest at the gephyrin-labelled synaptic active zones (Fig. 4i, Supplementary Note 5).
Using super-resolution STORM imaging of vGAT and vAChT immunolabelling, combined with correlated fluorescent confocal laser-scanning microscopy (CLSM) of cholinergic fibres, we demonstrated that cholinergic–GABAergic vesicle pools were mixed and were confined to a small volume of the AAV-eYFP- labelled septo-hippocampal terminals (Fig. 4j, Supplementary Note 5).
Using isolated mouse cortical synaptic vesicles (neocortex and hippocampus, in ~4:1 ratio), we found that acetylcholine and GABA are packed into different vesicles (Supplementary Figure 4A, Supplementary Note 6). Both flow cytometry (Supplementary Figure 4B) and electron microscopy data (Supplementary Figure 4C, E) confirmed the purity of our sample (see also Supplementary Note 6 and Methods). All vesicles were labelled with synaptophysin (SYP). After quadruple- immunolabelling of the isolated synaptic vesicles, 29% were only SYP-positive, 45% were double labelled for vesicular glutamate transporter 1 and SYP, 14% were double labelled for vGAT and SYP, 11% were double labelled for vAChT and SYP. Only a negligible amount of vesicles (0.9%) were triple labelled with any combinations and only 0.14% of all vesicles were co-labelled for vAChT and vGAT, suggesting that vesicular transporters for GABA and acetylcholine are expressed by distinct vesicle
populations in cortical samples (Supplementary Figure 4H;
Supplementary Note 6).
Different Ca-channel and mutual autoreceptor modulation.
Our anatomical data indicated that acetylcholine and GABA are stored in, and thus likely released from different vesicles. First, we investigated presynaptic modulation of this vesicular release.
Blocking AChRs increased the amplitude of GABAergic hyper- polarization (Fig. 3d), for which presynaptic muscarinic receptors may be responsible
26. We held CA1 interneurons at −50 mV, to record GABAergic hyperpolarization and cholinergic depolar- isation concurrently (Fig. 5a, NMDA- and AMPA-type glutamate receptors were blocked to prevent polysynaptic recruitment of neuronal activity in all in vitro recordings presented in Fig. 5).
Muscarinic receptor blocker atropine (10 µM) significantly increased the amplitude of both GABAergic IPSPs and choli- nergic EPSPs (Fig. 5b). By blocking M2-type AChRs, reported abundant in hippocampal cholinergic terminals
26,34, we repro- duced PSP increases evoked by atropine (Fig. 5c). This confirms the role of M2-type AChRs in regulating both acetylcholine and GABA release from cholinergic terminals.
Previously, we described the presence of presynaptic GABA
Bautoreceptors in septal cholinergic cells
35. To test their role in regulating synaptic co-transmission, we blocked GABA
Brecep- tors. This led to a significant increase in the amplitude of both GABAergic IPSPs and cholinergic EPSPs (Fig. 5d). However, we did not see GABA
Breceptor-dependent postsynaptic hyperpolar- ization in response to cholinergic fibre stimulation in our recordings. Overall, these experiments revealed that GABA and acetylcholine cross- and auto-regulate their co-transmission from cholinergic–GABAergic terminals, presynaptically.
Dynamics of vesicle release likely depends on the type of voltage-dependent calcium channels (VDCCs), which mediate Ca
2+-triggered vesicle release
36. However, different VDCCs in the same cell
20can be associated with distinct types of vesicles.
Indeed, we found that selective blockade of P/Q-type calcium channels decreased GABAergic IPSPs significantly, but caused no change in the cholinergic components (Fig. 5e). Conversely, the cholinergic component was robustly decreased after the selective blockade of N-type calcium channels, while GABAergic IPSPs showed no significant change (Fig. 5f). Besides confirming the presence of different vesicular pools, this revealed different molecular pathways for their regulation during co-transmission.
Distinct vesicle pools of the same terminals can couple to different release mechanisms with different short-term plasti- city
20. Because GABAergic transmission always showed strong STD in cholinergic terminals (Fig. 3g, i), we examined, whether cholinergic responses display similar short-term dynamics. We recorded inhibitory neurons in the physiologically relevant current clamp (I = 0) situation, and repeatedly light-stimulated ChR2-expressing cholinergic axons (Supplementary Figure 3J).
The net depolarisation for a series of five stimuli did not decrease.
Also, the area under the voltage curve increased with frequency (Supplementary Figure 3J–K). In current clamp (more than in voltage clamp) even a non-depressing transmission could be seen as depressing due to reduction of driving force. Therefore, based on our current clamp measurements, it is highly unlikely that the cholinergic component would show such a strong STD as the GABAergic component.
GABA release of cholinergic cells shape hippocampal states.
Septal cholinergic neurons control hippocampal activity
states
37,38and suppress in vivo sharp wave-ripples (SWR) in the
hippocampus
39. However, the effect of their hippocampal GABA
release has not been investigated. We recorded spontaneous
Vesicles in cholinergic term.
Vesi. closest to syn.
Synapse
Other scattered vesi.
Some vAChT labelled vesicles Vesicles in GABAergic term.
Vesicle size (× 103 nm3]Vesicles/μm2 membrane
35 30 25 20 15 10 5 0
Schematic cholinergic terminal
Likelihood of vAChT lab.
Vesicle distance from closest membrane [nm]
x z x z
y z
y z
vAChT VGAT
Fused
5 15 25 35 45 55 50
40 30 20 10 0
Elongation factor Bouton A
Bouton B Bouton D Bouton F
Bouton C Bouton E Bouton G Bouton H
Mito.
Mito.
Mito.
Mito.
Mito.
Mito.
1.0 1.5 2.0 2.5 3.0 3.5 4.0 4.5 5.0
vAChT Gephyrin
32
16
0 Center of synapse
20%
40%
60%
80%
End of terminal 100%
a b
c
e
d f
g h i j
Fig. 4Separate vesicular release of acetylcholine and GABA from the same synaptic active zones.a–cAbout 0.5 nm-thick virtual sections from electron tomographic reconstructions of cholinergic terminals. Terminal is orange, mitochondria are yellow, synaptic vesicles are blue. Black arrowheads point to the edges of the synapse. Scale bar is 200 nm.bActive zone is enlarged froma. The omega-shaped vesicle is being fused with the terminal membrane (blue arrowhead).cTwo serial virtual sections showing a portion of the active zone of another terminal. A fused synaptic vesicle (blue arrowhead) is labelled for vesicular acetylcholine transporter (black immunogold particle). Scale bar forbandcis 100 nm.dThree-dimensional models of reconstructed terminals.
Terminal membranes are orange, mitochondria are yellow, synaptic vesicles are blue and synapses are green. Green arrows point to the synapses. Scale bar is 200 nm. The association of the vesicle pools to the active zones is evident.eScatterplot shows the relationship of vesicle size (volume) and elongation factor in the sampled vesicles. Vesicles in the cholinergic terminals had a broader size-distribution than vesicles of purely GABAergic terminals, which were smaller and more elongated (Supplementary Note4). Some vesicles (black markers) could be identified as vAChT-positive because immunogold particles clearly labelled them.fThe density of the vesicles within a 60-nm-wide band from the membrane is plotted as a function of distance from the terminal membrane at synaptic (green) and extra-synaptic (black) areas. Vesicle density was 6.5 times higher (in thefirst 60 nm from the membrane) in the synaptic active zone than extrasynaptically (n=183 vesicles from 8 terminals in 2 mice). Docked (closer to the membrane than 5 nm) or fused (undergoing exocytotic fusion) vesicles were absent extrasynaptically, but were present in the active zones.g,hvAChT labelling was confined to synaptic active zones in cholinergicfibres. CLSM images show terminals of virus-traced septo-hippocampalfibres (red pseudocolor) containing vAChT- positive vesicle pools (yellow), localised to the synaptic active zones that are identified by gephyrin labelling (blue). Scale bar is 500 nm forgandh.iScale- free analysis confirms that the likelihood of vAChT labelling is the highest at the synaptic active zones (n=32 synapses, 2 mice).jCorrelated CLSM- STORM super-resolution microscopy images show that vAChT (yellow) and vGAT (cyan) vesicle pools are overlapping and are confined to small portions within AAV-eYFP virus-traced septo-hippocampalfibres (red pseudocolor)
SWRs in hippocampal slices (Fig. 6, Methods). Illumination of control slices without ChR2 expression caused no change in SWR activity. In AAV-ChR2-infected ChAT-Cre mice, we found that without blocking cholinergic transmission, optical stimulation of cholinergic fibres decreased SWR rate significantly (Fig. 6c, d), followed by a transient increase in SWR rate after the cessation of optical stimuli. However, when cholinergic transmission was blocked, the same optical stimulation caused a similar decrease in SWR rate (Fig. 6e, f), with no rebound after stimulation. Although cholinergic fibres have been reported to be responsible for inhi- biting SWRs
39, here we demonstrated that GABA release from cholinergic synapses alone is sufficient to downregulate the rate of SWRs.
The GABA release from septo-hippocampal cholinergic fibres may also affect the occurrence of hippocampal epileptiform activity. Therefore, we examined the effect of GABA release from cholinergic axons in the in vitro high potassium epilepsy model (Fig. 6g–k)
40,41. Optical stimulation of cholinergic fibres reduced the rate of epileptiform events (Fig. 6h, i) and a similar reduction was present, when AChRs were blocked (Fig. 6j, k). These results
demonstrated that synaptic transmission of GABA from choli- nergic fibres alone can effectively control hippocampal epilepti- form activity.
Discussion
Our results challenge the model of non-synaptic single trans- mitter release from cholinergic fibres in the hippocampus and demonstrate that all cholinergic terminals establish synapses, where GABA and acetylcholine are released into the same synaptic gap. Our results also show non-synaptic action of these synaptically released transmitters. We showed that hippocampal cholinergic terminals established effective GABAergic synapses as well. Cholinergic fibres are among the densest and most influ- ential subcortical pathways in hippocampus; therefore, our find- ings suggest a fundamental change in our view of the regulation of hippocampal states. We also found that acetylcholine and GABA were not co-released but co-transmitted from the same synaptic active zone. We confirmed this by showing that (i) isolated cortical transmitter vesicles do not co-express vGAT and vAChT, (ii) they are preferentially modulated by distinct voltage-
1 mV
CC@-50mV
5 4 3 2 1 0
5 4 3 2 1 0
2
1
0 2
1
0 2
1 3
0
n. EPSP ampl. n. EPSP ampl. n. EPSP ampl.n. IPSP ampl. n. IPSP ampl.
Norm. IPSP ampl.
2
1
0 GABAAR block
Atropine AFDX-116 CGP-55845
DHBE 0.2 s
0.2 s 0.2 s 0.2 s
Control
Control Control Control
* * * * * *
a b c d
CC@-50mV n.s. *
2
1
0 2
1
0
n. EPSP area
n. EPSP area
n. IPSP ampl. n. IPSP ampl.
2
1
0 2
1
0 P/Q-type VDCC block
0.5 s
0.5 s 0.5
mV 0.5
mV Control
CC@-50mV N-type VDCC block Control
* n.s.
e f
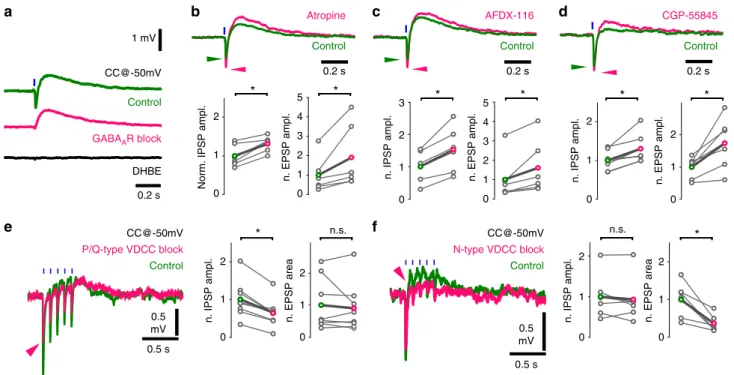
Fig. 5Co-transmission of GABA and acetylcholine is cross-regulated by autoreceptors and mediated by distinct calcium channels.aOptical stimulations of cholinergicfibres trigger composite membrane potential responses (average of 50 traces) of an inhibitory neuron recorded in str. lacunosum-moleculare (green). Cells were held at approximately−50 mV to record hyperpolarising and depolarising components concurrently. Early hyperpolarization was confirmed to be of GABAergic origin by bath application of the GABAAR blocker gabazine (magenta, 10µM, which abolished quick hyperpolarization in 9 out of 9 tested cells), while the late depolarisation was confirmed to be cholinergic by the application of the alpha4-type nicotinic acetylcholine receptor blocker DHβE (black, 1µM, which abolished depolarisation in 5 out of 5 tested cells). Cells with identifiable nicotinic responses were used to further investigate the properties of GABA and acetylcholine release from cholinergicfibres.bIncrease in GABAergic response after AChR block (Fig.3d) suggested that presynaptic muscarinic receptors cross-modulated GABA (and possibly ACh) release from cholinergicfibres. Therefore, putative presynaptic muscarinic receptors were selectively inhibited via bath application of atropine (n=6), which led to a significant increase in amplitude of both the GABAergic hyperpolarization and nicotinic depolarisation (green, see Supplementary Note8).cBath application of the selective M2 antagonist AFDX- 116 (10µM,n=6) resulted in changes similar to that of atropine application (for data see Supplementary Note8).dBlocking GABABRs with CGP-55845 (1µM,n=7) also resulted in increased GABAergic and cholinergic responses suggesting a dual modulatory role (for data see Supplementary Note8).
e,fTesting roles of distinct voltage-dependent calcium channels (VDCC) in release of GABA and ACh .eBlockade of P/Q-type VDCC, using selective antagonistω-agatoxin (1µM, puff application), reliably decreased GABAergic response component but did not alter cholinergic component. At control conditions, 5 short (1 ms) light pulses at 10 Hz evoked a composite event of GABAergic hyperpolarization and cholinergic depolarisation (green, average of 20 traces). In response toω-agatoxin application (magenta,n=9), the GABAergic component (measured as IPSP amplitude) decreased robustly (magenta arrowhead) and the cholinergic component (measured as EPSP area) showed no change (for details see Supplementary Note8).fBlockade of N- type VDCC, using selective blockerω-conotoxin (1µM), reliably reduced cholinergic response component (n=6) but left GABAergic component unchanged (for details see Supplementary Note4)
dependent calcium channels and (iii) electron tomography sug- gested differences in the volume of GABA and acetylcholine containing vesicles. This co-transmission (similar to that in retina
20) may require nanoscale sub-synaptic organisation of pre- synaptic molecules, as proposed before
42,43. Emphasising the functional role of GABA release, we also demonstrated that synaptic GABA release from cholinergic terminals alone can effectively suppress hippocampal sharp wave-ripples and per se can attenuate hippocampal epileptiform activity. These confirmed the functional importance of this GABAergic–cholinergic co-
transmission in healthy and pathological states and led to a novel model of the septo-hippocampal cholinergic neurotransmission.
For decades, the predominant form of cholinergic commu- nication was thought to be a form of non-synaptic release
8–10,12,44, which was seemingly supported by studies showing cholinergic fibres with few synapses (for details see Supplementary Discus- sion). Originally, the presence of extra-synaptic acetylcholine receptors and micro-dialysis experiments seemed to support a non-synaptic release hypothesis; however, later, sensitive micro- electrodes showed faster changes in extracellular acetylcholine
LFP recording 447
nm
Hippocampal slice with ChR2 containing fibres from MS
Spontaneous sharp wave-ripple activity
AChRs are not blocked
1 ms @ 10 Hz
#1
#2
#3
AChRs are blocked SWR peaks
SWR peaks
Frequency (Hz)
400
200
20
0 50 100
Time (ms) LFP
0.1 mV
4 3 2 1 0
3 2 1 10 s 0
Rate (Hz)Rate (Hz)
n.s
**
** **
*
*
a b c d
e f
Pharmacologically evoked
epileptic activity
AChRs are not blocked
AChRs are blocked AChRs are blocked
AChRs are not blocked Eplieptic act. peaks
Eplieptic act. peaks
1ms @ 10 Hz
10 s
Frequency (Hz)
400 600
200 20
0 200 400
Time (ms) LFP
1 mV
1
0
1
0
Rate (Hz) Baseline Activation Recovery
Baseline Activation Recovery
Rate (Hz)
n.s n.s
* *
* *
g h i k
j
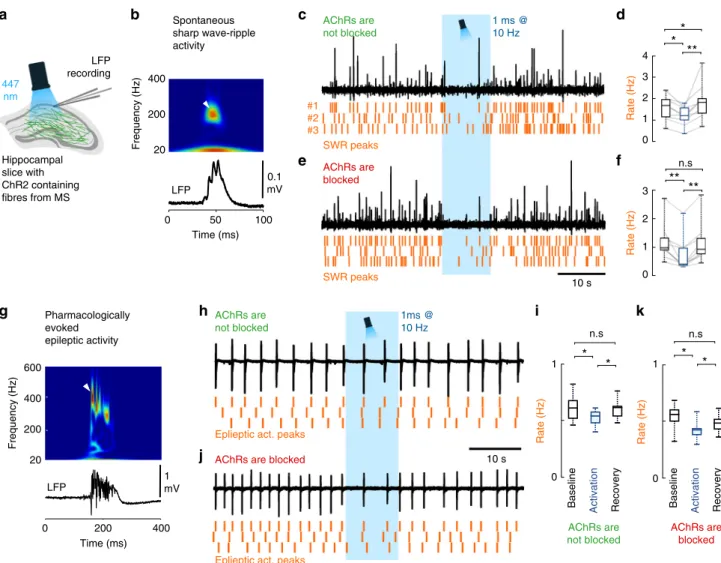
Fig. 6GABA release from cholinergic terminals controls healthy and pathological hippocampal network activity.aTo understand the functional impact of GABA and acetylcholine co-transmission onto cortical network oscillations, localfield potential (LFP) was recorded with standard patch pipettes from the CA1 area of thick hippocampal slices. These slices generated healthy and pathological in vivo like activity patterns. Cholinergicfibres expressing ChR2 were illuminated with blue light in the presence, or in the absence of AChR blockers parallel with LFP recordings.bA spontaneous sharp wave-ripple (SWR) LFP signature (bottom), and its wavelet transform (top) highlighting the characteristic ripple-band frequency component (~200 Hz, white arrowhead).c,dLFP recording from hippocampal CA1 in the absence of AChR blockers (n=9). Orange raster indicate SWR peaks for three consecutive stimulation periods.
Optical stimulation decreased SWR rate significantly (d), then SWR rate increased temporarily after the cessation of optical stimulation (median values, interquartile ranges and min/max values, for data see Supplementary Note8).e,fAfter we blocked AChRs (1µM MLA, 1µM DHβE, 10µM atropine), LFP recording from CA1 (n=9) showed that GABA release from cholinergicfibres alone could decrease SWR rate even more effectively (f). There was no SWR rate increase after the cessation of optical stimulation (median values, interquartile ranges and min/max values, for data see Supplementary Note8).
gEpileptiform activity was evoked by elevating K+concentration in the ACSF to 8.5 mM in slices. LFP (bottom) and its wavelet transform (top) shows the signature of a pharmacologically evoked epileptiform events. Note the robust differences in amplitude, length and frequency components compared to physiological SWR activity (Fig.6b) that is consistent with literature data41.h,iEpileptic activity recorded in CA1 in the absence of AChR blockers (n=7).
Orange raster indicate detected epileptic activity peaks for three consecutive stimulation periods. Illumination of cholinergicfibres reduced the rate of epileptic events (i), which recovers after the cessation of optical stimulation (for data see Supplementary Note8).j,kEpileptic activity recorded in CA1 in the presence of AChR blockers (n=8). Even in the presence of AChR blockers, illumination of cholinergicfibres reduced the rate of epileptic discharges (k), which recovers after the stimulation (median values, interquartile ranges and min/max values, for data see Supplementary Note8), suggesting a crucial role for GABA release in controlling epileptiform activity
levels (Supplementary Discussion). In addition, basal forebrain cholinergic neurons were also shown to respond to reward and punishment with extremely high speed and precision
14, and recent data suggested that cholinergic cells may regulate cor- tical information processing with a remarkable, millisecond- scale temporal precision
15,17,45–48. These data urged the re- examination of whether acetylcholine release is synaptic
49. Using electron tomography and direct labelling of synapses for neuro- ligin 2, we showed that, all terminals of the dense meshwork of hippocampal cholinergic fibres established (one or more) synapses and no docked or fused vesicles were detectable non- synaptically. Most of these synapses were missed previously, probably, because of their weak membrane thickening and nar- rower synaptic gap. Furthermore, we found that vAChT-labelled vesicle pools associated only with synaptic active zones (Fig. 7).
Non-synaptic transmission has a typical delayed onset latency of about 60–160 ms
27, while synaptic onset latencies are typically more than an order of magnitude faster. For instance, the average latency with optogenetic stimulation can be as long as 6.4
50or 5.6 ms
51for monosynaptic glutamate transmission. Our data show the release of acetylcholine into the synaptic active zone and a 7.4 ms onset cholinergic response latency. These response latencies suggest a focal, intra- and/or peri-synaptic localisation of nico- tinic receptors, while GABA
Areceptors are detected intra- synaptically. However, future work will be required to resolve the contribution of intra- and/or peri-synaptic receptors to the cholinergic response, because measured, relatively fast latency alone cannot reveal the distribution of postsynaptic receptors around synapses. Although none of our data suggests “volume transmission” of acetylcholine or GABA, they may still act on extra-synaptic receptors as well, in a “volume transmission”
fashion. In fact, the most likely resolution for the mismatch between our and the classic non-synaptic volume transmission hypothesis is a strong “spill-over” of transmitters from these frequently occurring synapses that would allow transmitters to
reach extra-synaptic receptors as well. In fact, the much larger cholinergic vesicles that we found could contain more acet- ylcholine to counteract its effective extra-synaptic removal by extracellular acetylcholine esterase.
Co-transmission can significantly increase the efficacy of information transfer
52–54. Using purified vesicle preparation, we showed that GABA and acetylcholine are not “co-released” from the same vesicles, but “co-transmitted” from separate vesicles, sequentially inhibiting and exciting hippocampal neurons. To unlock the full potential of co-transmission, these coexisting vesicle pools need complex regulation. Indeed, we showed that the release of GABAergic vesicles are preferentially regulated by P/Q-type calcium channels, while the cholinergic ones are more affected by N-type calcium channels in the same synapses (Fig. 7), similar to that of retinal co-transmission of GABA and acet- ylcholine
20, therefore, an activity-dependent segregation in their release is also possible. Under special circumstances one of these transmitters may even be depleted earlier (GABAergic trans- mission shows strong STD). Differential calcium channel reg- ulation may be achieved by sub-synaptic nanoscale organisation of presynaptic molecules
42,43, while the presence of two different kinds of presynaptic channel “slots” have already been suggested at excitatory synapses: one accepting N-type channels but rejecting P/Q-type (N-specific) and the other preferring P/Q-type but also accepting N-type (PQ preferring
53,).
Negative feedback via presynaptic autoreceptors could provide a further level of control (Fig. 7). Previously, we demonstrated that septo-hippocampal cholinergic neurons express GABA
B- receptors
35, while the expression of muscarinic M2 receptors was also described in these cells
34. Indeed, we confirmed that blocking either M2- or GABA
B-receptors increased the release of both acetylcholine and GABA, suggesting the presence of tonically active autoreceptor regulation of these transmitters, pre- synaptically. In addition, our results, verified by a series of control experiments, suggested that GABAergic STD is an intrinsic property of synapses established by cholinergic fibres in the mouse hippocampus.
The timing of this co-transmission seems crucially important in hippocampal Schaffer collateral (SC) to CA1 synaptic plasti- city. If the cholinergic input was activated 100 or 10 ms before SC stimulation, it resulted in ionotropic AChR-dependent long-term potentiation (LTP) or short-term depression, respectively, while delaying cholinergic stimulation until 10 ms after SC stimulation resulted in metabotropic AChR-dependent LTP
17. Here, we found that the GABAergic and cholinergic components of this co-transmission reach their IPSP and EPSP peak about 13.8 and 92 ms after stimulation, respectively, which suggest that synaptic plasticity may depend on the coincidence of SC stimulation with the GABAergic or cholinergic component of PSPs from these basal forebrain fibres. Nevertheless, the GABAergic component seems to have its own inhibitory role in the target network, making basal forebrain cholinergic fibres an unorthodox but effective source of GABAergic inhibitory control of the hippo- campus, as suggested by our demonstration of its effect on net- work dynamics.
Basal forebrain cholinergic cells play a pivotal role in trans- forming activity states in the hippocampus
37. High cholinergic cell activity is associated with theta oscillation and the fast, yet unstable storage of external information in the hippocampus, while low cholinergic activity accompanies sharp wave-ripple (SWR) activity
55, which seems important for the consolidation and relocation of unstable memory traces from the hippocampus to the neocortex
56,57. Classic theories of cholinergic modulation presume that diffusely released acetylcholine would slowly retune cortical network activity, enabling the appearance of distinct network dynamics
8,58,59. Indeed, a recent study demonstrated
SynapseP/Q-VDCC
GABAAR
GABABR Gephyrin
NL2 nAChR M2 AChR ?
ChAT vGAT
N-VDCC
Basal forebrain Dentritic shaft or spine neck vAChT
ACh GAD65
GABA vGAT
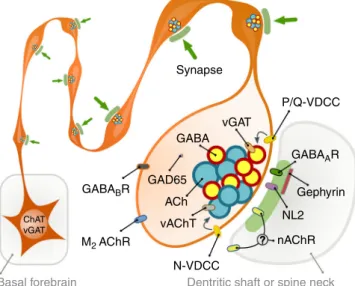
Fig. 7Illustration of cholinergic terminals and their synaptic architecture.
Summary illustration of some of thefindings. All cholinergic terminals establish synapses, they are fully equipped with GABAergic–cholinergic co- transmission signalling machinery. GABAergic and cholinergic vesicles are regulated by different VDCCs. Although postsynaptic cholinergic receptor distribution cannot be investigated, their response latencies (that are at least and order of magnitude faster that typical non-synaptic transmission) suggest a focal, intra- and/or peri-synaptic localisation, while GABAA
receptors are detected intra-synaptically. Synapses are established on both dendritic shafts and spines in hippocampus
that medial septal cholinergic cells suppress SWR activity in vivo
39. The authors suspected an M2 cholinergic receptor- mediated suppression of GABAergic interneurons. We re- examined that hypothesis and confirmed that cholinergic fibre activation indeed suppressed SWRs; however, we also showed that GABA (without acetylcholine) release from cholinergic fibres alone was able to achieve that. This GABAergic inhibition could lower the probability of concurrently active pyramidal cells in a given time-window, which is required for stochastic SWR initiation
60. Blocking all GABA receptors would have eliminated SWRs
61, therefore the effect of acetylcholine release alone, with- out the contribution of GABA co-transmission could not be addressed. The presence of a transient increase in SWR rate after the cessation of optical stimuli, might reflect longer-lasting changes in network or cell excitability, mediated by “synaptic spill-over” of acetylcholine, while the effect of GABA release from smaller vesicles is likely confined to synaptic (and presynaptic) receptors. However, this transient effect was not reported in vivo
39, therefore, it could have been the result of a relatively low acetylcholine esterase activity in our dual-superfusion system.
Degeneration of the cholinergic system is a typical character- istic of Alzheimer’s disease pathology
7, and these patients often develop epileptic seizures
62. Indeed, selective lesion of medial septal cholinergic projection increases seizure incidence in the hippocampus
63–65, while REM-sleep, which is associated with enhanced cholinergic cell activity
29, has a suppressing effect on epileptic seizures
66,67. The mechanisms, however, were unclear, because several cholinergic agonists were shown to trigger epi- leptic discharges
68. Therefore, we hypothesise that degeneration of basal forebrain cholinergic cells leads to epileptiform activity primarily, because it deprives the hippocampus of a massive GABAergic input. Indeed, our results supported this idea, because GABA release from basal forebrain cholinergic fibres alone was sufficient to decrease the occurrence of epileptiform activity in the hippocampus.
Our results, showing a tightly regulated, effective, synaptic GABA co-transmission from hippocampal cholinergic fibres urge the re-interpretation of previous models and can lead to alter- native pharmacotherapies to treat Alzheimer’s disease-related loss of cholinergic innervation.
Methods
Animals and surgery. A total of 21 (25–80 days old) male C57BL/6J mice, 51 (30–200 days old) ChAT-IRES-Cre mice from either sex (Jackson Laboratory, RRID: IMSR_JAX:006410, postnatal day 30–200) and 4 (30–50 days old) VGAT- IRES-Cre/Gt(ROSA)26Sor_CAG/ZsGreen1 mice were used in the present study.
All experiments were performed in accordance with the Institutional Ethical Codex, Hungarian Act of Animal Care and Experimentation (1998, XXVIII, sec- tion 243/1998) and the European Union guidelines (directive 2010/63/EU), and with the approval of the Institutional Animal Care and Use Committee of the Institute of Experimental Medicine of the Hungarian Academy of Sciences. All efforts were made to minimise potential pain or suffering and to reduce the number of animals used.
ChAT-Cre mice were anaesthetised with isoflurane followed by an
intraperitoneal injection of an anaesthetic mixture (containing 8.3 mg/ml ketamine, 1.7 mg/ml xylazine-hydrochloride in 0.9 % saline, 10 ml/kg bodyweight) and then were mounted in a stereotaxic frame. For selective labelling of septo-hippocampal cholinergic axons, we injected 30–60 nl AAV2/5-EF1a-DIO-eYFP (UNC Vector Core) or AAV2/5-EF1a-DIO-ChR2(H134R)-eYFP-WPRE-hGH (plasmid:
Addgene 20298, Penn Vector Core) into the medial septal area. The coordinates for the injection were based on the atlas by Paxinos, G and Franklin, (2012)69: 1 mm anterior from the bregma, in the midline, and 4.3 mm below the level of the horizontal plane defined by the bregma and the lambda (zero level). For a control experiment, 100 nl injections of the same virus were delivered into the
hippocampus (both hemispheres) of a ChAT-Cre mouse (coordinates:−2.7 mm from the bregma, ±2.5 mm from the midline, 2.5 mm from the zero level and−3.1 from the bregma, ±3 mm from the midline and 3 mm from the zero level). For the injections, we used a Nanoject 2010 precision microinjector pump (WPI, Sarasota, FL 34240). We used borosilicate micropipettes (Drummond, Broomall, PA) for the injections with tips broken to 40–50 µm. After the surgeries, the animals received 0.5–0.7 ml saline for rehydration and 0.03–0.05 mg/kg meloxicam as nonsteroidal
anti-inflammatory drug (Metacam, Boehringer Ingelheim, Germany)
intraperitoneally to support recovery, and we placed them into separate cages to survive for at least three weeks before decapitations or perfusions.
Slice preparation and recording conditions. After 3–6 weeks following injection (to reach an appropriate expression level in long-range projecting axons) hor- izontal slices were prepared. In all cases, mice were decapitated under deep iso- flurane anaesthesia. The brain was removed into ice-cold cutting solution, which had been bubbled with 95% O2–5% CO2(carbogen gas) for at least 15 min before use. The cutting solution contained the following (in mM): 205 sucrose, 2.5 KCl, 26 NaHCO3, 0.5 CaCl2, 5 MgCl2, 1.25 NaH2PO4, 10 glucose, saturated with 95%
O2–5% CO2. Horizontal hippocampal slices of 300 µm or 450 µm thicknesses (for whole-cell and LFP recordings, respectively) were cut using a vibratome (Leica VT1000S). After acute slice preparation the slices were placed into an interface- type holding chamber for recovery. This chamber contained standard artificial cerebrospinalfluid (ACSF) at 35 °C that gradually cooled down to room tem- perature. The ACSF had the following composition (in mM): 126 NaCl, 2.5 KCl, 26 NaHCO3, 2 CaCl2, 2 MgCl2, 1.25 NaH2PO4, 10 glucose, saturated with 95% O2–5%
CO2. After incubation for at least 1.5 h, slices were transferred individually into a submerged-style recording chamber equipped with a single superfusion system. In case of LFP recording of hippocampal network activities, a double superfusion system was used for improved slices maintenance conditions60,70. In the latter design, the slices were placed on a metal mesh and two separatefluid inlets allowed ACSF toflow both above and below the slices with a rate of 3–5 ml/min for each flow channel at 30–32 °C (Supertech Instruments;www.super-tech.eu). The com- position of the modified ACSF (mACSF) used in experiment presented in Fig.6g–k was the following (in mM): 126 NaCl, 3.5 KCl, 26 NaHCO3, 1.6 CaCl2, 1.2 MgCl2, 1.25 NaH2PO4, 10 glucose saturated with 95% O2–5% CO2. Epileptic events were evoked by further increasing the potassium concentration from 3.5 to 8.5 mM after 15 min spent in mACSF in the recording chamber. Slices were visualised with an upright microscope (Nikon Eclipse FN1 or Olympus BX61WI) with infrared- differential interference contrast optics. Standard patch electrodes were used in all recording configurations (i.e., in whole-cell patch-clamp andfield potential recordings). Pipette resistances were 3–6 MΩwhenfilled either with the intra- cellular solution or with ACSF. ACSFfilled pipettes placed into CA1 pyramidal layer were used for localfield potential (LFP) recordings. The composition of the intracellular pipette solution was the following (in mM): 110 K-gluconate, 4 NaCl, 20 HEPES, 0.1 EGTA, 10 phosphocreatine, 2 ATP, 0.3 GTP, 3 mg/ml biocytin adjusted to pH 7.3–7.35 using KOH (285–295 mOsm/L). Where indicated, high- chloride containing intracellular solution was used: 54 K-gluconate, 4 NaCl, 56 KCl, 20 HEPES, 0.1 EGTA, 10 phosphocreatine, 2 ATP, 0.3 GTP, 3 mg/ml biocytin adjusted to pH 7.3–7.35 using KOH (285–295 mOsm/L). Whole-cell series resis- tance was in the range of 5–15 MΩ. Series resistance was not compensated but was frequently monitored, and cells where the values changed more than 25% during recording were discarded from further analysis. Voltage measurements were not corrected for the liquid junction potential.
Drugs. To avoid polysynaptic effects in response to optical stimulation of choli- nergicfibres, glutamatergic excitatory currents were blocked by 20μM NBQX and 50μM AP5 in all experiments presented on Figs.3,5and Supplementary Figure3.
The following drug concentrations were used in the specified experiments (wash application): 20 µM NBQX, 50 µM AP5, 10 µM atropine, 1 µM MLA, 1 µM DHBE, 10 µM gabazine, 1 µM CGP-55845. For puff application ofω-conotoxin (1 µM) and ω-agatoxin (1 µM), a glass capillary was placed adjacent to the recorded cell. These drugs were injected by mouth-applied pressure for 1–2 min during the stimulation protocol following the control period. Drugs were dissolved in HEPES-based buffer with a composition in mM: 126 NaCl, 10 glucose, 2.5 KCl, 1.25 NaH2PO4, 2 CaCl2, 2 MgCl2, 26 HEPES, pH 7.3. Gabazine (SR 95531 hydrobromide), CGP-55845, MLA (Methyllycaconitine citrate), DhβE (dihydro-β-erythroidine hydrobromide) and AFDX-116 were purchased from Tocris Bioscience,ω-conotoxin andω- agatoxin were purchased from Almone labs, and NBQX (2,3-Dioxo-6-nitro- 1,2,3,4-tetrahydrobenzo[f]quinoxaline-7-sulfonamide) and AP5 were purchased from Hello Bio. All other salts and drugs were obtained from Sigma-Aldrich or Molar Chemicals KFT.
Anatomical identification. The recorded cells werefilled with biocytin. After the recording, the slices werefixed in 4% paraformaldehyde in 0.1 M phosphate buffer (PB; pH 7.4) for at least 3 h, followed by washout with PB several times. Then, sections were blocked with normal goat serum (NGS; 10%) diluted in Tris-buffered saline (pH 7.4), followed by incubations in Alexa Fluor 594-conjugated streptavidin (1:1000; Invitrogen). Sections were then mounted on slides in Vectashield (Vector Laboratories) and were morphologically identified on the basis of their location, dendritic and axonal arborisation.
Optogenetic illumination. For illumination, we used a blue laser diode (447 nm, Roithner LaserTechnik GmbH) attached to a single opticfibre (Thorlabs) posi- tioned above the hippocampal slice. In all cases, 1 ms pulse length was used. In case of structured illumination (Supplementary Figure3), the same laser was used with a digital micro-mirror device (Polygon400, Mightex Systems, Toronto, Canada)