U N C O R R E C TE D P R O O F
Contents lists available at ScienceDirect
Toxicology in Vitro
journal homepage: www.elsevier.com
MICAN, a new uorophore for vital and non-vital staining of human cells
Zsolt Nagy , Miklós Nagy , Alexandra Kiss , Dávid Rácz , Beatrix Barna , Péter Könczöl , Csaba Bankó , Zsolt Bacsó , Sándor Kéki , Gaspar Banfalvi , Gábor Szemán-Nagy
Department of Applied Chemistry, Faculty of Science, University of Debrecen, 4010, Hungary
Department of Biotechnology and Microbiology, Faculty of Science, University of Debrecen, 4010, Hungary
University of Debrecen, Medical and Health Science Center, Faculty of Medicine, Department of Biophysics and Cell Biology, 4010, Hungary
A R T I C L E I N F O
Keywords:
Flu o res cence imag ing Sol va tochromism Vi tal stain ing Iso cyanide MI CAN
A B S T R A C T
Flu o res cence time-lapse mi croscopy is in con nec tion with the in va sive prop er ties of u o rochrome ap plied, and with the tox i c ity of the ex ci ta tion en ergy and wave length of the dye it self. Ex per i ments with the newly syn the ‐ sized u o res cent dye 1-N-methy lamino-5-iso cyanon aph tha lene (MI CAN) served to test its cy to tox i c ity on hu ‐ man Ha CaT ker atinocyte cell cul tures. Ex per i ments re lated to stain ing ca pa bil ity were per formed with paraformalde hyde (PFA) xed cells and ob served with u o res cence mi cro scope. It was as sumed that the u o ‐ rophore 1-amino-5-iso cyanon aph tha lene (ICAN) and es pe cially its N-methy lamino de riv a tive MI CAN, con tain ‐ ing con densed aro matic rings could serve as a non s e lec tive u o res cent dye ca pa ble to stain cel lu lar struc tures of xed, liv ing, dam aged and dead cells. This no tion was con rmed by the MI CAN stain ing of cy to plas mic pro ‐ teins pri mar ily rough en do plas mic retic u lum (RER), smooth en do plas mic retic u lum (SEM) and less ef ciently nu clear pro teins sug gest ing the in volve ment of stain ing of sub cel lu lar struc tures in volved in pro tein syn the sis.
MI CAN was not only well tol er ated by liv ing cells but turned out to be a strong het e rochro matin and RER stain ‐ ing agent. This led to the de vel op ment of a MI CAN stain ing pro to col for na tive and liv ing sam ples. Rel a tive to other u o res cent dyes, MI CAN is not only use ful but also cost-ef fec tive. Tox i col ogy tests were per formed us ing 30, 10, 5, 0.5 μg/ml MI CAN con cen tra tions. Time-lapse videomi croscopy at near-in frared (NIR) il lu mi na tion has been used for the ex am i na tion of MI CAN ef fect on cell di vi sion. It was found that MI CAN as a vi tal stain had no sig nif i cant harm ful ef fect on Ha CaT cells. MI CAN turned out to be a non-toxic, highly quan tum-ef cient vi tal stain with min i mal, or no pho to bleach ing, and can be ap plied to co-stain with pro pid ium-io dide due the strong spec tral sep a ra tion.
1. Introduction
The syn the sis of an ef fec tive sol va tochromic u o rophore fam ily was de vel oped based on the ba sic com pound 1-amino-5-iso cyanon aph tha ‐ lene (ICAN) and its de riv a tive 1-N-methy lamino-5-iso cyanon aph tha ‐ lene (MI CAN) (Racz et al., 2014). MI CAN was cho sen over other de riv ‐ a tives be cause of its low re ac tiv ity rel a tive to other ICAN mem bers of this u o rophore fam ily. The slow me tab o lism of MI CAN in eu kary otic cells is ac counted for by the pres ence of the methy lamino group, that pro vides higher sta bil ity to per form long-term ex per i ments ver sus other de riv a tives of ICAN. As none of the cell stain ing meth ods is per fect, there is a grow ing in ter est in new u o res cent sub stances that are taken
up by cells with out dam ag ing them. This work deals: a) with the up ‐ take of MI CAN by the ex tra cel lu lar ma trix, of Ha CaT cells, b) de ter ‐ mines the low est toxic con cen tra tion where cells can still di vide with ‐ out de tectable signs of apop to sis or necro sis and c) the emit tance of suf cient u o res cence sig nals for the de tec tion of the in ner cell struc ‐ ture.
2. Materials and methods
2.1. Synthesis of 1- N- methylamino- 5- isocyanonaphthalene (MICAN) A 250 ml round-bot tomed ask con tain ing 1-amino-5-iso cyanon aph ‐ tha lene (1.00 g, 5.94 mmol), potas sium hy drox ide (0.670 g, 11.9 mmol)
Correspondence to: S. Kéki, University of Debrecen, Department of Applied Chemistry, Hungary.
Correspondence to: G. Banfalvi, University of Debrecen, Department of Biotechnology and Microbiology, Life Sciences Building 1.111, 1 Egyetem Square, Debrecen 4010, Hungary.
Email addresses: keki. sandor@ science. unideb. hu (S. Kéki); gaspar. banfalvi@ gmail. com (G. Banfalvi) ZN and MN contributed equally to this work and are shared rst authors.
https://doi.org/10. 1016/ j. tiv. 2018. 01. 012
Received 25 May 2017; Received in revised form 11 December 2017; Accepted 15 January 2018 Available online xxx
a , 1 a , 1 b a b b c
c a , ⁎ b , ⁎⁎ b
a b c
,
⁎
⁎⁎
1
U N C O R R E C TE D P R O O F
and dry di methyl for mamide (100 ml). The mix ture was stirred with a mag netic bar. Methylio dide (1.11 ml, 17.8 mmol) was added to the so ‐ lu tion, then the ask was ushed with ar gon and sealed with a rub ber sep tum. The re ac tion mix ture was stirred at room tem per a ture in the dark to pro tect it from light. Af ter 2 days 200 ml meth yl ene chlo ride and 5% am mo nia so lu tion was added, and the so lu tion was ex tracted 5 times with wa ter, then the or ganic phase was dried over an hy drous mag ne sium sul fate. The sol vent was re moved in a ro tary evap o ra tor and the residue was pu ri ed on a nor mal-phase sil ica gel lled col umn, us ing meth yl ene chlo ride: hexane (1:1) as elu ent. 1-N-methy lamino-5- iso cyanon aph tha lene (MI CAN) was ob tained as yel low crys tals (401 mg, 37% yield).
ESI-MS: m/z was mea sured to be 205.073 for [(C H N ) + Na] , ver sus the the o ret i cal value of 205.074.
2.2. NMR spectra
The H NMR and C NMR spec tra were mea sured at:
H NMR (360 MHz, CDCl ) δ = 7.83 (d, J = 8.5 Hz, 1H), 7.65–7.44 (m, 3H), 7.35 (t, J = 8.0 Hz, 1H), 6.67 (s, 1H), 4.52 (s, 1H), 3.02 (s, 3H) ppm.
C NMR (91 MHz, CDCl ) δ = 166.74 (C ), 144.98 (C ), 129.10 (C ), 124.58 (C ), 123.65 (C ), 123.36 (C ), 121.82 (C ), 111.64 (C ), 105.11 (C ), 30.99 (C ) ppm. Sup port ing in for ma tion as Figs. S1, S2.
2.3. UV–visible spectroscopy
The UV–vis i ble spec tra were recorded on an Ag i lent Cary 60 spec ‐ tropho tome ter (Ag i lent, Santa Clara, CA, USA) in a quartz cu vette of 1.00 cm op ti cal length. 3.00 cm so lu tion was pre pared for each sam ple.
2.4. Fluorescence measurements
Steady-state u o res cence mea sure ments were car ried out us ing a Jasco FP-8200 u o res cence spec tropho tome ter equipped with a Xe lamp light source. The ex ci ta tion and emis sion spec tra were recorded at 20 °C, us ing 2.5 nm ex ci ta tion, 5.0 nm emis sion band width, and 200 nm/ min scan ning speed. Flu o res cence quan tum yields were cal cu ‐ lated by us ing qui nine-sul fate in 0.1 mol/ L sul fu ric acid as the ref er ‐ ence ab solute quan tum ef ciency (Φ = 55%).
For UV–vis i ble and u o res cence mea sure ments the in ves ti gated com pounds were dis solved in ace toni trile at a con cen tra tion of 1.2 mM and were di luted to 2.4 × 10 M and 4.7 × 10 M, re spec tively in the sol vents of in ter est. The spec tra were processed us ing Spekwin32 soft ‐ ware (Menges, 2015).
2.5. Human cell lines
The Ha CaT cell line was de rived from hu man skin, the cells spon ta ‐ neously trans formed in vitro dur ing long time in cu ba tion (Boukamp et al., 1988, 1990). The hu man choroidal melanoma cell line OCM-1 cell line was ob tained from the Re search Cen ter of Mol e c u lar Med i cine, de ‐ scribed as an ane u ploid, near-tetraploid cell line (Kemeny-Beke et al., 2006). Hu man lim bal (HuLi) cell line was es tab lished by Turani et al.
(2014). Cells were cul tured in RPMI-1640 medium (Sigma-Aldrich, Bu ‐ dapest, Hun gary) con tain ing 10% fe tal bovine serum (FBS, Hy clon, Lo ‐ gan, UT) and 1% an tibi otic-an timy cotic mix (Peni cillin-Strep to mycin- Neomycin).
2.6. Fluorescent dyes
Pro pid ium Io dide (P4864, Sigma-Aldrich) has an ex ci ta tion max i ‐ mum of 535 nm and emis sion max i mum of 617 nm. Pro pid ium io dide
(PI) binds to DNA by in ter ca lat ing be tween the bases, with lit tle or no se quence pref er ence, and with a sto i chiom e try of one dye mol e cule per 4–5 base pairs of DNA.
Rho damine B (83689, Sigma-Aldrich). The ex ci ta tion max i mum was found at 554 nm, and emis sion max i mum at 576 nm. Rho damine B sim ‐ i larly to MI CAN is a non spe ci c pro tein dye. Rho damine B at 25 μg/ ml and above sig nif i cantly de creased the num ber of KD brob last cells af ‐ ter a 72 h cul ture (Kaji et al., 1991).
2.7. Fixation and staining protocols
The cells were cul tured on mi cro scope slides and xed with 4% PFA for 10 min, and washed for 30 min in PBS, then de hy drated at 200 °C (in a hot air ster il izer) for 15 min. The stain ing was per formed in a MI ‐ CAN-DMSO so lu tion at 2.4 μg/ ml MI CAN con cen tra tion. From the ini ‐ tial 0.5 mg/ ml stock so lu tion of MI CAN, 400 μl was com pleted to 1 ml with DMSO. From this com pleted so lu tion 36 μl was taken and di luted with dis tilled wa ter to 3 ml. This di luted MI CAN so lu tion (2.4 μg/ ml) was used for the stain ing. Al though, af ter the stain ing, the MI CAN re ‐ mained sta ble in the sam ple, but needed ad di tional 30 min for bind ing.
The non po lar DMSO-MI CAN treated sam ples were sta ble for weeks with a grad ual in crease of the u o res cent back ground.
2.8. Incubation of cell culture in the presence of MICAN
Ha CaT cells in glass bot tom dishes placed in a car bon diox ide in cu ‐ ba tor (SANYO MCO18-AC) at 37 °C and 5% CO were grown in RPMI- 1640 medium con tain ing dif fer ent con cen tra tions of MI CAN (0.5, 5, 10, and 30 μg/ ml) in DMSO: nal vol ume 1% (v/ v). The medium was re moved af ter 24 h in cu ba tion and washed three times with PBS. Then the sam ples were dried and xed with 4% PFA, then sub jected to cross stain ing. Ha CaT cells for LSC were in cu bated in open μ-Slide (cham ‐ bered cov er slip) with 4 wells.
2.9. Cross staining
i) MI CAN and Rho damine B. For pre xed cell stain ing, 0.05 mg/ ml Rho damine B and 2.4 μg/ ml aque ous so lu tion of MI CAN in 4:6 ra tio were mixed, and used 10 μl per slide.
ii) MI CAN and PI cross stain ing. For pre xed cell stain ing, 0.05 mg/ ml PI and 2.4 μg/ ml aque ous so lu tion of the MI CAN in 3:7 ra tio were mixed, and used 10 μl per slide.
2.10. Time- lapse scanning (TLS) microscopy and image analysis
A de tailed de scrip tion of time-lapse mi croscopy was given ear lier (Nagy et al., 2013, 2014a, 2014b). The sys tem of TLS mi croscopy con ‐ sists of: Four in verse mi cro scopes (Olym pus Tokyo) in stalled in side the CO in cu ba tor (SANYO MCO18-AC). Mi cro scopes were mod i ed for in ‐ verted us age as re volver tur rets were trans ferred to the place of the orig i nal il lu mi na tion. Diodes emit ting light at 940 nm (LED: 5 mm in di am e ter; 1.2 V, 50 mA, dri ven at 5 V us ing a se r ial 82 Ohm re sis tor) were used to il lu mi nate cells while min i miz ing heat and pho to tox i c ity.
The 940 nm wave length turned out to be an ac cept able com pro mise to avoid pho to tox i c ity and to main tain suf cient res o lu tion power. Plan achro matic ob jec tives (×10: 0.25 NA) (Carl Zeiss Jena, Ger many)) were used to en able a broad eld of view to be im aged. Cus tom-mod i ed 2 megapixel UVC cam era (Asus Com puter In ter na tional, Fre mont, CA, USA) boards with USB 2.0 con nec tion served im age de tec tion. Cell cul ‐ tures in glass bot tom dish were placed un der in verse mi cro scopes, and pho tographs of cells were taken every minute. Ten im ages were col ‐ lected, each within a 5 s in ter val and av er aged to min i mize noise. The
12 10 2 +
1 13
1 3
13 3 NC 9,10
2 4 1,5 8 7 6
3 CH3
3
n
−5 −6
2
2
U N C O R R E C TE D P R O O F
col lec tion of im ages within 5 s in ter vals was re garded as op ti mal time res o lu tion.
2.11. Image analysis
Na tional Health In sti tute's Im ageJ soft ware was used to an a lyze the im age se quences of the time-lapse videomi croscopy (https: // ji. sc).
The im age an a lyz ing method in cluded:
a) Im age restora tion and noise re duc tion:
- RGB im age se quences were con verted to 8-bit grayscale im ages.
De ick er ing by us ing a se quence stack his togram served to avoid tran sient bright ness changes be tween sep a rate frames. Con trast and bright ness were equal ized based on the stack (se quence) his ‐ togram at 0.4% of the pix els sat u rated.
- Fast Fourier-trans for ma tion and back ground sub trac tion: The back ground was re duced by band pass l ter ing to ex clude large struc tures down to 40 pix els and l ter ing small struc tures up to 3 pix els in size, and back ground ex trac tion process us ing a rolling ball at a ra dius of 50 pix els.
b) Seg men ta tion: Im age se quences were thresh olded us ing a stack his ‐ togram by keep ing the in for ma tion con tain ing el e ments of the im ‐ age se quence as fore ground, and throw ing the re dun dant pix els away by thresh old ing them into the back ground.
c) Mea sure ment: Thresh old ing re sults in a bi nary im age were used for graph i cal rep re sen ta tion.
2.12. Fluorescence microscopy
The Carl Zeiss Pho tomi cro scope II was used, with UV il lu mi nat ing light pro duced by the XBO (150 W/ 1) va por lamp. Fil ters are widely used for DAPI ex ci ta tion, BP (band pass) at 395–440 nm, emis sion l ter LP (long pass) at 470 nm and FITC ex ci ta tion (BP 485/ 20, emis sion LP 515 nm) l ter. Fil ters used for pro pid ium io dide (PI) stain ing con sisted of 510–560 nm ex ci ta tion l ter, and LP 590 nm emis sion l ter. Fil ters used for PI-MI CAN cross-stain ing were the BP l ter at 395–440 nm ex ‐ ci ta tion and LP l ter at 515 nm emis sion. The ob jec tives of the mi cro ‐ scope were: neo uar 100/ 1.30 oil im mer sion, neo uar 40/ 0.75 and PLAN APO 63/ 1.4 oil im mer sion ob jec tives.
2.13. Laser- scanning imaging cytometry
Laser-scan ning mi croscopy was used for u o res cent live-cell imag ‐ ing with par al lel u o res cent de tec tion of cell death. The iCys imag ing sys tem is based on an Olym pus IX-71 in verted mi cro scope equipped with four lasers, two pho to di odes for chro matic ab sorbance de tec tion and four pho to mul ti pli ers for u o res cence de tec tion. Scan ning of the sam ples by laser beams took place point by point. Dur ing the scan, a xed o set from the bot tom of the cov er slip was ap plied, which placed the fo cus to the mid dle plane of the cells. User-de ned ar eas in the spec i men with op ti mal cell den sity were marked as re gions of in ter est (ROIs) and scanned in an au to mated man ner. For video record ing, each ROI was set to one scan ning eld (1024 × 768 pix els) and scanned mul ‐ ti ple con sec u tive times by fo cused laser beams via an os cil lat ing mir ror in the y-di rec tion and by the mo tor ized stage in the x-di rec tion with a step size of 0.5 μm. The aris ing u o res cence sig nals were col lected by a 40× LWD (NA 0.6) ob jec tive into two de tec tion chan nels. PMT set tings for the green chan nel were 36 V, the gain was 100% and the o set was
−0.35 V. In the long red chan nel, PMT was set to 40 V, the gain to 100% and the o set to −0.15 V. PMT sig nals were con verted into 14- bit pixel high-res o lu tion im ages. For LSC imag ing, a slide-based laser- scan ning iCys Re search Imag ing Cy tome ter (Thor labs Imag ing Sys tems, Ster ling, VA) was used. Room tem per a ture was used for the in duc tion
of slow cel lu lar dam age to es ti mate the ap plic a bil ity of par al lel vi a bil ‐ ity test. MI CAN was added to the cells in 0.5 μg/ ml nal con cen tra tion and cell vi a bil ity was tested by pro pid ium io dide (PI, 5 μg/ ml) Im ages were made in eighty con sec u tive scan ning cy cles in 220 s in ter vals (3 min 40 s) cov er ing the time pe riod of 5 h. The movie was pro duced us ing u o res cence still im ages play ing at an ap prox i mated 3000 times faster than the record ing. MI CAN was ex cited at 405 nm by a vi o let solid-state laser (0.71 mW at tur ret), while PI was ex cited at 488 nm by a blue diode laser (tur ret in ten sity: 0.68 mW). Flu o res cence emis sion was de tected with a band-pass l ter at 530 ± 30 nm and with a long- pass l ter above 650 nm, re spec tively. Mean while, IR-TLS and tox i col ‐ ogy tests were per formed to prove that Ha CaT cells tol er ated much higher MI CAN con cen tra tion (5 μg/ ml) as well (Nagy et al., 2017).
3. Results and discussion 3.1. Spectral properties of MICAN
The scope of the cur rent work was to in ves ti gate MI CAN, the N- methy lamino de riv a tive of u o rophore 1-amino-5-iso cyanon aph tha lene (ICAN). MI CAN turned out to be an un spe ci c sol va tochromic dye. MI ‐ CAN con tains an elec tron ac cept ing and an elec tron do nat ing group.
The care ful se lec tion of these groups was im por tant dur ing its syn the sis since the charge dis tri b u tion be tween them gave rise to unique u o res ‐ cence prop er ties and also ex tended the scope of ap plic a bil ity un der vi ‐ tal and non vi tal con di tions. Dur ing the de sign of the u o rophore, two im por tant as pects have been taken into con sid er a tion:
1. The dye con tains a free hy dro gen (H) atom co va lently bound to a highly elec troneg a tive atom such as ni tro gen ( NH) or oxy gen ( OH) that per ceives the elec tro sta tic eld of an other elec troneg a tive atom and in ter acts with an other or ganic mol e cule ca pa ble of form ‐ ing hy dro gen bonds.
2. The elec tron donor ca pa bil ity of the amino group of ICAN has been en hanced through alky la tion which in turn re sulted in the im prove ‐ ment of op ti cal prop er ties.
Af ter these re quire ments were met, and 1-N-methy lamino-5-iso ‐ cyanon aph tha lene (MI CAN) was syn the sized, rst the op ti cal prop er ‐ ties were in ves ti gated. Se lected UV–vis i ble and u o res cence spec tra of MI CAN are pre sented in Fig. 1. Ad di tion ally, the op ti cal prop er ties are sum ma rized in Table 1, whereas all other spec tra are pre sented in the sup port ing in for ma tion (Figs. S3–S4).
Fig. 1 shows that MI CAN has a low en ergy ab sorp tion band with a max i mum near 365 nm close to the emis sion max i mum of a reg u lar Hg-
Fig. 1. Nor mal ized ab sorp tion and emis sion spec tra of MI CAN. a) Ab sorp tion spec ‐ trum of MI CAN. Emis sion spec tra of MI CAN: b) in hexane, c) in THF and d) in wa ter, re ‐ spec tively. e) In set shows the struc ture of MI CAN. All spec tra were recorded at 20 °C and at con cen tra tion of 4.7 × 10 −6 M.
U N C O R R E C TE D P R O O F
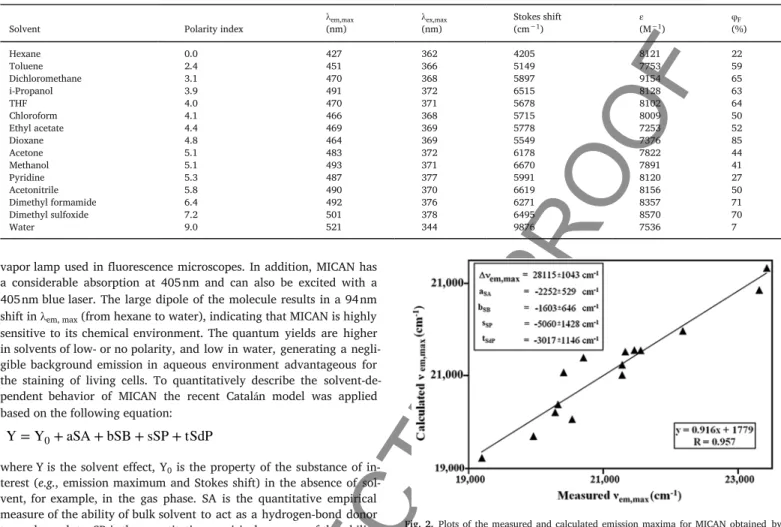
Table 1
Emis sion (λ ), ex ci ta tion (λ ) max ima, Stokes shift (Δν), mo lar ex tinc tion co ef cient (ε) and quan tum yield (Φ) of MI CAN in dif fer ent sol vents.
Solvent Polarity index λ
(nm) λ
(nm) Stokes shift
(cm ) ε
(M ) φ
(%)
Hexane 0.0 427 362 4205 8121 22
Toluene 2.4 451 366 5149 7753 59
Dichloromethane 3.1 470 368 5897 9154 65
i-Propanol 3.9 491 372 6515 8128 63
THF 4.0 470 371 5678 8102 64
Chloroform 4.1 466 368 5715 8009 50
Ethyl acetate 4.4 469 369 5778 7253 52
Dioxane 4.8 464 369 5549 7376 85
Acetone 5.1 483 372 6178 7822 44
Methanol 5.1 493 371 6670 7891 41
Pyridine 5.3 487 377 5991 8120 27
Acetonitrile 5.8 490 370 6619 8156 50
Dimethyl formamide 6.4 492 376 6271 8357 71
Dimethyl sulfoxide 7.2 501 378 6495 8570 70
Water 9.0 521 344 9876 7536 7
va por lamp used in u o res cence mi cro scopes. In ad di tion, MI CAN has a con sid er able ab sorp tion at 405 nm and can also be ex cited with a 405 nm blue laser. The large di pole of the mol e cule re sults in a 94 nm shift in λ (from hexane to wa ter), in di cat ing that MI CAN is highly sen si tive to its chem i cal en vi ron ment. The quan tum yields are higher in sol vents of low- or no po lar ity, and low in wa ter, gen er at ing a neg li ‐ gi ble back ground emis sion in aque ous en vi ron ment ad van ta geous for the stain ing of liv ing cells. To quan ti ta tively de scribe the sol vent-de ‐ pen dent be hav ior of MI CAN the re cent Catalán model was ap plied based on the fol low ing equa tion:
where Y is the sol vent ef fect, Y is the prop erty of the sub stance of in ‐ ter est (e.g., emis sion max i mum and Stokes shift) in the ab sence of sol ‐ vent, for ex am ple, in the gas phase. SA is the quan ti ta tive em pir i cal mea sure of the abil ity of bulk sol vent to act as a hy dro gen-bond donor to wards a solute. SB is the quan ti ta tive em pir i cal mea sure of the abil ity of a bulk sol vent to act as a hy dro gen-bond ac cep tor or elec tron-pair donor to wards a solute, form ing a solute-to-sol vent hy dro gen bond or a sol vent-to-solute co or di na tive bond, re spec tively. SP and SdP are the sol vent po lar iz abil ity and dipo lar pa ra me ters, re spec tively, de ter mined us ing ref er ence dye mol e cules. a, b, s and t are the cor re spond ing co ef ‐
cients and their in clu sion in the equa tion in di cates the de pen dence of the prop erty un der in ves ti ga tion upon the re spec tive sol vent pa ra me ‐ ter.The Catalán co ef cients for the emis sion wavenum ber at the max i ‐ mum ( ) were ob tained by mul ti lin ear re gres sion analy sis and are pre sented in Fig. 2.
The in set of Fig. 2 shows that the po lar ity of the sol vent has the largest ef fect on the sol va tochromic be hav ior. Both the H-bond do nat ‐ ing and ac cept ing ca pa bil i ties of MI CAN are pro nounced (large cap i tal A and B pa ra me ters) be cause of the pres ence of the free imino ( NH) hy dro gen (H-bond donor) and the iso cyanide (isoni trile N C group) as (H-bond ac cep tor). The strong ten dency of MI CAN to form H- bonds has im pli ca tions with re spect to its bi o log i cal ap pli ca tions.
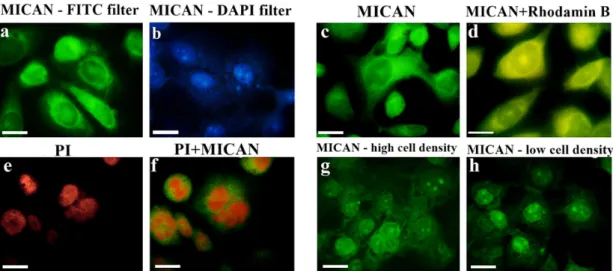
3.2. Staining of HaCaT cells with MICAN
Fig. 3. demon strates the stain ing pat tern of MI CAN un der dif fer ent stain ing con di tions. To test the u o res cent prop er ties of MI CAN, FITC and DAPI l ters were used for u o res cence mi croscopy. Mi cro scopic pho tos were taken with DAPI l ter to prove that MI CAN as a u o res ‐ cent dye acted sim i larly to DAPI and could be a use ful stain for u o res
Fig. 2. Plots of the mea sured and cal cu lated emis sion max ima for MI CAN ob tained by the Catalán equa tion. In set: sol vent-in de pen dent cor re la tion co ef cients a , b , s and t of the Catalán pa ra me ters SA, SB, SP and SdP, re spec tively. Solute prop erty of the ref ‐ er ence sys tem ( ) , ob tained by mul ti re gres sion analy sis. The cor re spond ing SA, SB, SP and SdP val ues of the sol vents have been de scribed (Catalán, 2009).
cence mi croscopy ei ther with FITC (Fig. 3a) or DAPI (Fig. 3b) l ters.
Higher ac cu mu la tion of the u o res cent MI CAN was ob served around the outer sur face of the cell mem brane and mod er ate stain ing of the nu cleus, but not to its dou ble mem brane, point ing to the bind ing of MI ‐ CAN to pro teins (Rácz et al., 2013).
3.3. Cross staining of MICAN with rhodamine B
To de ter mine the main cel lu lar tar get of MI CAN, cross stain ing was per formed with and with out the xan thene dye rho damine B. The ex ci ‐ ta tion max i mum of rho damine B is 554 nm, and its emis sion max i mum 576 nm. Rho damine B has been listed as a spe ci c stain for corni ca ‐ tion (Liisberg, 1968) and used for the iden ti ca tion of ker atin (Delescluse et al., 1976; Pinkus et al., 1980). Fig. 3c shows the stain ing of Ha CaT ker atinocytes with MI CAN un der the stain ing con di tions of rho damine B. Fig. 3d com prises the co-stain ing of MI CAN and rho ‐ damine B. Due to the high re ac tiv ity of rho damine com pounds, rho ‐ damine B re acts with spe ci c groups of pro teins e.g. sulfhydryl groups of amino acids, likely to im pact thiol-disul de ex change mech a nisms of re dox ac tive thiol groups in side cells. The sim i lar ity be tween the stain ‐ ing of MI CAN and rho damine B in di cated that MI CAN stained cells also in a non s e lec tive man ner.
em ex F
em,max ex,max
−1 −1 F
em, max
0
em,max
SA SB SP SdP
em,max 0
U N C O R R E C TE D P R O O F
Fig. 3. Stain ing and co-stain ing of Ha CaT cells with MI CAN un der dif fer ent con di tions. Cells were xed with 4% PFA for 10 min, de hy drated then stained with MI CAN as de scribed in the Meth ods. Flu o res cence mi croscopy with a) FITC l ter, b) with DAPI l ter. Bars, 50 μm each at 100× mag ni ca tion. c) Stain ing of cells with MI CAN, and d) com bined rho damin B and MI CAN stain ing. Bars 50 μm each, at 63× mag ni ca tion. e) PI stain ing (red), f) PI stain ing fol lowed by ad di tional stain ing with MI CAN (ex ter nal green color). Bars 50 μm each, 63×. g) In situ mi cro scopic ex am i na tion of Ha CaT cells with MI CAN, co-in cu bated for 24 h and xed with 4% PFA for 10 min. Flu o res cence mi croscopy of MI CAN with g) FITC l ter, h) with DAPI
l ter. Bars, 50 μm each at 100× mag ni ca tion. (For in ter pre ta tion of the ref er ences to color in this g ure leg end, the reader is re ferred to the web ver sion of this ar ti cle.)
3.4. Consecutive staining of propidium iodide and MICAN
Ad di tive stain ing of Ha CaT cells was per formed with pro pid ium io ‐ dide (PI) fol lowed by MI CAN ex po sure. PI is a se lec tive nu clear dye. PI ex ci ta tion max i mum was found at 535 nm, and the emis sion max i mum at 617 nm. We used FITC long pass l ter to see the u o res cent emis ‐ sions of these dyes. The idea of co-stain ing of MI CAN with PI was based on the as sump tion that MI CAN is com pat i ble with nonacidic cell dyes, due to the in sta bil ity of its iso cyanide func tional group in acidic medium. Fig. 3e shows the stain ing of paraformalde hyde (PFA) pre ‐
xed Ha CaT cells with PI alone and af ter ad di tional stain ing with MI ‐ CAN (Fig. 3f). Post-stain ing proved the a n ity of MI CAN to pro teins lo cated in sub cel lar struc tures around the nu cleus such as rough and smooth en do plas mic retic u lum (RER, and SER). This com bi na tion of stain ing also re vealed that MI CAN was bound poorly to the nu clear ma trix since it was likely to be ex cluded by the nu clear en ve lope.
3.5. MICAN staining at di erent densities of HaCaT cells
When live cells were co-in cu bated with the u o res cent MI CAN, the dye was found to pen e trate into cells, un less they were pre pared as PFA xed de na tured sam ples. It was found that MI CAN is bind ing to pro teins pre sent in the cell cul ture medium, pri mar ily to BSA (Rácz et al., 2013). Due to the non po lar char ac ter of MI CAN the non-co va lent hy dro gen bonded pro tein-MI CAN com plex could pen e trate into cells by vesic u lar trans port. Such adduct (com plex) for ma tion for ICAN de riv a
tives was pre vi ously proven by u o res cence spec troscopy (Nagy et al., 2016). The pro cess ing of u o res cent im ages re vealed sig nif i cant dif fer ‐ ences be tween stained and co in cu bated cells. The PFA xed, and MI ‐ CAN stained sam ples showed char ac ter is tic bind ing to cy to plas mic pro ‐ teins pri mar ily to RER and DER and a lower bind ing to spots of nu clear pro teins. It de serves no tice that in side the nu cleus, the het e rochro matin dy nam ics gen er ates com pact spots with high u o res cent in ten sity (Ueda et al., 2014; Wreggett et al., 1994; Ishov et al., 2004). MI CAN stain ing fa vored by non po lar con di tions in side the cells could be the rea son why con cen trated spots in the nu cleus be came vis i ble. Methy ‐ lated hi s tones con tribut ing to the non po lar char ac ter of nu clear struc ‐ tures could ex plain the se lec tiv ity of MI CAN bind ing to het e rochro ‐ matin struc tures in the nu cleus of liv ing cells. Liv ing Ha CaT cells sub ‐ jected to MI CAN stain ing show the in tru sion of dye into cells (Fig.
3g,h).
3.6. Uptake of MICAN by cells
The aque ous en vi ron ment for MI CAN was pro vided by the pres ence of DMSO, which un der cell cul ture con di tions was tol er ated up to 1%
(v/ v). MI CAN binds rst to the pro teins of the medium pri mar ily to BSA (Nagy et al., 2016). Cells take up la beled pro teins with en do so mal or vesic u lar in ges tion, trans port and re lease them into the lu men of RER (Cooper, 2000; Pfe er and Rothman, 1987; Le Borgne and Ho ack, 1998). The MI CAN-pro tein bind ing is ben e cial in the sense that the up take of MI CAN is al le vi ated by DMSO con tain ing medium, de spite the poor sol u bil ity of MI CAN in wa ter (Table 2).
Table 2
Ha CaT cell mono layer con u ency changes upon DMSO and MI CAN treat ment.
Time-lapse microscopy DMSO v/v % MICAN μg/ml Con uence (%)
Initial Relapsed to Final
1 0 0 38 37.9 100
2 1 0 37 36.8 79.9
3 1 0,5 40 26.1 66.6
4 1 5 40 16.0 65.2
5 1 10 40 23.2 66.0
6 1 30 40 20.7 0
U N C O R R E C TE D P R O O F
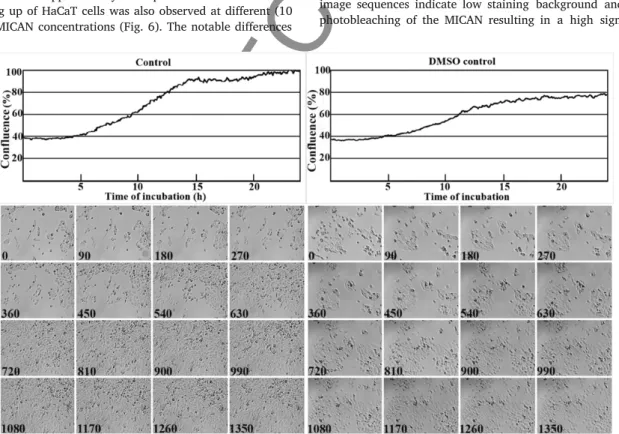
3.7. Toxicity of MICAN to HaCaT cell culture
Ex per i ments were un der taken us ing the Ha CaT cell cul ture at dif fer ‐ ent con cen tra tions of MI CAN with an ini tial con u ence of nearly 40%.
Four MI CAN con cen tra tions were tested: 0.5, 5, 10 and 30 μg/ ml. The mon i tor ing of growth of mono layer cul tures in the pres ence of MI CAN lasted for 24 h. Al ter ations in the growth of the mono layer were fol ‐ lowed by time-lapse mi cropho tog ra phy and im age analy sis (Fig. 4). Ex ‐ per i ments were per formed in glass bot tom dishes.
Cor re spond ing to ex pec ta tions, con trol cells grew faster and reached con u ency in 24 h, whereas the lower growth rate in the pres ‐ ence of DMSO re sulted in a plateau phase at 80% con u ence (Fig. 4).
This nd ing is in agree ment with the ob ser va tions of oth ers (Timm et al., 2013; Forman et al., 1999; Hollebeeck et al., 2011) who found that DMSO above 1% re duced the read out pa ra me ters in dif fer ent cell types, thus the DMSO sol vent con cen tra tion was kept con stant in the se r ial di lu tion of MI CAN in ves ti ga tions.
Rel a tive to the two con trol ex per i ments in the ab sence and pres ence of 1% DMSO, treat ment with MI CAN con tain ing 1% DMSO mod er ately im pacted cell growth and the for ma tion of the mono layer. In each used MI CAN con cen tra tion cell clus ters shrank and in di vid ual cells be came rounded up, but kept their vi a bil ity and in creas ingly more time was needed for cell cul tures to con tinue growth at el e vated MI CAN con cen ‐ tra tions. The growth curves in (Fig. 5) at 0.5 and 5 μg/ml MI CAN con ‐ cen tra tions clearly show an ini tial de crease in the mono layer sur face area, fol lowed by the re-growth of sur face area cov ered by the cells (Fig. 5). Typ i cally the shape of 60–80% of Ha CaT cells was im pacted by MI CAN in the ex am ined mi cro scopic eld. Sim i lar ob ser va tions were made with hu man OCM-1 and HuLi cells (not shown). That the vi a bil ity of Ha CaT cells in the pres ence of 0.5 μg/ ml MI CAN is not im ‐ pacted, is shown in the sup ple men tary video pre sen ta tion.
The round ing up of Ha CaT cells was also ob served at dif fer ent (10 and 30 μg/ ml) MI CAN con cen tra tions (Fig. 6). The no table dif fer ences
be tween the pan els of growth curves at 10 μg/ ml (Fig. 6 up per left curve) and 30 μg/ ml MI CAN con cen tra tions (Fig. 6 up per right curve) in di cate that the re cov ery of ini tial block ade of cell growth up to 10 μg/ ml is con trasted by a tem po rary and vir tual re growth that is fol ‐ lowed by the com plete break down of pro lif er a tion at 30 μg/ ml MI CAN con cen tra tion. De tails are given in Video S1.
The up per left growth curve in Fig. 6 also shows that at 10 μg/ ml MI CAN con cen tra tion the curve can be di vided into 3 phases: Tem po ‐ rary re gres sion from 40% to 21% con u ence (0–2 h). Re cov ery of cell growth (be tween 3 and 10 h). Sta tion ary phase of cell growth (af ter 12 h). Time-lapse mi croscopy (Fig. 6 left bot tom pan els): even dis tri b u ‐ tion of in di vid ual cells. At 30 μg/ ml MI CAN con cen tra tion (in Fig. 6) the growth curve can sub di vided to: Re gres sion of growth (0–2 h), b) Tem po rary re growth (2–8 h), c) Death phase (8–15 h), d) Com plete loss of cell growth (af ter 15 h). Time-lapse mi croscopy at 30 μg/ ml MI CAN con cen tra tion (Fig. 6 bot tom right pan els) clearly shows the ag gre ga ‐ tion of dead cells. Black num ber at the bot tom of each panel shows the time of pho tomi crog ra phy.
The com plete ces sa tion of cell growth at the high est MI CAN con ‐ cen tra tion (30 μg/ ml) could be ac counted for by the pro tracted pen e ‐ tra tion of DMSO-MI CAN com plex into the cells. A fur ther con clu sion that could be drawn from the pen e tra tion of the DMSO-dye com plex was that the in hi bi tion of cell growth was mod er ately re duced by the pres ence of DMSO alone could have been ad di tive in the pres ence of MI CAN. This ob ser va tion is sup ported by the data show ing the dras tic re lapse from the ini tial 40% to 20% con u ency.
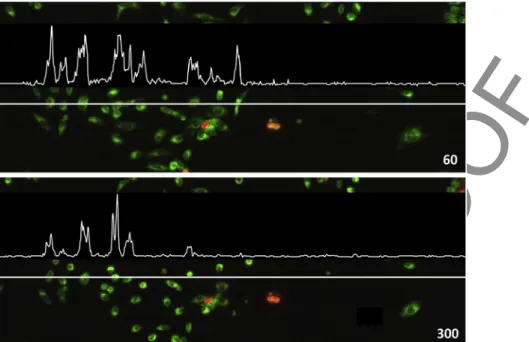
Time-lapse laser-scan ning mi croscopy at low ex ci ta tion en ergy was used to col lect 80 im ages within a 5 hour pe riod as shown on Fig. 7.
and Sup ple men tary Video S2. The pro gres sion of slow cel lu lar death was fol lowed by par al lel PI stain ing. No cross-talk be tween the two u ‐ o rophore was ob served dur ing the ex per i ment. Analy sis of the ac quired im age se quences in di cate low stain ing back ground and in signif i cant pho to bleach ing of the MI CAN re sult ing in a high sig nal/ noise ra tio
Fig. 4. Mon i tor ing Ha CaT cell growth in the ab sence and pres ence of DMSO by time-lapse mi croscopy. Time-lapse mi croscopy in CO in cu ba tor last ing for 24 h was per formed as de ‐ scribed in the “Ma te ri als and meth ods” sec tion. Up per left growth curve shows the in creas ing con u ency in the ab sence of DMSO. Up per right panel: growth curve in the pres ence of 1%
DMSO. Lower left pan els: Time-lapse light mi croscopy in the ab sence of DMSO and lower right pan els: mi cropho tog ra phy in the pres ence of 1% DMSO. The black num ber in each panel gives the time of mi croscopy in min.
2
U N C O R R E C TE D P R O O F
Fig. 5. Growth of Ha CaT in the pres ence of low con cen tra tion of MI CAN. Cell growth (up per left panel) in Ha CaT cell cul ture con tain ing 1% DMSO and 0.5 μg/ ml MI CAN. Growth curve (up per right curve) and time-lapse mi croscopy in 1% DMSO at 5 μg/ ml MI CAN con cen tra tion. Black num bers in the lower pan els in di cate the time when the pho tographs were taken.
Fig. 6. Growth in hi bi tion of Ha CaT cells by MI CAN at higher con cen tra tions. The same ex per i ment was car ried out as un der this g ure at 10 and 30 μg/ ml MI CAN con cen tra tions.
within the ex per i men tal in ter val as shown on the lin ear plots in Fig. 8.
No pho to tox i c ity was ob served dur ing the ex per i ment.
Im ages of Figs. 7 and 8 taken from con sec u tive scan ning cy cles in 220 s in ter vals (3 min 40 s) cov er ing the time pe riod of 5 h did not show any tox i c ity of MI CAN. The video was pro duced us ing u o res cence im ‐ ages vi su al ized 3000 times faster than the record ing (Video S2).
4. Conclusions
The u o rophore MI CAN mol e cule is ap plic a ble in cell stain ing prac ‐ tice both as a non vi tal, and a vi tal dye. MI CAN showed char ac ter is tic bind ing to cy to plas mic pro teins pri mar ily to RER and DER and a slight se lec tiv ity to spots of pro teins in the nu clear het e rochro matin or NOR re gions. The com pound is well tol er ated by hu man cell cul tures be ‐ tween 0.5 and 10 μg/ ml con cen tra tions. Fur ther more, there is suf cient
U N C O R R E C TE D P R O O F
Fig. 7. Flu o res cent time-lapse im age se quence of tem per a ture-in duced death of Ha Cat cells. Cells were kept at room tem per a ture dur ing the 5 h pe riod of time-lapse imag ing. Laser scan ‐ ning mi croscopy of Ha CaT cells in the pres ence of 0.5 μg/ ml MICA con cen tra tion. Live cells were seen in green and cell death tested by pro pid ium io dide (PI, 5 μg/ ml) at room tem per a ‐ ture for 300 min. MI CAN and PI u o res cent dyes were ap plied si mul ta ne ously. MI CAN was ex cited at 405 nm by a vi o let solid-state laser (0.71 mW at tur ret), while PI was ex cited at 488 nm by a blue diode laser (tur ret in ten sity: 0.68 mW). Flu o res cence emis sion was de tected with a band-pass l ter at 530 ± 30 nm and with a long-pass l ter above 650 nm, re spec ‐ tively. De tails of LSC were de scribed in the Ma te ri als and meth ods. (For in ter pre ta tion of the ref er ences to color in this g ure leg end, the reader is re ferred to the web ver sion of this ar ti ‐ cle.)
in ten sity for u o res cence imag ing in the non toxic range be tween 0.5 and 10 μg/ ml con cen tra tions. The func tion of the cells is af fected at higher con cen tra tions when MI CAN binds to pro teins of the cell and mod i es their func tion. Vis i ble tor sions in cells were ob served in the 20–30 μg/ ml MI CAN con cen tra tion range. Non spe ci c MI CAN stain ing of cel lu lar pro teins al lowed the long term track ing of sub cel lu lar processes by u o res cent time-lapse mi croscopy. Ac cord ing to u o res ‐ cent time-lapse mi croscopy in ves ti ga tions, MI CAN showed spec tral sep ‐ a ra tion from PI of fer ing a pos si ble co-ap pli ca tion of the two dyes.
Within the 5 h of ex per i ment no pho to bleach ing was ob served. Due to the high quan tum ef ciency of MI CAN, the in ten sity of the ex ci ta tory u o res cent light could be re duced sig nif i cantly, and min i mized the ma ‐ jor prob lem, namely the pho to tox i c ity of time-lapse mi croscopy. Ad ‐ van tages of MI CAN as a “Live-or-Die” dye can be sum ma rized as:
- Min i mal in va sive ness: Low tox i c ity within the ap pli ca tion range - Sta bil ity: Min i mal or neg li gi ble pho to bleach ing
- Ef ciency: High quan tum-ef ciency help ing to re duce pho to tox i c ity due ex ci ta tion
- Af ford able: Lower cost than com mer cial stains - Choice: 8 bright col ors across the spec trum - Non-spe ci c: Stain ing of live and dead cells
- Fix able: No loss of bright ness af ter x a tion
- Ver sa tile: Ap plic a ble both for light and u o res cence mi croscopy - Made by ex perts in dye chem istry in our uni ver sity.
MI CAN the promis ing new u o res cent dye and the rst ap plic a ble de riv a tive of ICAN is un der fur ther in ves ti ga tion in volv ing chem i cal mod i ca tion and bi o log i cal char ac ter i za tion. Also, ap plic a ble con cen ‐ tra tions of MI CAN turned out to be non toxic in vivo, based on pre lim i ‐ nary an i mal ex per i ments car ried out in mice (Nagy et al., un pub lished data).
Sup ple men tary data to this ar ti cle can be found on line at https: //
doi. org/ 10. 1016/ j. tiv. 2018. 01. 012.
Con ict of interest None de clared.
Uncited references Awtar, 1975 Khot et al., 2015 Kubin and Fletcher, 1983
U N C O R R E C TE D P R O O F
Fig. 8. Lin ear plot pro le of u o res cent im ages ac quired at 60 and 300 min. White lines in di cate pix els with green chan nel in ten sity mea sured and rep re sented at the graphs above. (For in ter pre ta tion of the ref er ences to color in this g ure leg end, the reader is re ferred to the web ver sion of this ar ti cle.)
Smith and Crocker, 1988 Acknowledgements
This work was nan cially sup ported by the grants K-116465 and GINOP-2.3.2-15-2016-00041 pro vided by NFKI (Na tional Re search, De ‐ vel op ment and In no va tion Of ce, Hun gary) to SK. This pa per was also sup ported by the János Bolyai Re search Schol ar ship of the Hun gar ian Acad emy of Sci ences to MN.
References
Aw tar, K., 1975. Rapid ow cyto u o ro met ric analy sis of mam malian cell cy cle by pro ‐ pid ium io dide stain ing. J. Cell Biol. 66 (1), 188–193.
Boukamp, P., Petru sevska, R.T., Bre itkreut, D., Hor nung, J., Markham, A., Fusenig, N.E., 1988. Nor mal ker a tiniza tion in a spon ta neously im mor tal ized ane u ploid hu man ker ‐ atinocyte line. J. Cell Biol. 106, 761–771.
Boukamp, P., Stan bridge, E.J., Foo, D.Y., Cerutti, P.A., Fusenig, N.E., 1990. c-Ha-ras onco gene ex pres sion in im mor tal ized hu man ker atinocytes (Ha CaT) al ters growth po ‐ ten tial in vivo but lacks cor re la tion with ma lig nancy. Can cer Res. 50, 2840–2847.
Catalán, J., 2009. To ward a gen er al ized treat ment of the sol vent ef fect based on four em ‐ pir i cal scales: dipo lar ity (sdp, a New Scale), po lar iz abil ity (SP), acid ity (SA), and ba ‐ sic ity (SB) of the medium. J. Phys. Chem. B 113 (17), 5951–5960.
Cooper, G.M., 2000. The Cell: A Molec u lar Approach, 2nd edi tion Sin auer As so ci ates, Sun der land (MA).
De lescluse, C., Fukuyama, K., Ep stein, W.L., 1976. Dibu tyryl cyclic AMP-in duced dif fer ‐ en ti a tion of epi der mal cells in tis sue cul ture. J. In vest. Derm. 66, 8–13.
For man, S., Kás, J., Fini, F., Stein berg, M., Ruml, T., 1999. The ef fect of dif fer ent sol vents on the ATP/ ADP con tent and growth prop er ties of HeLa cells. J. Biochem. Mol. Tox i ‐ col. 13 (1), 11–15.
Holle beeck, S., Raas, T., Piront, N., Schnei der, Y.J., Tou s saint, O., Laron delle, Y., Dur ing, A., 2011. Di methyl sul fox ide (DMSO) at ten u ates the in am ma tory re sponse in the in vitro in testi nal Caco-2 cell model. Tox i col. Lett. 206 (3), 268–275. https: // doi. org/
10. 1016/ j. toxlet. 2011. 08. 010.
Ishov, A.M., Vladimirova, O.V., Maul, G.G., 2004. Het e rochro matin and ND10 are cell-cy ‐ cle reg u lated and phos pho ry la tion-de pen dent al ter nate nu clear sites of the tran scrip ‐ tion re pres sor Daxx and SWI/ SNF pro tein ATRX. J. Cell Sci. 117, 3807–3820. https:
// doi. org/ 10. 1242/ jcs. 01230.
Kaji, T., Kawashima, T., Sakamoto, M., Kurashige, Y., Koizumi, F., 1991. In hibitory ef fect of rho damine B on the pro lif er a tion of hu man lip brob lasts in cul ture. Tox i col ogy 68, 11–20.
Ke meny-Beke, A., Berenyi, E., Fac sko, A., Dam janovich, J., Hor vath, A., Bokor, A., Bod ‐ nar, A., Berta, A., Aradi, J., 2006. An tipro lire taive ef fect of 4-thy ouridy late on OCM- 1 uveal melanoma cells. Eur. J. Oph thal mol. 16, 680–685.
Khot, K.P., Ko tak, K.J., Bagri-Man jrekar, K., Alex, S., Choud hari, S.S., 2015. Pleo mor ‐ phism of ar gy rophilic nu cle o lar or ga nizer re gions in oral sub mu cous bro sis and oral squa mous cell car ci noma. J. Nat. Sci. Biol. Med. 6 (Suppl. 1), S35–S39.
Ku bin, R.F., Fletcher, A.N., 1983. Flu o res cence quan tum yields of some rho damine dyes.
J. Lu min. 27 (4), 455–462. https: // doi. org/ 10. 1016/ 0022-2313(82)90045-X.
Le Borgne, R., Ho ack, B., 1998. Pro tein trans port from the se cre tory to the en do cytic path way in mam malian. Biochim. Bio phys. Acta 1404 (1–2), 195–209.
Li is berg, M.F., 1968. Rho damine B as an ex tremely spe ci c stain for corni ca tion. Cells Tis sues Or gans 69 (1), 52–57.
Menges, F., 2015. Spekwin32-op ti cal spec troscopy soft ware, ver sion 1.72.0. In: http: //
www. efemm2. de/ spekwin.
Nagy, G., Király, G., Turáni, M., Bánfalvi, G., 2013. Cell triv i sion of hy per ploid cells. DNA Cell Biol. 32 (12), 676–684. https: // doi. org/ 10. 1089/ dna. 2013. 2147.
Nagy, G., Hen nig, G.W., Petrényi, K., Kovács, L., Pócsi, I., Dombrádi, V., Bánfalvi, G., 2014. Time-lapse video mi croscopy and im age analy sis of ad her ence and growth pat ‐ terns of Can dida al bi cans strains. Appl. Mi cro biol. Biotech nol. 98, 5185–5194. https:
// doi. org/ 10. 1007/ s00253-014-5696-5.
Nagy, M., Rácz, D., Lázár, L., Purgel, M., Ditrói, T., Zsuga, M., Kéki, S., 2014. Sol va ‐ tochromic study of highly u o res cent alky lated iso cyanon aph thalenes, their p-stack ‐ ing, hy dro gen-bond ing com plex a tion, and quench ing with pyri dine. Chem. Phys.
Chem. 15 (16), 3614–3625. https: // doi. org/ 10. 1002/ cphc. 201402310.
Nagy, M., Rácz, D., Nagy, Z.L., Nagym, T., Fehér, P.P., Purgel, M., Zsuga, M., Kéki, S., 2016. An acry lated iso cyanon aph tha lene based sol va tochromic click reagent: opti cal and bi o la bel ing prop er ties and quan tum chem i cal mod el ing. Dyes Pig ments 133, 445–457. https: // doi. org/ 10. 1016/ j. dyepig. 2016. 06. 036.
Nagy, M., Rácz, D., Nagy, Z.L., Fehér, P.P., Kalmar, J., Fábián, I., Kiss, A., Zsuga, M., Kéki, S., 2017. Sol va tochromic iso cyanon aph tha lene dyes as lig ands for sil ver(I) com ‐ plexes, their ap plic a bil ity in sil ver(I) de tec tion and back ground re duc tion in bi o la ‐ belling. Sen sors Ac tu a tors B(10 Sep tem ber 2017, In press).
Pf ef fer, S.R., Roth man, J.E., 1987. Biosyn thetic pro tein trans port and sort ing by the en do ‐ plas mic retic u lum and golgi. Annu. Rev. Biochem. 56, 829–852. https: // doi. org/ 10.
1146/ annurev. bi. 56. 070187. 004145.
Pinkus, H., Mehre gan, A.H., Rah bari, H., Krobock, E., 1980. Rho damin B stain for ker ‐ atin: eval u a tion of its speci city and its ap pli ca tion in der mal pathol ogy. J. Cu tan.
Pathol. 7 (4), 222–226.
Rácz, D., Nagy, M., Mándi, A., Zsuga, M., Kéki, S., 2013. Sol va tochromic prop er ties of a new iso cyanon aph tha lene based u o rophore. J. Pho tochem. Pho to biol. A Chem. 270, 19–27. https: // doi. org/ 10. 1002/ cphc. 201402310.
Smith, R., Crocker, J., 1988. Eval u a tion of nu cle o lar or ga nizer re gion-as so ci ated pro teins in breast ma lig nancy. Histopathol ogy 12 (2), 113–125.
Timm, M., Saaby, L., Moesby, L., Hansen, E.W., 2013. Con sid er a tions re gard ing use of sol vents in in vitro cell based as says. Cy totech nol ogy 65 (5), 887–894. https: // doi.
org/ 10. 1007/ s10616-012-9530-6.
Tu rani, M., Ban falvi, G., Pe ter, A., Kuko ricza, K., Ki raly, G., Ta las, L., Tan cos, B., Bal azs, D., Nagy, G., Ke meny-Beke, A., 2014. An tibi otics de lay in vitro hu man stem cell re ‐ growth. Tox i col. in Vitro 29 (2), 370–379. https: // doi. org/ 10. 1016/ j. tiv. 2014. 10.
Ueda, J., Mae hara, K., Mashiko, D., Ichi nose, T., Yao, T., Hori, M., Sato, Y., Kimura, H.,013.
Ohkawa, Y., Ya m a gata, K., 2014. Het e rochro matin dy nam ics dur ing the dif fer en ti a ‐ tion process re vealed by the DNA methy la tion re porter mouse, methylRO. Stem Cell Rep. 2 (6), 910–924. https: // doi. org/ 10. 1016/ j. stemcr. 2014. 05. 008.
Wreggett, K.A., Hill, F., James, P.S., Hutch ings, A., Butcher, G.W., Singh, P.B., 1994. A mam malian ho mo logue of Drosophila het e rochro matin pro tein 1 (HP1) is a com po ‐ nent of con sti tu tive het e rochro matin. Cy to genet. Cell Genet. 66, 99–103. https: // doi.
org/ 10. 1159/ 000133676.
U N C O R R E C TE D P R O O F
The round ing up of Ha CaT cells was also ob served at dif fer ent (10 and 30 μg/ ml) MI CAN con cen tra tions (Fig. 6). The no table dif fer ences be tween the pan els of growth curves at 10 μg/ ml (Fig. 6 up per left curve) and 30 μg/ ml MI CAN con cen tra tions (Fig. 6 up per right curve) in di cate that the re cov ery of ini tial block ade of cell growth up to 10 μg/ ml is con trasted by a tem po rary and vir tual re growth that is fol ‐ lowed by the com plete break down of pro lif er a tion at 30 μg/ ml MI CAN con cen tra tion. De tails are given in Video S1.
Time-lapse laser-scan ning mi croscopy at low ex ci ta tion en ergy was used to col lect 80 im ages within a 5 hour pe riod as shown on Fig. 7.
and Sup ple men tary Video S2. The pro gres sion of slow cel lu lar death was fol lowed by par al lel PI stain ing. No cross-talk be tween the two u ‐ o rophore was ob served dur ing the ex per i ment. Analy sis of the ac quired im age se quences in di cate low stain ing back ground and in signif i cant pho to bleach ing of the MI CAN re sult ing in a high sig nal/ noise ra tio within the ex per i men tal in ter val as shown on the lin ear plots in Fig. 8.
No pho to tox i c ity was ob served dur ing the ex per i ment.
Im ages of Figs. 7 and 8 taken from con sec u tive scan ning cy cles in 220 s in ter vals (3 min 40 s) cov er ing the time pe riod of 5 h did not show any tox i c ity of MI CAN. The video was pro duced us ing u o res cence im ‐ ages vi su al ized 3000 times faster than the record ing (Video S2).