Case Studies in Data Mining
András Fülöp, e-Ventures Ltd.
<fulibacsi@gmail.com>László Gonda, University of Debrecen
<golaczy@gmail.com>Dr.. Márton Ispány, University of Debrecen
<ispany.marton@inf.unideb.hu>Dr.. Péter Jeszenszky, University of Debrecen
<jeszenszky.peter@inf.unideb.hu>Dr.. László Szathmáry, University of Debrecen
<szathmary.laszlo@inf.unideb.hu>Case Studies in Data Mining
by András Fülöp, László Gonda, Dr.. Márton Ispány, Dr.. Péter Jeszenszky, and Dr.. László Szathmáry Publication date 2014
Copyright © 2014 Faculty of Informatics, University of Debrecen
A tananyag a TÁMOP-4.1.2.A/1-11/1-2011-0103 azonosítójú pályázat keretében valósulhatott meg.
Table of Contents
Preface ... ii
1. How to use this material ... iv
I. Data mining tools ... 6
1. Commercial data mining softwares ... 7
2. Free and shareware data mining softwares ... 11
II. RapidMiner ... 13
3. Data Sources ... 16
1. Importing data from a CSV file ... 16
2. Importing data from an Excel file ... 17
3. Creating an AML file for reading a data file ... 19
4. Importing data from an XML file ... 21
5. Importing data from a database ... 23
4. Pre-processing ... 25
1. Managing data with issues - Missing, inconsistent, and duplicate values ... 25
2. Sampling and aggregation ... 27
3. Creating and filtering attributes ... 31
4. Discretizing and weighting attributes ... 35
5. Classification Methods 1 ... 41
1. Classification using a decision tree ... 41
2. Under- and overfitting of a classification with a decision tree ... 46
3. Evaluation of performance for classification by decision tree ... 51
4. Evaluation of performance for classification by decision tree 2 ... 55
5. Comparison of decision tree classifiers ... 58
6. Classification Methods 2 ... 65
1. Using a rule-based classifier (1) ... 65
2. Using a rule-based classifier (2) ... 66
3. Transforming a decision tree to an equivalent rule set ... 68
7. Classification Methods 3 ... 71
1. Linear regression ... 71
2. Osztályozás lineáris regresszióval ... 73
3. Evaluation of performance for classification by regression model ... 76
4. Evaluation of performance for classification by regression model 2 ... 79
8. Classification Methods 4 ... 84
1. Using a perceptron for solving a linearly separable binary classification problem ... 84
2. Using a feed-forward neural network for solving a classification problem ... 85
3. The influence of the number of hidden neurons to the performance of the feed-forward neural network ... 87
4. Using a linear SVM for solving a linearly separable binary classification problem .. 88
5. The influence of the parameter C to the performance of the linear SVM (1) ... 90
6. The influence of the parameter C to the performance of the linear SVM (2) ... 93
7. The influence of the parameter C to the performance of the linear SVM (3) ... 95
8. The influence of the number of training examples to the performance of the linear SVM 97 9. Solving the two spirals problem by a nonlinear SVM ... 100
10. The influence of the kernel width parameter to the performance of the RBF kernel SVM 101 11. Search for optimal parameter values of the RBF kernel SVM ... 103
12. Using an SVM for solving a multi-class classification problem ... 105
13. Using an SVM for solving a regression problem ... 106
Case Studies in Data Mining
10. Association rules ... 118
1. Extraction of association rules ... 118
2. Asszociációs szabályok kinyerése nem tranzakciós adathalmazból ... 121
3. Evaluation of performance for association rules ... 126
4. Performance of association rules - Simpson's paradox ... 131
11. Clustering 1 ... 135
1. K-means method ... 135
2. K-medoids method ... 137
3. The DBSCAN method ... 140
4. Agglomerative methods ... 142
5. Divisive methods ... 144
12. Clustering 2 ... 148
1. Support vector clustering ... 148
2. Choosing parameters in clustering ... 151
3. Cluster evaluation ... 154
4. Centroid method ... 159
5. Text clustering ... 161
13. Anomaly detection ... 165
1. Searching for outliers ... 165
2. Unsupervised search for outliers ... 167
3. Unsupervised statistics based anomaly detection ... 171
III. SAS® Enterprise Miner™ ... 176
14. Data Sources ... 178
1. Reading SAS dataset ... 178
2. Importing data from a CSV file ... 180
3. Importing data from a Excel file ... 183
15. Preprocessing ... 185
1. Constructing metadata and automatic variable selection ... 185
2. Vizualizing multidimensional data and dimension reduction by PCA ... 188
3. Replacement and imputation ... 191
16. Classification Methods 1 ... 196
1. Classification by decision tree ... 196
2. Comparison and evaluation of decision tree classifiers ... 200
17. Classification Methods 2 ... 208
1. Rule induction to the classification of rare events ... 208
18. Classification Methods 3 ... 212
1. Logistic regression ... 212
2. Prediction of discrete target by regression models ... 217
19. Classification Methods 4 ... 221
1. Solution of a linearly separable binary classification task by ANN and SVM ... 221
2. Using artificial neural networks (ANN) ... 225
3. Using support vector machines (SVM) ... 232
20. Classification Methods 5 ... 240
1. Ensemble methods: Combination of classifiers ... 240
2. Ensemble methods: bagging ... 244
3. Ensemble methods: boosting ... 249
21. Association mining ... 256
1. Extracting association rules ... 256
22. Clustering 1 ... 260
1. K-means method ... 260
2. Agglomerative hierarchical methods ... 267
3. Comparison of clustering methods ... 271
23. Clustering 2 ... 278
1. Clustering attributes before fitting SVM ... 278
2. Self-organizing maps (SOM) and vector quantization (VQ) ... 284
24. Regression for continuous target ... 289
Case Studies in Data Mining
1. Detecting outliers ... 304 Bibliography ... 307
List of Figures
3.1. Metadata of the resulting ExampleSet. ... 16
3.2. A small excerpt of the resulting ExampleSet. ... 17
3.3. Metadata of the resulting ExampleSet. ... 18
3.4. A small excerpt of the resulting ExampleSet. ... 18
3.5. The resulting AML file. ... 20
3.6. A small excerpt of The World Bank: Population (Total) data set used in the exepriment. ... 21
3.7. Metadata of the resulting ExampleSet. ... 22
3.8. A small excerpt of the resulting ExampleSet. ... 22
3.9. Metadata of the resulting ExampleSet. ... 23
3.10. A small excerpt of the resulting ExampleSet. ... 24
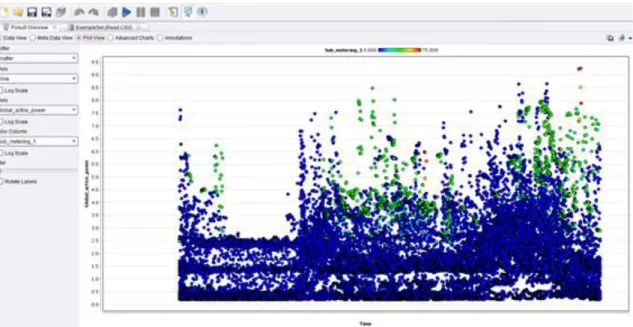
4.1. Graphic representation of the global and kitchen power consumption in time ... 25
4.2. Possible outliers based on the hypothesized hbits of the members of the household ... 26
4.3. Filtering of the possible values using a record filter ... 26
4.4. Selection of aggregate functions for attributes ... 28
4.5. Preferences for dataset sampling ... 29
4.6. Preferences for dataset filtering ... 29
4.7. Resulting dataset after dataset sampling ... 30
4.8. Resulting dataset after dataset filtering ... 30
4.9. Defining a new attribute based on an expression relying on existing attributes ... 32
4.10. Properties of the operator used for removing the attributes made redundant ... 33
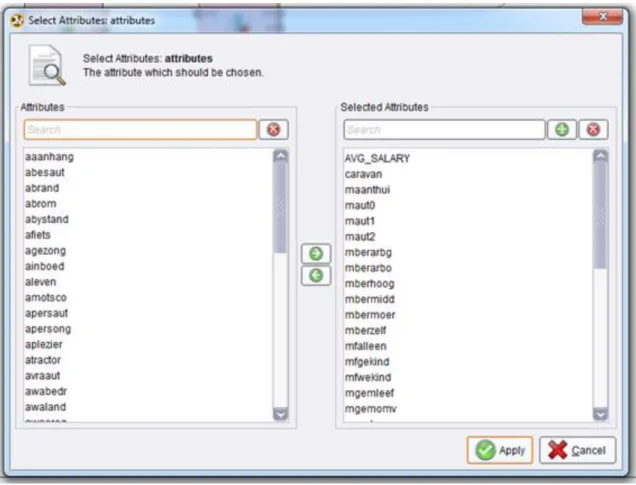
4.11. Selection of the attributes to remain in the dataset with reduced size ... 33
4.12. The appearance of the derived attribute in the altered dataset ... 34
4.13. Selection of the appropriate discretization operator ... 36
4.14. Setting the properties of the discretization operator ... 37
4.15. Selection of the appropriate weighting operator ... 37
4.16. Defining the weights of the individual attributes ... 38
4.17. Comparison of the weighted and unweighted dataset instances ... 39
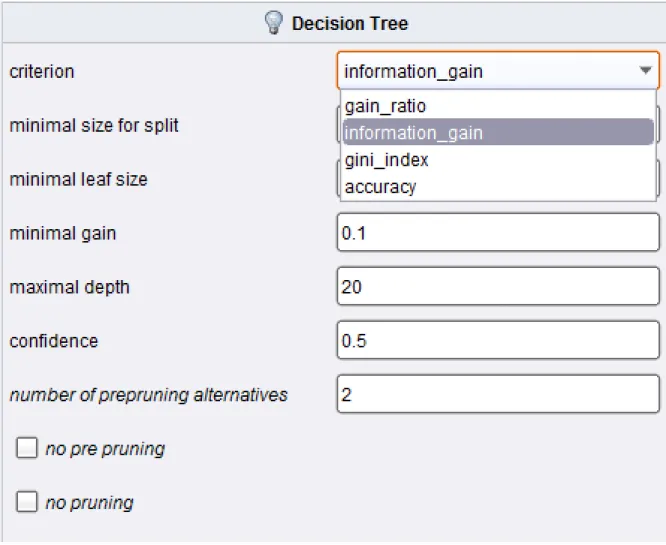
5.1. Preferences for the building of the decision tree ... 41
5.2. Preferences for splitting the dataset into training and test sets ... 42
5.3. Setting the relative sizes of the data partitions ... 42
5.4. Graphic representation of the decision tree created ... 43
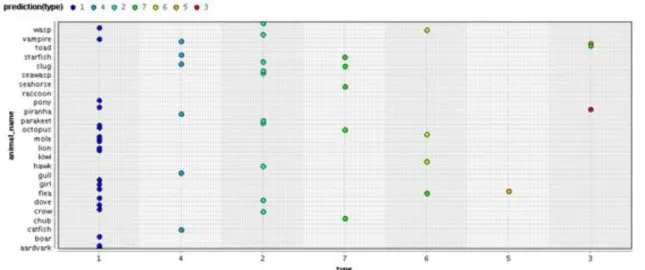
5.5. The classification of the records based on the decision tree ... 44
5.6. Setting a threshold for the maximal depth of the decision tree ... 46
5.7. Graphic representation of the decision tree created ... 47
5.8. Graphic representation of he classification of the records based on the decision tree ... 47
5.9. Graphic representation of the decision tree created with the increased maximal depth ... 48
5.10. Graphic representation of he classification of the records based on the decision tree with increased maximal depth ... 48
5.11. Graphic representation of the decision tree created with the further increased maximal depth 49 5.12. Graphic representation of he classification of the records based on the decision tree with further increased maximal depth ... 50
5.13. Preferences for the building of the decision tree ... 52
5.14. Graphic representation of the decision tree created ... 52
5.15. Graphic representation of he classification of the records based on the decision tree ... 53
5.16. Performance vector of the classification based on the decision tree ... 53
5.17. The modification of preferences for the building of the decision tree. ... 53
5.18. Graphic representation of the decision tree created with the modified preferences ... 54
5.19. Performance vector of the classification based on the decision tree created with the modified preferences ... 54
5.20. Settings for the sampling done in the validation operator ... 56
5.21. Subprocesses of the validation operator ... 56
5.22. Graphic representation of the decision tree created ... 56
Case Studies in Data Mining
5.26. Overall performance vector of the classifications done in the cross-validation operator in the leave-
one-out case ... 58
5.27. Preferences for the building of the decision tree based on the Gini-index criterion ... 59
5.28. Preferences for the building of the decision tree based on the gain ratio criterion ... 60
5.29. Graphic representation of the decision tree created based on the gain ratio criterion ... 61
5.30. Performance vector of the classification based on the decision tree built using the gain ratio criterion ... 62
5.31. Graphic representation of the decision tree created based on the Gini-index criterion ... 62
5.32. Performance vector of the classification based on the decision tree built using the Gini-index criterion ... 62
5.33. Settings of the operator for the comparison of ROC curves ... 62
5.34. Subprocess of the operator for the comparison of ROC curves ... 63
5.35. Comparison of the ROC curves of the two decision tree classifiers ... 63
6.1. The rule set of the rule-based classifier trained on the data set. ... 65
6.2. The classification accuracy of the rule-based classifier on the data set. ... 65
6.3. The rule set of the rule-based classifier. ... 67
6.4. The classification accuracy of the rule-based classifier on the training set. ... 67
6.5. The classification accuracy of the rule-based classifier on the test set. ... 67
6.6. The decision tree built on the data set. ... 68
6.7. The rule set equivalent of the decision tree. ... 69
6.8. The classification accuracy of the rule-based classifier on the data set. ... 69
7.1. Properties of the linear regression operator ... 71
7.2. The linear regression model yielded as a result ... 72
7.3. The class prediction values calculated based on the linear regression model ... 72
7.4. The subprocess of the classification by regression operator ... 74
7.5. The linear regression model yielded as a result ... 74
7.6. The class labels derived from the predictions calculated based on the regression model ... 75
7.7. The subprocess of the classification by regression operator ... 77
7.8. The linear regression model yielded as a result ... 77
7.9. The performance vector of the classification based on the regression model ... 78
7.10. The subprocess of the cross-validation by regression operator ... 80
7.11. The subprocess of the classification by regression operator ... 80
7.12. The linear regression model yielded as a result ... 80
7.13. The customizable properties of the cross-validation operator ... 81
7.14. The overall performance vector of the classifications done using the regression model defined in the cross-validation operator ... 82
7.15. The overall performance vector of the classifications done using the regression model defined in the cross-validation operator for the case of using the leave-one-out method ... 82
8.1. A linearly separable subset of the Wine data set [UCI MLR] used in the experiment (2 of the total of 3 classes and 2 of the total of 13 attributes was selected). ... 84
8.2. The decision boundary of the perceptron. ... 85
8.3. The classification accuracy of the perceptron on the data set. ... 85
8.4. The classification accuracy of the neural network on the data set. ... 86
8.5. The average classification error rate obtained from 10-fold cross-validation against the number of hidden neurons. ... 87
8.6. A linearly separable subset of the Wine data set [UCI MLR] used in the experiment (2 of the total of 3 classes and 2 of the total of 13 attributes was selected). ... 89
8.7. The kernel model of the linear SVM. ... 89
8.8. The classification accuracy of the linear SVM on the data set. ... 90
8.9. A subset of the Wine data set used in the experiment (2 of the total of 3 classes and 2 of the total of 13 attributes was selected). Note that the classes are not linearly separable. ... 91
8.10. The classification error rate of the linear SVM against the value of the parameter C. ... 91
Case Studies in Data Mining
8.16. The number of support vectors against the number of training examples. ... 98
8.17. CPU execution time needed to train the SVM against the number of training examples. ... 98
8.18. The Two Spirals data set ... 100
8.19. The R code that produces the data set and is executed by the Execute Script (R) operator of the R Extension. ... 100
8.20. The classification accuracy of the nonlinear SVM on the data set. ... 101
8.21. The classification error rates of the SVM on the training and the test sets against the value of RBF kernel width parameter. ... 102
8.22. The optimal parameter values for the RBF kernel SVM. ... 104
8.23. The classification accuracy of the RBF kernel SVM trained on the entire data set using the optimal parameter values. ... 104
8.24. The kernel model of the linear SVM. ... 105
8.25. The classification accuracy of the linear SVM on the data set. ... 106
8.26. The optimal value of the gamma parameter for the RBF kernel SVM. ... 107
8.27. The average RMS error of the RBF kernel SVM obtained from 10-fold cross-validation against the value of the parameter gamma, where the horizontal axis is scaled logarithmically. ... 107
8.28. The kernel model of the optimal RBF kernel SVM. ... 108
8.29. Predictions provided by the optimal RBF kernel SVM against the values of the observed values of the dependent variable. ... 108
9.1. The average classification error rate of a single decision stump obtained from 10-fold cross- validation. ... 110
9.2. The average classification error rate of the bagging algorithm obtained from 10-fold cross-validation, where 10 decision stumps were used as base classifiers. ... 110
9.3. The average classification error rate obtained from 10-fold cross-validation against the number of base classifiers. ... 112
9.4. The average classification error rate obtained from 10-fold cross-validation against the number of base classifiers. ... 114
9.5. The average error rate of the random forest obtained from 10-fold cross-validation against the number of base classifiers. ... 116
10.1. List of the frequent item sets generated ... 118
10.2. List of the association rules generated ... 119
10.3. Graphic representation of the association rules generated ... 120
10.4. Operator preferences for the necessary data conversion ... 121
10.5. Converted version of the dataset ... 122
10.6. List of the frequent item sets generated ... 122
10.7. List of the association rules generated ... 123
10.8. Operator preferences for the appropriate data conversion ... 123
10.9. The appropriate converted version of the dataset ... 124
10.10. Enhanced list of the frequent item sets generated ... 124
10.11. List of the association rules generated ... 125
10.12. Graphic representation of the association rules generated ... 125
10.13. Operator preferences for the necessary data conversion ... 127
10.14. Label role assignment for performance evaluation ... 128
10.15. Prediction role assignment for performance evaluation ... 128
10.16. Operator preferences for the data conversion necessary for evaluation ... 129
10.17. Graphic representation of the association rules generated regarding survival ... 129
10.18. List of the association rules generated regarding survival ... 130
10.19. Performance vector for the application of association rules generated ... 130
10.20. List of the association rules generated regarding survival ... 131
10.21. Performance vector for the application of association rules generated ... 132
10.22. Contingency table of the dataset ... 132
10.23. Record filter usage ... 132
10.24. Removal of attributes that become redundant after filtering ... 133
10.25. List of the association rules generated for the subset of adults ... 133
10.26. Performance vector for the application of association rules generated regarding survival for the subset of adults ... 133
Case Studies in Data Mining
11.2. Clustering with default values ... 135
11.3. Set the distance function. ... 136
11.4. Clustering with Mahalanobis distance function ... 136
11.5. The dataset ... 138
11.6. Setting the parameters of the clustering ... 138
11.7. The clusters produced by the analysis ... 139
11.8. The groups with varying density ... 140
11.9. The results of the method with default parameters ... 141
11.10. The 15 group ... 142
11.11. The resulting dendrogram ... 143
11.12. The clustering generated from dendrogram ... 143
11.13. The 600 two-dimensional vectors ... 145
11.14. The subprocess ... 146
11.15. The report generated by the clustering ... 146
11.16. The output of the analysis ... 147
12.1. The two groups ... 148
12.2. Support vector clustering with polynomial kernel and p=0.21 setup ... 149
12.3. Unsuccessful clustering ... 149
12.4. Clustering with RBF kernel ... 150
12.5. More promising results ... 150
12.6. The two groups containing 240 vectors ... 151
12.7. The subprocess of the optimalization node ... 152
12.8. The parameters of the optimalization ... 152
12.9. The report generated by the process ... 153
12.10. Clustering generated with the most optimal parameters ... 153
12.11. The 788 vectors ... 155
12.12. The evaluating subprocess ... 155
12.13. Setting up the parameters ... 156
12.14. Parameters to log ... 156
12.15. Cluster density against k number of clusters ... 157
12.16. Item distribution against k number of clusters ... 157
12.17. The vectors forming 31 clusters ... 159
12.18. The extracted centroids ... 160
12.19. The output of the k nearest neighbour method, using the centroids as prototypes ... 160
12.20. The preprocessing subprocess ... 162
12.21. The clustering setup ... 162
12.22. The confusion matrix of the results ... 163
13.1. Graphic representation of the possible outliers ... 165
13.2. The number of outliers detected as the distance limit grows ... 166
13.3. Nearest neighbour based operators in the Anomaly Detection package ... 168
13.4. Settings of LOF. ... 168
13.5. Outlier scores assigned to the individual records based on k nearest neighbours ... 168
13.6. Outlier scores assigned to the individual records based on LOF ... 169
13.7. Filtering the records based on their outlier scores ... 169
13.8. The dataset filtered based on the k-NN score ... 170
13.9. The dataset filtered based on the LOF score ... 170
13.10. Global settings for Histogram-based Outlier Score ... 171
13.11. Column-level settings for Histogram-based Outlier Score ... 172
13.12. Scores and attribute binning for fixed binwidth and arbitrary number of bins ... 172
13.13. Graphic representation of outlier scores ... 173
13.14. Scores and attributes binning for dynamic binwidth and arbitrary number of bins ... 174
13.15. Graphic representation of the enhanced outlier scores ... 175
Case Studies in Data Mining
15.1. Metadata produced by the DMDB operator ... 185
15.2. The settings of Variable Selection operator ... 186
15.3. List of variables after the selection ... 186
15.4. Sequential R-square plot ... 187
15.5. The binary target variables in a function of the two most important input attributes after the variable selection ... 187
15.6. Displaying the dataset by parallel axis ... 189
15.7. Explained cumulated explained variance plot of the PCA ... 190
15.8. Scatterplit of the Iris dataset using the first two principal components ... 191
15.9. The replacement wizard ... 192
15.10. The output of imputation ... 193
15.11. The relationship of an input and the target variable before imputation ... 193
15.12. The relationship of an input and the target variable after imputation ... 194
16.1. The settings of dataset partitioning ... 196
16.2. The decision tree ... 197
16.3. The response curve of the decision tree ... 198
16.4. Fitting statistics of the decision tree ... 198
16.5. The classification chart of the decision tree ... 198
16.6. The cumulative lift curve of the decision tree ... 199
16.7. The importance of attributes ... 200
16.8. The settings of parameters in the partitioning step ... 201
16.9. The decision tree using the chi-square impurity measure ... 202
16.10. The decision tree using the entropy impurity measure ... 202
16.11. The decision tree using the Gini-index ... 203
16.12. The cumulative response curve of decision trees ... 204
16.13. The classification plot ... 205
16.14. Response curve of decision trees ... 205
16.15. The score distribution of decision trees ... 206
16.16. The main statistics of decision trees ... 206
17.1. The misclassification rate of rule induction ... 208
17.2. The classification matrix of rule induction ... 208
17.3. The classification chart of rule induction ... 209
17.4. The ROC curves of rule inductions and decision tree ... 209
17.5. The output of the rule induction operator ... 210
18.1. Classification matrix of the logistic regression ... 212
18.2. Effects plot of the logistic regression ... 213
18.3. Classification matrix of the stepwise logistic regression ... 213
18.4. Effects plot of the stepwise logistic regression ... 214
18.5. Fitting statistics for logistic regression models ... 214
18.6. Classification charts of the logistic regression models ... 215
18.7. Cumulativ lift curve of the logistic regression models ... 215
18.8. ROC curves of the logistic regression models ... 216
18.9. Classification matrix of the logistic regression ... 217
18.10. The classification chart of the logistic regression ... 218
18.11. The effects plot of the logistic regression ... 219
19.1. A linearly separable subset of the Wine dataset ... 221
19.2. Fitting statistics for perceptron ... 222
19.3. The classification matrix of the perceptron ... 222
19.4. The cumulative lift curve of the perceptron ... 222
19.5. Fitting statistics for SVM ... 223
19.6. The classification matrix of SVM ... 223
19.7. The cumulative lift curve of SVM ... 223
19.8. List of the support vectors ... 224
19.9. Fitting statistics of the multilayer perceptron ... 225
19.10. The classification matrix of the multilayer perceptron ... 226
19.11. The cumulative lift curve of the multilayer perceptron ... 226
Case Studies in Data Mining
19.16. Fitting statistics of neural networks ... 229
19.17. Classification charts of neural networks ... 230
19.18. Cumulative lift curves of neural networks ... 230
19.19. ROC curves of neural networks ... 231
19.20. Fitting statistics for linear kernel SVM ... 233
19.21. The classification matrix of linear kernel SVM ... 233
19.22. Support vectors (partly) of linear kernel SVM ... 233
19.23. The distribution of Lagrange multipliers for linear kernel SVM ... 234
19.24. The parameters of polynomial kernel SVM ... 234
19.25. Fitting statistics for polynomial kernel SVM ... 235
19.26. Classification matrix of polynomial kernel SVM ... 235
19.27. Support vectors (partly) of polynomial kernel SVM ... 236
19.28. Fitting statistics for SVM's ... 236
19.29. The classification chart of SVM's ... 237
19.30. Cumulative lift curves of SVM's ... 237
19.31. Comparison of cumulative lift curves to the baseline and the optimal one ... 238
19.32. ROC curves of SVM's ... 238
20.1. Fitting statistics of the ensemble classifier ... 240
20.2. The classification matrix of the ensemble classifier ... 240
20.3. The cumulative lift curve of the ensemble classifier ... 241
20.4. Misclassification rates of the ensemble classifier and the SVM ... 242
20.5. Classification matrices of the ensemble classifier and the SVM ... 242
20.6. Cumulative lift curves of the ensemble classifier and the SVM ... 242
20.7. Cumulative lift curves of the ensemble classifier, the SVM and the best theoretical model . 243 20.8. ROC curves of the ensemble classifier and the SVM ... 243
20.9. The classification matrix of the bagging classifier ... 245
20.10. The error curves of the bagging classifier ... 246
20.11. Misclassification rates of the bagging classifier and the decision tree ... 247
20.12. Classification matrices of the bagging classifier and the decision tree ... 247
20.13. Response curves of the bagging classifier and the decision tree ... 247
20.14. Response curves of the bagging classifier and the decision tree comparing the baseline and the optimal classifiers ... 248
20.15. ROC curves of the bagging classifier and the decision tree ... 248
20.16. The classification matrix of the boosting classifier ... 250
20.17. The error curve of the boosting classifier ... 251
20.18. Misclassification rates of the boosting classifier and the SVM ... 252
20.19. Classification matrices for the boosting classifier and the SVM ... 252
20.20. Cumulative response curves of the boosting classifier and the SVM ... 252
20.21. Response curves of the boosting classifier and the SVM comparing the baseline and the optimal classifiers ... 253
20.22. ROC curves of the boosting classifier and the SVM ... 254
21.1. List of items ... 256
21.2. The association rules as a function of the support and the reliability ... 257
21.3. Graph of lift values ... 257
21.4. List of association rules ... 258
22.1. The Aggregation dataset. ... 260
22.2. The setting of the Cluster operator. ... 261
22.3. The result of K-means clustering when K=7 ... 262
22.4. The setting of the MacQueen clustering ... 263
22.5. The result of the MacQueen clustering ... 263
22.6. The result of the clustering with 8 clusters ... 264
22.7. The result display of the Cluster operator ... 265
Case Studies in Data Mining
22.16. The Maximum Variance (D31) dataset ... 272
22.17. The result of automatic clustering ... 273
22.18. The CCC plot of automatic clustering ... 273
22.19. Az automatikus klaszterezés proximitási ábrája ... 273
22.20. The result of K-means clustering ... 274
22.21. The proximity graph of K-means clustering ... 274
22.22. The profile of the segments (clusters) ... 275
23.1. The dendrogram of attribute clustering ... 278
23.2. The graph of clusters and attributes ... 279
23.3. The cluster membership ... 279
23.4. The correlation plot of the attributes ... 280
23.5. The correlation between clusters and an attribute ... 281
23.6. Classification charts of SVM models ... 282
23.7. The response curve of SVM models ... 282
23.8. Az SVM modellek kumulatív lift függvényei ... 282
23.9. The ROC curves of SVM models ... 283
23.10. The scatterplot of the Maximum Variance (R15) dataset ... 284
23.11. The result of Kohonen's vector quantization ... 285
23.12. The pie chart of cluster size ... 285
23.13. Statistics of clusters ... 286
23.14. Graphical representation of the SOM ... 286
23.15. Scatterplot of the result of SOM ... 287
24.1. Classification matrix of the logistic regression ... 289
24.2. Effects plot of the logistic regression ... 290
24.3. Classification matrix of the stepwise logistic regression ... 290
24.4. Effects plot of the stepwise logistic regression ... 291
24.5. Fitting statistics for logistic regression models ... 291
24.6. Classification charts of the logistic regression models ... 292
24.7. Cumulativ lift curve of the logistic regression models ... 292
24.8. ROC curves of the logistic regression models ... 293
24.9. Classification matrix of the logistic regression ... 294
24.10. The classification chart of the logistic regression ... 295
24.11. The effects plot of the logistic regression ... 296
24.12. Statistics of the fitted models on the test dataset ... 297
24.13. Comparison of the fitted models by means of predictions ... 298
24.14. The observed and predicted means plot ... 298
24.15. The model scores ... 299
24.16. The decision tree for continuous target ... 300
24.17. The weights of neural network after traning ... 301
25.1. Statistics before and after filtering outliers ... 304
25.2. The predicted mean based on the two decision trees ... 305
25.3. The tree map of the best model ... 305
25.4. Comparison of the two fitted decision trees ... 306
Colophon
TODO
Preface
The data mining is an interdisciplinary area of information technology, one of the most important parts of the so-called KDD (Knowledge Discovery from Databases) process. It consists of such computationally intensive algorithms, methods which are capable to explore patterns from relatively large datasets that represent well- interpretable information for further use. The applied algorithms originate from a number of fields, namely, artificial intelligence, machine learning, statistics, and database systems. Moreover, the data mining combine the results of these areas and it evolves in interaction of them today too. In contrast to focus merely to data analysis, see, for example, the statistics, data mining contains a number of additional elements, including the datamanegement and data preprocessing, moreover, such post-processing issues as the interesting metrics or the suitable visualization of the explored knowledge.
The use of the word data mining has become very fashionable and many people mistakenly use it for all sorts of information processing involving large amounts of data, e.g., simple information extraction or data warehouse building), but it also appears in the context of decision support systems. In fact, the most important feature of data mining is the exploration or the discovery that is to produce something new, previously unknown and useful information for the user. The term of data mining has emerged in the '60s, when the statisticians used it in negative context when one analyzes the data without any presupposition. In the information technology it appeared first in the database community in the '90s in the context of describing the sophisticated information extraction. Although, the termof data mining is spread in the business, more synonym exists, for example, knowledge discovery. It is important to distinguish between data mining and the challenging Big Data problems nowadays. The solution of Big Data problems usually does not require the development of new theoretical models or methods, the problem is rather that the well-working algorithms of data mining softwares hopelessly slow down when you want to process a really large volumes of data as a whole instead of a reasonable sample size. This obviously requires a special attitude and IT infrastructure that is outside the territory of the present curriculum.
The data mining activity, in automatic or semi-automatic way, is integrated into the IT infrastructure of the organization which applies it. This means that we can provide newer and newer information for the users by data mining tools from the ever-changing data sources, typically from data warehouses, with relatively limited human intervention. The reason is that because the (business) environment is constantly changing, following the changes of the data warehouse which collects the data from the environment. Hence, the previously fitted data mining models lose their validity, new models may need to model the altered data. Data mining softwares increasingly support this approach in such a way that they are able to operate in very heterogeneous environments. The collaboration between the information service and the supporting analytics nowadays allows the development of real-time analytics based online systems, see, e.g., the recommendation systems.
The data mining is organized around the so-called data mining process, followed by the majority of data mining softwares. In general, this is a five-step process where the steps are as follows:
• Sampling, data selection;
• Exploring,preprocessing;
• Modifying, transforming;
• Modelling;
• Interpreting, assessing.
The data mining softwares provide operators for these steps and we can carry out certain operations with them, for example, reading an external file, filtering outliers, or fitting a neural network model. Representing the data mining process by a diagram in a graphical interface, there are nodes corresponding to these operators.
Examples of this process are the SEMMA methodology of the SAS Institute Inc.® which is known about its information delivery softwares and the widely used Cross Industry Standard Process for Data Mining (CRISP- DM) methodology, which has evolved by cooperating of many branch of industry, e.g., finance, automotive,
Preface
the data obtained from here have gone through a pre-processing phase in general, when they move from the operational systems into the data warehouse, and thus they can be considered to be reliable. If this is not the case then the used data mining software provides tools for data cleaning, which, in this case, can already be considered as the second step of the process. Sampling can generally be done using an appropriate statistical method, for example, simple random or stratified sampling method. Also in this step the dataset is partitioned to training, validating, and testing set. On the training dataset the data mining model is fitted and its parameters isestimated. The validating dataset is used to stop the convergence in the training process or compare different models. By this method, using independent dataset from the training dataset, we obtain reliable decision where to stop the training. Finally, on the test data set generalization ability of the model can be measured, that is how it will be expected to behave in case of new records.
The exploring step means the acquaintance with the data without any preconception if it is possible. The objective of the exploring step is to form hypotheses to establish in connection with the applicable procedures.
The main tools are the descriptive statistics and graphical vizualization. A data mining software has is a number graphical tools which exceed the tools of standard statistical softwares. Another objective of the exploring is to identify any existing errors (noise) and to find the places of missing data.
The purposes of modifying is the preparation of the data for fitting a data mining model. There may be several reasons for this. One of them is that many methods require directly the modification of the data, for example, in case of neural networks the attributes have to be standardized before the training of the network. An other one is that if a method does not require the modification of the data, however a better fitting model is obtained after suitable modification. An example is the normalization of the attributes by suitable transformations before fitting a regression model in order the input attributes wiil be close to the normal distribution. The modification can be carried out at multiple levels: at the level of entire attributes by transforming whole attributes, at the level of the records, e.g., by standardizing some records or at the level of the fields by modifying some data. The modifying step also includes the elimination of noisy and missing data, the so-called imputation as well.
The modeling is the most complex step of the data mining process and it requires the largest knowledge as well.
In essence, we solve here, after suitable preparation, the data mining task. The typical data mining tasks can be divided into two groups. The first group is known as supervised data mining and supervised training. In this case, there is an attribute with a special role in the dataset which is called target. The target variable should be indicated in the used data mining software. Our task then is to describe this target variables by using the other variables as well as we can. The second group is known as unsupervised data mining or unsupervised learning.
In this case, there is no special attributes in the analyzed dataset, where we want to explore hidden patterns.
Within the data mining, 6 task types can be defined, from which the classification and the regression are supervised data mining and the segmentation, association, sequential analysis, and anomaly detection are unsupervised data mining.
• Classification: modelling known classes (groups) for generalization purpose in order to apply the built model for new records. Example: filtering emails by classifying them for spam and no-spam classes.
• Regression: building a model which approximates a continuous target by a function of input attributes such that the error of this approximation is as small as possible. Example: estimating customer value by current demographic and historical data.
• Segmenting, clustering: finding in a sense similar groups in the data without taking into account any known existing structure. A typical example is the customer segmentation when a bank or insurance company is looking for groups of clients behaving similarly.
• Association: searching relationships between attributes. Typical example is the basket analysis, when we look at what goods are bought by the customers in the stores and supermarkets.
• Anomaly detection: identifying such records, which may be interesting or require further investigation due to
Preface
very poorly on new data. This is the so-called overfitting. In order to avoid the overfitting we should lean on the training, validating, and testing dataset. At this step, we can also compare our fitted models if there are more than one. In the comparison various measurements, e.g., misclassification rate, mean square error, and graphical tools, e.g., lift curve, ROC curve, can be used.
This electronic curriculum aims at providing an introduction to data mining applications, so that it shows these applications in practice through the use of data mining softwares. Problems requiring data mining can be encountered in many fields of life. Some of these are listed below, datasets used in the course material also came from these areas.
• Commercial data mining. One of the main driving forces behind the development and application of data mining. Its objective is to analyze the static, historical business data stored in data warehouses in order to explore hidden patterns and trends. Besides the standard way of collecting data, companies found out several other ways to build more reliable data mining models, for example, this is also one of the main reasons behind the spreading of loyalty cards. Among a number of specific application areas we emphasize the customer relationship management (CRM): who are our customers and how to deal with them, the churn analysis:
which customers are planning to leave us, the cross-selling: what products should be offered together. The algorithms of market basket analysis have been born in solving a business problem.
• Scientific data mining. The other main driving force behind the development of data mining. Many data mining methods, for example, neural networks and self-organizing map, have been developed for solving a scientific problem and they became a method of data mining only years later. The application areas are ranging from the astronomy (galaxy classification and processing various radiation detected in space), chemistry (forecasting, the properties of artificial molecules), and engineering sciences (material science, traffic management) to biology (bioinformatics, drug discovery, and genetics). Data mining can help in areas where the problem of data gap appears, i.e., far more data is generated than the scientist is able to process.
• Mining medical data. The development of health information technology makes possible for doctors to share their diagnostic results with each other and thus it enables not to repeate doing an examination several times.
Moreover, by collecting the diagnosis as the results of examination in a common data warehouse, it will be possible to develope new medical procedures by means of data mining techniques. Data mining is also likely to play an important role in personalized medicine as well.
• Spatial data mining. Analysis of spatial data with data mining methods, the extension of the traditional geographic information systems (GIS) with data mining tools. Application areas: climate research, the spread of epidemics, customer analysis of large multinational companies taking into account the spatial dimension.
An important area in the future will be the processing of data generated in sensor networks, e.g., pollution monitoring on an area.
• Multimédia adatbányászat. Analysis of audio, image and video files by data mining tools. Data mining can help to find similarities between songs in order to decide copyright issues more objectively. Another application is finding copyright law conflicting or illegal contents in file-sharing systems and in multimedia service providers.
• Web mining. Analysis of web data. Three types of web mining problems are distinguished: web structure mining, web content mining, and web usage mining. The web structure mining means the examination of the structure of the Web, i.e., the examination of the web-graph, where the set of vertices consists of the sites and the set of edges consists of the links between the sites. The web content mining means the retrieval of useful information from the contents on the web. The well-known web search engines (Google, AltaVista, etc) also carry out this thing. The web usage mining deals with examining what users are searching for on the Internet, using the the data gathered by Web servers and application servers. These areas are strongly related to Big Data problems because it is needed to work many times over an Internet-scale infrastructure.
• Text mining. Mining of unstructured or semi-structured data. Under unstructured data we mean continuous texts (sequences of strings), which may be connected by a theme (e.g., scienctific), by a field (e.g., sport), or they can be customer's sentiments at a customer service. Semi-structured data are typically produced by computers or files produced for computers, for example, in XML or JSON format. Some specific
Preface
The RapidMiner and SAS® Enterprise Miner™ workflows presented in this course material are contained in the file resources/workflows.zip.
Fontos
Data files used in the experiments must be downloaded by the user from the location specified in the text. After importing a workflow file paths must be set to point to the local copies of data files (absolute paths are required).
Part I. Data mining tools
Introduction
In this part, data mining tools and softwares are overviewed. There are three necessary conditions of the succesful data mining. First, we need an appropriate data sets to perform data mining. In practice, this is often a task-oriented data-mart generated from the enterprise data warehouse. In the education, and so in this curriculum, the datasets are taken from widely used data repository. All datasets are attached to this material.
Another important condition to data mining is the data mining expert. We hope that this curriculum will be able to contribute to the education of this professionals. Finally, the key is the software with which data mining is performed. They can be classified on the basis of several criteria, e.g., business or free, self-contained or integrated, general or specific, theme-oriented or not. The most up-to-date information on this topic can be found on the website KDnuggets™. The reader can get fresh information on current job openings, courses, conferences etc. from here as well.
In the curriculum two softwares are discussed in detail: a leading one from the free data mining softwares, RapidMiner 3.5 and one of the most widely used commercial data mining softwares, SAS® Enterprise Miner™
Version 7.1. The list of the data mining softwares below is based on the KDnuggets™ portal.
Chapter 1. Commercial data mining softwares
• AdvancedMiner Professional , (formerly Gornik), provides a wide range of tools for data transformations, Data Mining models, data analysis and reporting.
• Alteryx, offering Strategic Analytics platform, including a free Project Edition version.
• Angoss Knowledge Studio, a comprehensive suite of data mining and predictive modeling tools;
interoperability with SAS and other major statistical tools.
• BayesiaLab, a complete and powerful data mining tool based on Bayesian networks, including data preparation, missing values imputation, data and variables clustering, unsupervised and supervised learning.
• BioComp i-Suite, constraint-based optimization, cause and effect analysis, non-linear predictive modeling, data access and cleaning, and more.
• BLIASoft Knowledge Discovery, for building models from data based mainly on fuzzy logic.
• CMSR Data Miner, built for business data with database focus, incorporating rule-engine, neural network, neural clustering (SOM), decision tree, hotspot drill-down, cross table deviation analysis, cross-sell analysis, visualization/charts, and more.
• Data Applied, offers a comprehensive suite of web-based data mining techniques, an XML web API, and rich data visualizations.
• Data Miner Software Kit, collection of data mining tools, offered in combination with a book: Predictive Data Mining: A Practical Guide, Weiss and Indurkhya.
• DataDetective, the powerful yet easy to use data mining platform and the crime analysis software of choice for the Dutch police.
• Dataiku, a software platform for data science, statistics, guided machine learning and visualization capabilities, built on Open Source, Hadoop integration.
• DataLab, a complete and powerful data mining tool with a unique data exploration process, with a focus on marketing and interoperability with SAS.
• DBMiner 2.0 (Enterprise), powerful and affordable tool to mine large databases; uses Microsoft SQL Server 7.0 Plato.
• Delta Miner, integrates new search techniques and "business intelligence" methodologies into an OLAP front- end that embraces the concept of Active Information Management.
• ESTARD Data Miner, simple to use, designed both for data mining experts and common users.
• Exeura Rialto™ , provides comprehensive support for the entire data mining and analytics life-cycle at an affordable price in a single, easy-to-use tool.
• Fair Isaac Model Builder, software platform for developing and deploying analytic models, includes data analysis, decision tree and predictive model construction, decision optimization, business rules management, and open-platform deployment.
Commercial data mining softwares
• GenIQ Model, uses machine learning for regression task; automatically performs variable selection, and new variable construction, and then specifies the model equation to "optimize the decile table".
• GhostMiner, complete data mining suite, including k-nearest neighbors, neural nets, decision tree, neurofuzzy, SVM, PCA, clustering, and visualization.
• GMDH Shell, an advanced but easy to use tool for predictive modeling and data mining. Free trial version is available.
• Golden Helix Optimus RP, uses Formal Inference-based Recursive Modeling (recursive partitioning based on dynamic programming) to find complex relationships in data and to build highly accurate predictive and segmentation models.
• IBM SPSS Modeler, (formerly Clementine), a visual and powerful data mining workbench.
• Insights, (formerly KnowledgeMiner) 64-bit parallel software for autonomously building reliable predictive analytical models from high-dimensional noisy data using outstanding self-organizing knowledge mining technologies. Model export to Excel. Localized for English, Spanish, German. Free trial version.
• JMP, offers significant visualization and data mining capabilities along with classical statistical analyses.
• K. wiz, from thinkAnalytics - massively scalable, embeddable, Java-based real-time data-mining platform.
Designed for Customer and OEM solutions.
• Kaidara Advisor, (formerly Acknosoft KATE), Case-Based Reasoning (CBR) and data mining engine.
• Kensington Discovery Edition, high-performance discovery platform for life sciences, with multi-source data integration, analysis, visualization, and workflow building.
• Kepler, extensible, multi-paradigm, multi-purpose data mining system.
• Knowledge Miner, a knowledge mining tool that works with data stored in Microsoft Excel for building predictive and descriptive models. (MacOS, Excel 2004 or later).
• Kontagent kSuite DataMine, a SaaS User Analytics platform offering real-time behavioral insights for Social, Mobile and Web, offering SQL-like queries on top of Hadoop deployments.
• KXEN (SAP company), providing Automated Predictive Analytics tools for Big Data.
• LIONsolver (Learning and Intelligent OptimizatioN) Learning and Intelligent OptimizatioN: modeling and optimization with "on the job learning" for business and engineering by Reactive Search SrL.
• LPA Data Mining tools, support fuzzy, bayesian and expert discovery and modeling of rules.
• Magnify PATTERN, software suite, contains PATTERN:Prepare for data preparation; PATTERN:Model for building predictive models; and PATTERN:Score for model deployment.
• Mathematica solution for Data Analysis and Mining, from Wolfram.
• MCubiX, a complete and affordable data mining toolbox, including decision tree, neural networks, associations rules, visualization, and more.
• Microsoft SQL Server, empowers informed decisions with predictive analysis through intuitive data mining, seamlessly integrated within the Microsoft BI platform, and extensible into any application.
• Machine Learning Framework, provides analysis, prediction, and visualization using fuzzy logic and ML methods; implemented in C++ and integrated into Mathematica.
• Molegro Data Modeller, a cross-platform application for Data Mining, Data Modelling, and Data
Commercial data mining softwares
• Oracle Data Mining (ODM), enables customers to produce actionable predictive information and build integrated business intelligence applications.
• Palisade DecisionTools Suite, complete risk and decision analysis toolkit.
• Partek, pattern recognition, interactive visualization, and statistical analysis, modeling system.
• Pentaho, open-source BI suite, including reporting, analysis, dashboards, data integration, and data mining based on Weka.
• Polyanalyst, comprehensive suite for data mining, now also including text analysis, decision forest, and link analysis. Supports OLE DB for Data Mining, and DCOM technology.
• Powerhouse Data Mining, for predictive and clustering modelling, based on Dorian Pyle's ideas on using Information Theory in data analysis. Most information is in Spanish.
• Predictive Dynamix, integrates graphical and statistical data analysis with modeling algorithms including neural networks, clustering, fuzzy systems, and genetic algorithms.
• Previa, family of products for classification and forecasting.
• Quadstone DecisionHouse, an agile analytics solution with a complete suite of capabilities to support end-to- end data mining cycle.
• RapAnalyst™ , uses advanced artificial intelligence to create dynamic predictive models, to reveal relationships between new and historical data.
• Rapid Insight Analytics, streamlines the predictive modeling and data exploration process, enabling users of all abilities to quickly build, test, and implement statistical models at lightning speed.
• Reel Two, real-time classification software for structured and unstructured data as well entity extraction.
From desktop to enterprise.
• Salford Systems Data Mining Suite, CART Decision Trees, MARS predictive modeling, automated regression, TreeNet classification and regression, data access, preparation, cleaning and reporting modules, RandomForests predictive modeling, clustering and anomaly detection.
• SAS® Enterprise Miner™ , an integrated suite which provides a user-friendly GUI front-end to the SEMMA (Sample, Explore, Modify, Model, Assess) process.
• SPAD, provides powerful exploratory analyses and data mining tools, including PCA, clustering, interactive decision trees, discriminant analyses, neural networks, text mining and more, all via user-friendly GUI.
• Statistica Data Miner, a comprehensive, integrated statistical data analysis, graphics, data base management, and application development system.
• Synapse, a development environment for neural networks and other adaptive systems, supporting the entire development cycle from data import and preprocessing via model construction and training to evaluation and deployment; allows deployment as .NET components.
• Teradata Warehouse Miner and Teradata Analytics, providing analytic services for in-place mining on a Teradata DBMS.
• thinkCRA , from thinkAnalytics, an integrated suite of Customer Relationship Analytics applications supporting real-time decisioning.
Commercial data mining softwares
• Viscovery data mining suite, a unique, comprehensive data mining suite for business applications with workflow-guided project environment; includes modules for visual data mining, clustering, scoring, automation and real-time integration.
• Xeno, InfoCentricity powerful, user-friendly online analytic platform, supporting segmentation, clustering, exploratory data analysis, and the development of highly predictive models.
• XLMiner, Data Mining Add-In For Excel.
• Xpertrule Miner, (Attar Software) features data transformation, Decision Trees, Association Rules and Clustering on large scale data sets.
Chapter 2. Free and shareware data mining softwares
• Alteryx Project Edition, free version of Alteryx, delivers the data blending, analytics, and sharing capabilities of Alteryx with just enough allowed runs of your workflow to solve one business problem or to complete one project.
• AlphaMiner, open source data mining platform that offers various data mining model building and data cleansing functionality.
• CMSR Data Miner, built for business data with database focus, incorporating rule-engine, neural network, neural clustering (SOM), decision tree, hotspot drill-down, cross table deviation analysis, cross-sell analysis, visualization/charts, and more. Free for academic use.
• CRAN Task View: Machine Learning and Statistical Learning, machine learning and statistical packages in R.
• Databionic ESOM Tools, a suite of programs for clustering, visualization, and classification with Emergent Self-Organizing Maps (ESOM).
• ELKI: Environment for DeveLoping KDD-Applications Supported by Index-Structures, a framework in Java which includes clustering, outlier detection, and other algorithms; allows user to evaluate the combination of arbitrary algorithms, data types, and distance functions.
• Gnome Data Mining Tools, including apriori, decision trees, and Bayes classifiers.
• jHepWork, an interactive environment for scientific computation, data analysis and data visualization designed for scientists, engineers and students.
• KEEL, includes knowledge extraction algorithms, preprocessing techniques, evolutionary rule learning, genetic fuzzy systems, and more.
• KNIME, extensible open source data mining platform implementing the data pipelining paradigm (based on eclipse).
• Machine Learning in Java (MLJ), an open-source suite of Java tools for research in machine learning. (The software will not be developed further.)
• MiningMart, a graphical tool for data preprocessing and mining on relational databases; supports development, documentation, re-use and exchange of complete KDD processes. Free for non-commercial purposes.
• ML-Flex, an open-source software package designed to enable flexible and efficient processing of disparate data sets for machine-learning (classification).
• MLC++, a machine learning library in C++.
• Orange, open source data analytics and mining through visual programming or Python scripting. Components for visualization, rule learning, clustering, model evaluation, and more.
• PredictionIO, an open source machine learning server for software developers and data engineers to create
Free and shareware data mining softwares
• Weka, collection of machine learning algorithms for solving real-world data mining problems. It is written in Java and runs on almost any platform.
Part II. RapidMiner
Table of Contents
3. Data Sources ... 16 1. Importing data from a CSV file ... 16 2. Importing data from an Excel file ... 17 3. Creating an AML file for reading a data file ... 19 4. Importing data from an XML file ... 21 5. Importing data from a database ... 23 4. Pre-processing ... 25 1. Managing data with issues - Missing, inconsistent, and duplicate values ... 25 2. Sampling and aggregation ... 27 3. Creating and filtering attributes ... 31 4. Discretizing and weighting attributes ... 35 5. Classification Methods 1 ... 41 1. Classification using a decision tree ... 41 2. Under- and overfitting of a classification with a decision tree ... 46 3. Evaluation of performance for classification by decision tree ... 51 4. Evaluation of performance for classification by decision tree 2 ... 55 5. Comparison of decision tree classifiers ... 58 6. Classification Methods 2 ... 65 1. Using a rule-based classifier (1) ... 65 2. Using a rule-based classifier (2) ... 66 3. Transforming a decision tree to an equivalent rule set ... 68 7. Classification Methods 3 ... 71 1. Linear regression ... 71 2. Osztályozás lineáris regresszióval ... 73 3. Evaluation of performance for classification by regression model ... 76 4. Evaluation of performance for classification by regression model 2 ... 79 8. Classification Methods 4 ... 84 1. Using a perceptron for solving a linearly separable binary classification problem ... 84 2. Using a feed-forward neural network for solving a classification problem ... 85 3. The influence of the number of hidden neurons to the performance of the feed-forward neural network ... 87 4. Using a linear SVM for solving a linearly separable binary classification problem ... 88 5. The influence of the parameter C to the performance of the linear SVM (1) ... 90 6. The influence of the parameter C to the performance of the linear SVM (2) ... 93 7. The influence of the parameter C to the performance of the linear SVM (3) ... 95 8. The influence of the number of training examples to the performance of the linear SVM . 97 9. Solving the two spirals problem by a nonlinear SVM ... 100 10. The influence of the kernel width parameter to the performance of the RBF kernel SVM 101 11. Search for optimal parameter values of the RBF kernel SVM ... 103 12. Using an SVM for solving a multi-class classification problem ... 105 13. Using an SVM for solving a regression problem ... 106 9. Classification Methods 5 ... 110 1. Introducing ensemble methods: the bagging algorithm ... 110 2. The influence of the number of base classifiers to the performance of bagging ... 111 3. The influence of the number of base classifiers to the performance of the AdaBoost method 113 4. The influence of the number of base classifiers to the performance of the random forest 115 10. Association rules ... 118 1. Extraction of association rules ... 118 2. Asszociációs szabályok kinyerése nem tranzakciós adathalmazból ... 121 3. Evaluation of performance for association rules ... 126 4. Performance of association rules - Simpson's paradox ... 131 11. Clustering 1 ... 135
RapidMiner
5. Divisive methods ... 144 12. Clustering 2 ... 148 1. Support vector clustering ... 148 2. Choosing parameters in clustering ... 151 3. Cluster evaluation ... 154 4. Centroid method ... 159 5. Text clustering ... 161 13. Anomaly detection ... 165 1. Searching for outliers ... 165 2. Unsupervised search for outliers ... 167 3. Unsupervised statistics based anomaly detection ... 171
Chapter 3. Data Sources
1. Importing data from a CSV file
Description
The process demonstrates how to import data from CSV files using the Read CSV and the Open File operators.
In the experiment we use a real-time earthquake data feed provided by USGS in CSV format. First, we download the feed to able to import it into RapidMiner using the Import Configuration Wizard of the Read CSV operator. The wizard guides the user step by step through the import process and helps him to set the parameters of the operator correctly. After the local copy of the feed is successfully imported into RapidMiner, we can switch to the live feed adding the Open File to the process.
Input
The United States Geological Survey (or USGS for short) provides real time earthquake data feeds at the Earthquake Hazards Program website. Data is available in various formats, including CSV. The experiment uses the feed of the magnitude 1+ earthquakes in the past 30 days in CSV format from the URLhttp://earthquake.usgs.gov/earthquakes/feed/v1.0/csv.php. The feed is updated in every 15 minutes.
Output
An ExampleSet that contains data imported from the CSV feed.
Figure 3.1. Metadata of the resulting ExampleSet.
Data Sources
Figure 3.2. A small excerpt of the resulting ExampleSet.
Interpretation of the results
Each time the process is run, it will read live data from the web.
Video
Workflow
import_exp1.rmp
Keywords
importing data CSV
Operators
Open File Read CSV
2. Importing data from an Excel file
Data Sources
Description
The process demonstrates how to import data from Excel files using the Read Excel operator. The Concrete Compressive Strength data set is used in the experiment. Parameters of the Read Excel operator are set via its Import Configuration Wizard.
Input
Concrete Compressive Strength [UCI MLR] [Concrete]
Output
An ExampleSet that contains data imported from the Excel file.
Figure 3.3. Metadata of the resulting ExampleSet.
Figure 3.4. A small excerpt of the resulting ExampleSet.
Data Sources
Interpretation of the results Video
Workflow
import_exp2.rmp
Keywords
importing data Excel
Operators
Guess Types Open File Read Excel
Rename by Generic Names
3. Creating an AML file for reading a data file
Data Sources
Description
The process demonstrates how to create an AML file using the Read AML operator for reading a data file. AML files are XML documents that provide metadata about attributes including their names, datatypes, and roles.
Once the AML file is created it can be used to read the underlying data file properly.
Input
Pima Indians Diabetes [UCI MLR]
Output
An AML file in the file system and an ExampleSet that contains data imported from the data file using the AML file.
Figure 3.5. The resulting AML file.
<?xml version="1.0" encoding="UTF-8" standalone="no"?>
<attributeset default_source="pima-indians-diabetes.data" encoding="UTF-8">
<attribute name="Number of times pregnant " sourcecol="1" valuetype="integer"/>
<attribute name="Plasma glucose concentration" sourcecol="2" valuetype="integer"/>
<attribute name="Diastolic blood pressure" sourcecol="3" valuetype="integer"/>
<attribute name="Triceps skin fold thickness" sourcecol="4" valuetype="integer"/>
<attribute name="2-Hour serum insulin" sourcecol="5" valuetype="integer"/>
<attribute name="Body mass index" sourcecol="6" valuetype="real"/>
<attribute name="Diabetes pedigree function" sourcecol="7" valuetype="real"/>
<attribute name="Age" sourcecol="8" valuetype="integer"/>
<label name="Class" sourcecol="9" valuetype="binominal">
<value>1</value>
<value>0</value>
</label>
</attributeset>
Interpretation of the results
The resulting AML file is intended to be distributed together with the data file.
Video
Data Sources
import_exp3.rmp
Keywords
importing data AML
Operators
Read AML
4. Importing data from an XML file
Description
The process demonstrates how to import data from XML documents using the Read XML operator. Parameters of the Read XML operator are set via its Import Configuration Wizard. Attribute values are extracted from the XML document using XPath location paths.
Input
The experiment uses population data in XML from the World Bank Open Data website. The data set is available at http://data.worldbank.org/indicator/SP.POP.TOTL in various formats, including XML.
Figure 3.6. A small excerpt of The World Bank: Population (Total) data set used in the exepriment.
<?xml version="1.0" encoding="utf-8"?>
<Root xmlns:wb="http://www.worldbank.org">
<data>
<record>
<field name="Country or Area" key="ABW">Aruba</field>
<field name="Item" key="SP.POP.TOTL">Population (Total)</field>
<field name="Year">1960</field>