REFORMATION AND HETEROGENEITY – CONNECTION BETWEEN CULTURAL AND ENVIRONMENTAL MANIFESTATION
IN THREE SPATIAL REGIONS FÜLÖP Györk
2462 Martonvásár, Orgona út 17., e-mail: gyork.fulop@gmail.com
Keywords: spatial heterogeneity, reformation, social effect, ecological effect, explorative research, spatial statistics, remote sensing
Abstract: The main aim of this explorative work is to study the connection between the spatial distribution of protestant population (religions affected by reformation) and the spatial heterogeneity of land cover. The empirical approach of the paper excludes any historical or cultural analysis. It is irrespective for the generating processes, and rather initiates a descriptive overview. The target is the relation, and the general quality of this relation between two basic factors of landscapes – forming effects out of social and natural sources – throughout a comparative case study. If the existence of this relation is objectively confirmed as results of this analysis, a future follow-up research shall investigate the existing causal relations and describes how the ecologically influential spatial structures of the landscapes are connected to social processes like the reformation. Recent study has an objective attitude to the descriptive analysis, and applies spatial statistic methods in NUTS 3 regions of three ‘study areas’: Hungary, Germany and Romania. The utilized input data was collected from the 2011 census and from the landscape indexing of low resolution multispectral satellite remote sensing data of MODIS satellite mission. The interpreted statistical results show a significant underlying background effect between the spatial heterogeneity and the spatial distribution of protestant citizens. The nature of this relationship is to be investigated in the future. The outputs of this study intends to show a direction for the explorative research by providing the first step-stones in the form of significant landscape indices, basic descriptive statistics and rough estimation of the strength of the underlying effect.
Introduction
‘[…] The landscape also forms the human life. The vitality, the material and economical attributes of the lifestyle, the laws and the spirituality of its inhabitants are depending on the landscape itself, and this influence is continuously present in the humour, in the mood and in the quality of religious factors as well.’ (Teleki 1937 in Csemez 1996, translation by the author).
Recent study was inspired by the quote above: is there objectively observable relation between the cultural and the structural attributes of a landscape – like between spiritual preferences and spatial heterogeneity?
A doctoral research (Fülöp 2011-2017) explored and represented the importance of landscape diversity and spatial heterogeneity. This importance is even more highlighted as an ecological effect due to the ecological systems’ exposition to spatial organization. The spiritual-cultural movement of reformation is recently celebrating its 500th anniversary, and stands for a globally representative social effect. In the followings the objective comparison of the two factors – spatial heterogeneity and religious preferences – are assessed empirically, as it can be observed nowadays.
Materials and methods Definitions
In this study the social effect of European reformation is quantified by the regional distribution of protestant believer population, and the landscape diversity is represented by the
spatial heterogeneity of the land cover. As for the perceivable components of the landscapes:
the landscapes are the heterogeneous mosaics of different land forms, vegetation (land cover) and land use (Urban et al. 1987). Therefor the heterogeneity is a definitive attribute of the landscape, and the land cover is one of the observable components. This heterogeneity is constantly presented at on all scales and is one of the most essential values of the functional landscapes (Wu 2004).
Methods
Recent study does not aim to find new methodologies for landscape assessment, its novelty rather originates from the comparison of the spatial aspects of a social and an environmental factor. The comparison is done on a quantitative basis, to prepare and support an in-depth explorative analysis. Therefore, from a methodological point of view, the introduced analysis stands for a feasibility study of an in-depth research targeting the objective exploration of socio-environmental interaction mechanisms of landscapes with the utilization of satellite and statistical datasets.
Data and quantification
The study compares two factors: 1.) as a social effect the spatial distribution of protestant believers – as a quantification of the cultural influence of reformation; 2.) as a structural/environmental effect the spatial heterogeneity is quantified with landscape ecological measures. The spatial unit of comparison in both factors is the NUTS 3 regions of the three study ‘areas’, which imply Hungary, Germany and Romania.
The fact, that these units (especially Hungary and Romania) are not – historically, ecologically, geographically – functional regions, was not regarded. Many of NUTS 3 (administrative) regions have been formulated and spatially modified in the (relatively) near past, therefore they are not standing for clearly functional spatial units of this study. This error is recognized, but not treated in this study, since it rather takes away from the strength of the to-be indicated relations (the error causes strictness of analysis, statistical error of second kind is less likely). Data aggregation did not take place in any data collection in order to minimize the effect of MAUP (Modifiable Area Unit Problem – Openshaw et al. 1979 and 1981;
Fotheringham et al. 1991). This means that index values have been calculated directly for the assessed regions: without aggregation, with binary border treatment therefore no adjacencies have been computed from neighbouring regions; and religious distribution have been used as published in the 2011 census for the given NUTS 3 regions (not compiled from smaller administrative regional units).
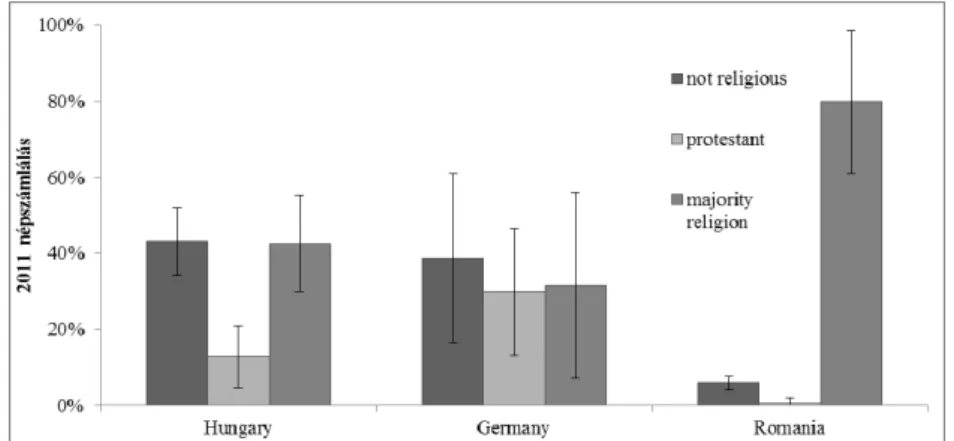
Figure 1. Distribution of protestant believers in NUTS 3 regions of the three countries 1. ábra A protestáns hívők eloszlása a vizsgált országok NUTS 3 régióiban.
Regional distribution of believers has been quantified from the Census 2011 data (due to EU wide collection with synchronized methodology). Since census data is obviously aggregated in itself, MAUP could not be excluded totally, however in this study the officially published regional numbers have been utilized without further aggregation. The choice of the three study ‘areas’ is based on the pre-concept that these are three genuinely different cases:
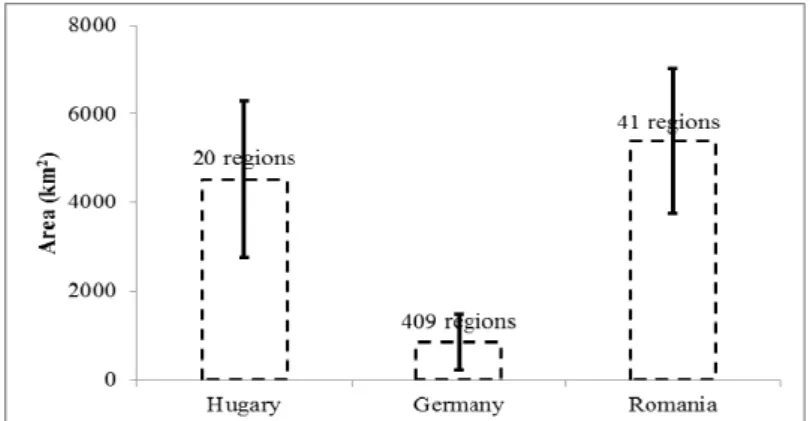
Germany, where reformation had a very strong influence; Hungary, where protestants are globally present but in minority; and Romania, where they are in a spatially defined radical minority (Figure 1.). Besides the number and ratio of protestant people, the number and ratio of not religious citizens and number and ratio of majority religion has been also recorded. In Germany and Hungary the majority religion has been the catholic, in Romania the orthodox church. The three countries, however, are consisting of NUTS 3 regions of different numbers and sizes. This shall be taken into account when assessing the results of the study (Figure 2.).
Figure 2. Average size and number of NUTS 3 regions in the study 2. ábra A vizsgált NUTS 3 régiók átlagos területmérete
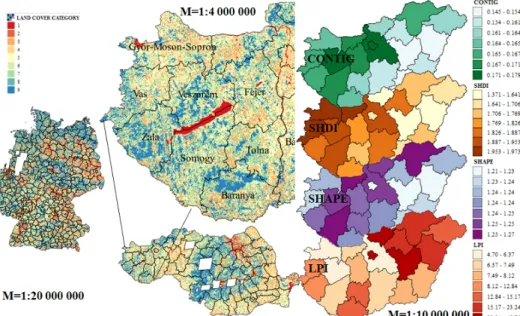
The quantification of spatial heterogeneity was preceded by the analysis of land cover. For this aim the low resolution MODIS (463 m) satellite imagery was used. The scenes covering all three countries were acquired on 05.08.2015. After the mosaicking of the scenes, cloud covered and snow influenced areas has been masked out (in order to prevent their radical statistic effect during further steps of image processing). The territory of the three countries has been classified together (unsupervised K-mean cluster analysis with 5% cluster change threshold) into 10 land cover classes using four reflectance bands of the imagery (R – 620- 670, G: 545-565 nm, B: 459-479 nm, NIR: 841-876 nm). The classified dataset has been clipped with NUTS 3 region boundaries (Figure 3.).
Figure 3. Land cover classification, and quantification of spatial heterogeneity indices 3. ábra A felszínborítási osztályok, és a tájváltozatossági indexek
(javasoltan: tájsokféleségi indexek – Fülöp 2017) számítása
The 470 regional land cover classified regions has been analysed in the environment of Fragstats 4.2 software in order to calculate landscape level heterogeneity indices (Waltz 2011). The indices have been calculated with the methods of Fragstats (McGarigal 2015), which are the most widely used methods. The calculated indices have been gathered into 4 landscape metric groups as seen in Table 1. describing all 470 records (NUTS 3 regions).
Table 1. Utilized spatial heterogeneity indices of landscape metrics 1. táblázat Az alkalmazott tájsokféleségi indexek és csoportosításuk Metric group Number of
indices Indices as calculated in Fragstats 4.2 Area-Edge 9 TA, NP, PD, LPI, TE, ED, LSI, AREA_MN, GYRATE_MN
Shape 6 SHAPE_MN, FRAC_MN, PARA_MN, CIRCLE_MN, CONTIG_MN,
PAFRAC_MN
Aggregation 8 ENN_MN, CONTAG_MN, PLDAJ, IJI, COHESION, DIVISION, MESH, SPLIT
Diversity 8 PRD, SHDI, SIDI, MSIDI, SHEI, SIEI, MSIEI, AI
The utilized indices will not be introduced here due to their well-known meaning in landscape ecology. In the followings, indices will be shortly described partially only if the conclusion requires that. In general, the metric groups’ names are well describing, therefore the area-edge metric group is standing of indices, which describe the spatial heterogeneity by assessing the territory and the perimeter of landscape patches of the region; the shape metrics describe the forms and geometric complexity of the patches of the given region; the aggregation metrics quantify the spatial distances between landscape patches; the diversity metrics define the participation of land cover classes in the construction of the area of interest.
Hereby the systematic critics of landscape metrics (Gustafson 1998) shall be mentioned to give a safe ground of index interpretation: landscape metrics are often correlating, overlapping with each other, containing un-controlled redundancies of spatial information.
Analysis and results
The analysis had a dual aim: 1.) to detect the relationship between the cultural and the environmental factors; 2.) to describe the primary quality of this relation and to give a basis for further investigation. The analysis has been prepared in an objective attitude with a statistical approach. The former analysis aim has been targeted by assessments of the ‘raw’
data base; the latter one was approached by classifying the regions along their religious descriptors. The statistical analysis has been carried out with the software environment of IBM SPSS Statistics.
Correlation of cultural and environmental attributes
In order to analyse the relation between the two subjected factors (cultural and environmental), Pearson’s correlation has been calculated between the describing variables.
Two indirect variables have been constructed from the religious regional distributions:
protestant ratio to non-believers and protestant ratio to believers of majority religion. The former one intends to grasp the quantity effect, the latter the quality effect.
The fixed factors of the study areas (the three countries) have been ignored in this phase of the analysis. Significant correlation has been indicated at two significance levels: α=0,05;
α=0,01. The general overview of the analysis can be seen in Table 2. As it can be understood, only 12 landscape metrics out of 31 is not correlating significantly with the absolute ratio of the regional population, while 3 indices show significant and 16 highly significant relation.
The average P value (strength) of the significant correlations is however quite low (P=19,6%), which means the correlation of the cultural and environmental factors is existing throughout a background effect. This conclusion is highlighted by the fact, that the absolute ratio of protestant population is maximal in case of the TA (total area): P=0,404; therefore the bigger the NUTS 3 region is, the higher the ratio of the protestant population is. Since the statistical power of the 409 German regions is very effective, and since in Germany the smaller NUTS 3 regions are attributed to towns/cities with central position, it can be suspected that urbanization shall be a component of the mentioned background effect.
Table 2. Correlation statistics of religious and spatial heterogeneity variables 2. táblázat Korrelációs statisztika a vallási és a tájsokféleségi változók között
Number of landscape metrics Correlating to?
NO YES
at SL 0.05
YES at SL 0.01
absolute ratio of protestants: 12 3 16
ratio of protestants to non-believers: 15 6 10
ratio of protestants to believers of majority religion: 18 4 9
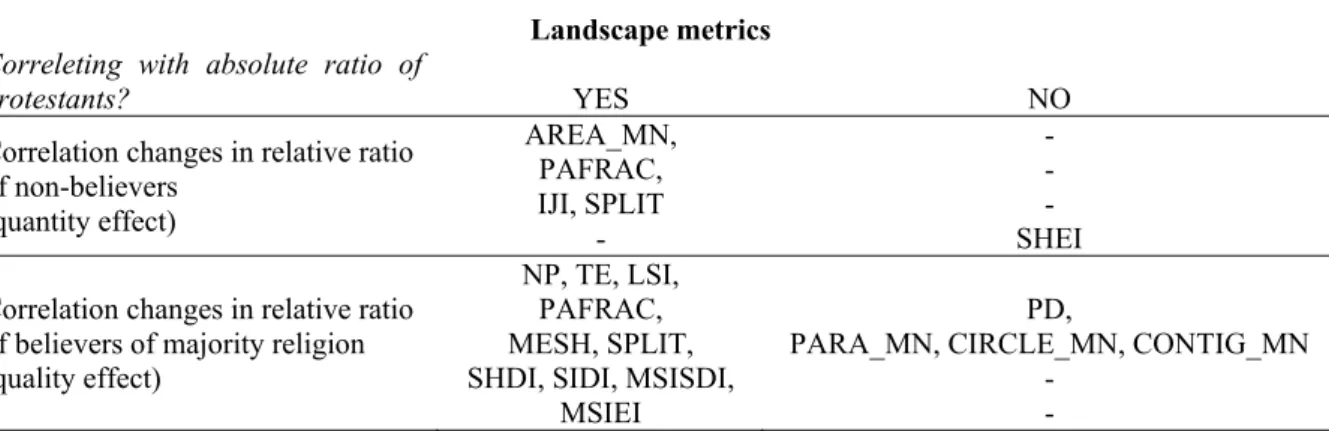
When assessing the change of correlation due to the quantity and quality effects – therefore to the relative ratio of protestant population to the non-believer and majority believer population – interesting statistical results has been observed and presented in Table 3.
Practically, in this calculation it was assessed, whether the correlation was changing (through the threshold of α=0,05 significance level) due to the relative ratio calculations, if a given landscape metric had/had not been correlating with the absolute ratio of protestant population.
Table 3. Quantity and quality effects on correlation between religious and spatial heterogeneity variables 3. táblázat A mennyiségi és minőségi hatások érvényesülése a vallási és tájsokféleségi változók közti
korrelációban Landscape metrics Correleting with absolute ratio of
protestants? YES NO
Correlation changes in relative ratio of non-believers
(quantity effect)
AREA_MN, PAFRAC, IJI, SPLIT
-
- - - SHEI Correlation changes in relative ratio
of believers of majority religion (quality effect)
NP, TE, LSI, PAFRAC, MESH, SPLIT, SHDI, SIDI, MSISDI,
MSIEI
PD,
PARA_MN, CIRCLE_MN, CONTIG_MN -
-
In case of seven indices the correlation is significant both calculated with absolute and relative ratios of protestant population: total area (TA); largest patch index (LPI); mean radius of gyration of patches (GYRATE_MN); shape index (SHAPE); fractal dimension (FRAC);
landscape division index (DIVISION); Simpson’s Evennes Index (SIEI). In case of relative ratio of protestant population to majority religion believer population (quality effect) the correlation change of shape indices (gain) and diversity indices (loss) is obvious. Therefore shape indices might stand for indicative attributes when assessing cultural effects of reformation. With low (P=20,7%) strength but with high significance (α=0,01) it can be stated, that if a region is consisting of land cover patches of more dense and complex shapes, it is less likely that the population is protestant.
Regional similarity assessment of religious attributes
In order to prepare the regional data for first-step explanatory analysis, the religious similarity assessment of the NUTS 3 regions has been necessary, which was prepared on a country basis. In each of the three countries 3-3 religious categories has been constructed with K- means cluster analysis. Into the classification process also the indirect variables of relative ratios has been involved, which did not create distortion of the statistical space, since they stand for results of linear transformation; however, they could help the interpretation of the classification results. The cluster profiles of the German regions are presented in Table 4.
Table 4. Religious classification and cluster profile assessment of German NUTS 3 regions 4. táblázat A németországi NUTS 3 régiók vallási kategóriái és azok profiljai
Cluster
Number I Number II. Number III.
variables ranking of centroid
ratio of non-believers 1 2 3
ratio of protestants 2 1 3
ratio of believers of majority religion 2 3 1
relative ratio of non-believers 3 1 2
relative ratio of believers of majority
religion 2 1 3
number of NUTS 3 regions 110 regions 30 regions 272 regions
Cluster profile
QUANTITY NO PROTESTANT QUALITY NO
Structure of clusterprofiles has been similar to the German example (Table 4.) also in Hungary and Romania. The regional distribution of religious categories can be seen in Figure 4. At first glance, the pre-concept of choosing these three countries as the subject of the study seems to be verified, and the spatial distributions are describing reality (east-west division of Germany, eastern protestant center of Hungary; Hungarian nationality effect in Transilvania in Romania). The qualitative assessment of the religious variable values of the cluster centroids projected three classes of NUTS 3 regions: ’PROTESTANT’ regions, where absolute and relative ratio of the protestant population is definitely present; ’QUANTITY NO’ regions, where the effect of reformation is undermined buy the higher number of non- believers; ’QUALITY NO’ regions, where the religious preference of people is standing for the majority (catholic/ortodox) religion. It must be emphasized, that this categorization is based solely on the Census 2011 data, therefore lacks any historical outlook.
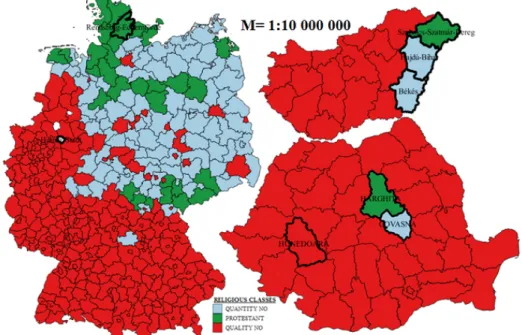
Figure 4. Regional distribution of religious classess of NUTS 3 regions of Germany, Hungary and Romania
green: ’PROTESTANT’ (centroids: Rendsburg-Eckernförde, Germany; Szabolcs-Szatmár-Bereg, Hungary; Harghita, Romania) blue: ’QUANTITY NO’ (centroids: Kiel, Germany; Békés and Hajdú-Bihar, Hungary; Covasna, Romania)
red: ’QUALITY NO’ (centroids: Hamm, Germany; Tolna, Hungary; Hunedoara, Romania)
4. ábra A német, magyar és román NUTS 3 régiók vallási kategóriáinak eloszlása
zöld: „PROTESTÁNS” (centroidok: Rendsburg-Eckernförde, Németország; Szabolcs-Szatmár-Bereg megye, Magyarország; Harghita, Románia)
kék: „MENNYISÉGI NEM” (centroidok: Kiel, Németország; Békés megye és Hajdú-Bihar megye, Magyarország; Covasna, Románia) vörös: „MINŐSÉGI NEM” (centroidok: Hamm, Németország; Tolna megye, Magyarország; Hunedoara, Románia)
Analysis of variances
Utilizing the regional religious categories as dependent variable, ANOVA analysis has been conducted with the grouped landscape metrics. The analysis aimed to assess whether the spatial heterogeneity index values are significantly different in the three religious categories.
Due to the case numbers of different categories the analysis could be executed only in Germany. It must be added however, that the class-means follow the same logic also in Hungary and Romania.
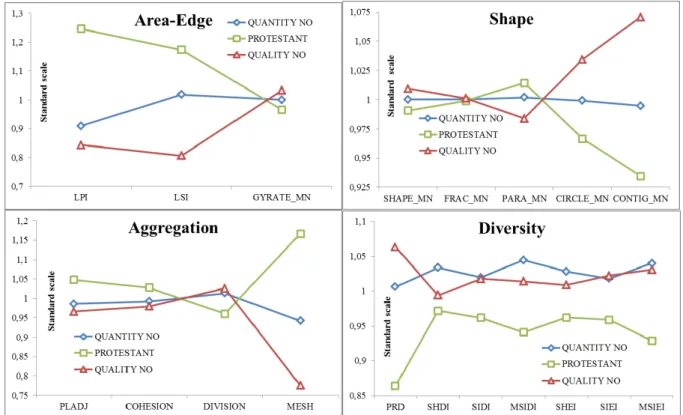
As it in Figure 5. can be seen, in case of 19 spatial heterogeneity variables out of 31 landscape metrics, the differences of (religious) categories have been significant. Tukey’s post hoc analysis showed, that out of the expected values of these 19 variables 8 were significantly different between ‘PROTESTANT’ and ‘QUANTITY NO’ and 16 were significantly different between ‘PROTESTANT’ and ‘QUALITY NO’ regional categories (α=0,05). As it
from Figure 5. shall be understood, reformation (as cultural effect) shall have obvious relation with spatial heterogeneity (as environmental effect), since ‘QUANTITY NO’ values are predominantly between the two extremes of ‘PROTESTANT’ and ‘QUALITY NO’ spatial heterogeneity values. Exceptional density variables rather show, that ‘QUANTITY NO’ and
‘QUALITY NO’ regions stand together, while ‘PROTESTANT’ regions are radically less diverse (practically: the number of constructing land cover classes is lower).
Figure 5. Significantly different spatial heterogeneity cluster means of religious categories in Germany 5. ábra A vallási kategóriák szignifikánsan eltérő tájsokféleségi átlagértékei Némtországban
Discriminant analysis
After the analysis of spatial heterogeneity variances, the question emerged, whether the significant differentiating variables could be utilized for the prediction of religious attributes (therefore the introduced classes) of the region? And if yes, how effective the differentiating function would be?
In order to find out the answer for the question above, discriminant analysis has been prepared, where the dependent variable was the religious cluster membership of the German regions. The predicting efficiency of the spatial heterogeneity variables have been assessed by metric groups and together as well. The discriminant functions – in order to prevent collinearity, therefore the information redundancy referred previously from Gustafson 1998 – have been formed by using ‘stepwise’ method to exclude variables which do not contribute to the discriminant functions with significant new information. When assessing the describing power of all variables (regardless to metric groups), the analysis has been repeated with
‘enter’ method as well (pushing all variables which were used in any metric group’s stepwise model into the function) to interpret the collinearity between metric groups as well.
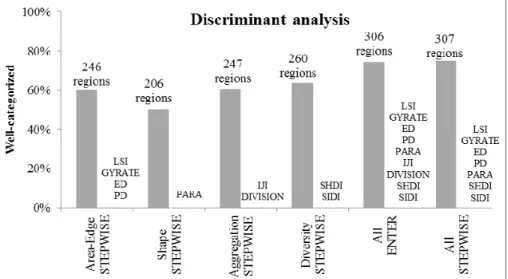
Figure 6. summarizes the results of the analysis. The impact of redundant information – which can be detected even between metric groups (referring again to Gustafson 1998) – can be seen in the last two columns: even though that the ‘enter’ method could utilize two more variables for the prediction of religious categories than ‘stepwise’ method, it brought
marginally worse results, since the redundant information which gained weight due to repetition in the variables pulled the discriminant function into a sub-optimal direction.
The overview of Figure 6. brings interesting observations: stepwise method leaves quite few variables in the function only the Area-Edge variables based model is consisting more than two (relatively independent variables), and allows a 60,2% accurate classification of the 409 NUTS 3 regions of Germany (canonical correlation: 0,514). Shape metrics can be significantly substituted with only one index (perimeter-area ratio; PARA), which allows 50,4% accurate religious classification with 0,329 canonical correlation. Aggregation information could be represented effectively by IJI (Interspersion and Juxtaposition Index) and DIVISION (Landscape Division Index) indices in two different discriminant functions, leading to 60,5% classification accuracy (canonical correlations: 0,485 and 0,133). Two predicting functions could be formed also from the SHDI (Shannon’s Diversity Index) and SIDI (Simpson’s Diversity Index) indices, which two alone allow the best metric group based prediction: 63,6% (canonical correlations: 0,462 and 0,122), classifying 260 out of 409 German NUTS 3 regions religiously the same way as it would be done from the census data of 2011.
When the results of the discriminant analysis of all metric groups combined is interpreted, it must be seen, that the two aggregation variables are excluded (due to collinearity) from the model. Therefore their information can be find powerfully enough in other (most likely Area- Edge and Diversity) indices. This way, formulating two significant discriminant functions, 75% percent (307 out of 409) regions could be classified correctly (canonical correlations:
0,567 and 0,211). Therefore, by utilizing LSI, GYRATE, ED, PD, PARA, SHDI and SIDI spatial heterogeneity index values, the (reformation oriented) religious classification of German NUTS 3 regions can be predicted with 75% reliability.
Figure 6. Predicting religious categories of German NUTS 3 regions with different designs of discriminant functions of spatial heterogeneity indices
6. ábra A német NUTS 3 régiók vallási kategóriájának becslése kizárólag különböző tájsokféleségi mutató összeállításokkal (diszkriminancia analízis)
Conclusions and outlook
With a wild outlook: accepting the results of ANOVA and discriminant analysis above means, that not only the Great Wall of China, but also the cultural effect of reformation (regional distribution of protestant citizens of Germany) can be seen from space, with low resolution imagery. In fact, the Great Wall itself is not visible on low resolution imagery.
It also has to be acknowledged, that this effect is not directly represented, and it is influenced by many strong modifiers, such as the 1949-1989 division of the federal state, in which period the communist planned economy influenced spatial heterogeneity significantly (e.g.: size of agricultural parcels), while religious privacy of citizens have also not been guaranteed.
However, the relation between the analysed cultural and environmental factors is present.
Its logic can also observed not only in Germany but in Hungary as well (ANOVA). The processes, which influence/generate both or relate one to the other shall be investigated in a further in-depth research. Recent study shows that the in-depth research in this field would not stand for wasted time, and could contribute significantly to the understanding of the interactions between cultural and environmental effects, which lead to the birth of landscapes (Mőcsényi 1968).
Acknowledgments
The study has been supported by the Hungarian Ministry of Human Capacities, Remembrance Committee for Reformation (REB-16-1-KUTATAS-0007).
References
Csemez A. 1996: Tájtervezés - tájrendezés. Mezőgazda Kiadó; Budapest. 466 p. (translation by the author) Fülöp Gy. 2011: Opening for people – Automated landscape variability assessment in KEO system. 2011 Ispra;
Olaszország; VII. Conference on Image Information Mining: Geospatial Intelligence from Earth Observation. pp. 97–100.
Fülöp Gy. 2012: Optimized Pattern Size for land cover–land use information conversion. European Journal of Remote Sensing 45(1): 393–405.
Fülöp Gy. 2014/a: Mapping solution of Interscale Landscape Diversity Methodology. Journal of Agricultural Infromatics. 4(2): 43–52.
Fülöp Gy. 2014/b: With the Eyes of a Human: Combining IIM Solutions of INLAND (Interscale Landscape Diversity Modelling Methodology), Soille P., Marchetti P.G., Iapaolo M., Colaiacomo L., Datcu M.
(eds.): Proceedings of ESA-EUSC-JRC 9th Conference on Image Information Mining: The Sentinels Era. Bucharest, Romania. pp. 127–130.
Fülöp Gy. 2017: Földmegfigyelési adatokon alapuló tájváltozatossági mutatórendszer kialakítása statisztikai eszközökkel (doktori értekezés). Development of a landscape diversity index system with statistical tools based on Earth Observation data sources (doctoral dissertation). Szent István Egyetem Tájépítészeti és Tájökológiai Doktori Iskola, Budapest. 135 p.
Gustafson E.J. 1998: Quantifying Landscape Spatial Pattern: What is the State of Art? Ecosystems 1: 143–156.
McGarigal K. 2015: FRAGSTATS 4.2 Help [on-line]
http://www.umass.edu/landeco/research/fragstats/documents/fragstats.help.4.2.pdf [downloaded:
2015.03.26 9:15]
Mőcsényi M. 1968: A táj és a zöldterület fogalmi problémái a tájrendezés nézőpontjából. Településtudományi Közlemények 17(21): 66–76.
Openshaw S., Taylor P.J. 1979: A million or so correlation coefficients: three experiments on the modifiable areal unit problem. In: Wrigley N. (ed.): Statistical Applications in the Spatial Sciences. Pion, London.
pp. 127–144.
Openshaw S., Taylor P.J. 1981: The modifiable areal unit problem, in: Wrigley N., Bennett R. (eds.):
Quantitative Geography: A British View. Routledge and Kegan Paul, London. pp. 60–69.
Teleki P. 1937: A tájfogalom jelentőségéről (Rektori tanévnyitó beszéd a Műszaki és Gazdaságtudományi Egyetemen) Teleki, Pál gróf Különlenyomat a Budapesti Szemle 1937. évi novemberi füzetéből
Urban D.L., O’Neill R.V., Shigart H.H. 1987: Landscape Ecology. BioScience 37. pp. 119–27.
Waltz U. 2011: Landscape Structure; Landscape Metrics and Biodiversity. Living Reviews in Landscape Research 5(3): 1–35.
REFORMÁCIÓ ÉS HETEROGENITÁS – KULTURÁLIS ÉS KÖRNYEZETI MANIFESZTÁCIÓ KAPCSOLATA HÁROM TERÜLETI RÉGIÓ PÉLDÁJÁN
FÜLÖP GY.
2462 Martonvásár, Orgona út 17., e-mail: gyork.fulop@gmail.com
Kulcsszavak: térbeli sokféleség, reformáció, szociális hatás, ökológiai hatás, előzetes kutatás, területi statisztika, távérzékelés
A közölt feltáró munka a felszínborítás térbeli sokféleségének és – a reformáció által való területi érintettséget kifejezendő – a protestáns lakosság térbeli eloszlásának összefüggését vizsgálja. Az empirikus megközelítésű kutatásban történelmi és kulturális vizsgálatok nem szerepelnek, így a feltárni kívánt összefüggések és kölcsönhatások eredői nem kerülnek tárgyalásra. A fennálló viszonyok felderítése és áttekintése a cél: a társadalmi-kulturális tényező (reformáció) és a tájökológiai tényező (a felszínborítás sokfélesége) közt fennálló összefüggés megléte és általános minősége a feltett alapkérdés. Amennyiben az objektív megközelítésű vizsgálatok az összefüggés meglétét igazolják (ahogy valóban igazolják), egy – tájalakulási, vagy „táj- geneológiai” – hatásmechanizmusokat célzó részletes kutatás megvalósíthatósági tanulmánya olvasható a következőkben. A tanulmány objektív módon, három „mintaterület” – Magyarország, Németország és Románia – NUTS 3 régióinak térbeli statisztikai összehasonlításával írja le a célzott összefüggést. A vallási preferenciák leírására a 2011-es népszámlálás adatai, a felszínborítás sokféleségének jellemzésére a MODIS, alacsony felbontású műholdfelvételek segítségével számított tájváltozatossági indexek szolgáltak. A kutatási eredmények egy szignifikáns háttérhatás jellegű összefüggést mutatnak a térbeli sokféleség és a protestáns hívők térbeli eloszlása között. Az összefüggés megértését szolgáló kutatásnak a jövőben kell utat találnia az ok-okozati viszonyok felderítésére, a közölt kimenetek és eredmények csak az első lépéseket segítik elő: például a szignifikáns összefüggéseket feltáró tájmetriai indexek kimutatásával, átfogó leíró statisztikák közlésével és a fennálló háttérhatás (predikciós) magyarázó erejének meghatározásával.