Clinical Study
T-Cell Subsets in Rheumatoid Arthritis Patients on Long-Term Anti-TNF or IL-6 Receptor Blocker Therapy
Sonja Dulic,1Zsófia Vásárhelyi,2Florentina Sava,2László Berta,3Balázs Szalay,4 Gergely Toldi,2László Kovács,1and Attila Balog1
1Department of Rheumatology and Immunology, Faculty of Medicine, Albert Szent-Györgyi Health Center, University of Szeged, Szeged, Hungary
2First Department of Obstetrics and Gynecology, Semmelweis University, Budapest, Hungary
3First Department of Pediatrics, Semmelweis University, Budapest, Hungary
4Department of Laboratory Medicine, Semmelweis University, Budapest, Hungary
Correspondence should be addressed to Gergely Toldi; toldigergely@yahoo.com
Received 14 February 2017; Revised 22 May 2017; Accepted 19 July 2017; Published 25 October 2017
Academic Editor: Tânia Silvia Fröde
Copyright © 2017 Sonja Dulic et al. This is an open access article distributed under the Creative Commons Attribution License, which permits unrestricted use, distribution, and reproduction in any medium, provided the original work is properly cited.
Data on the impact of biological therapies on the T-cell phenotype in rheumatoid arthritis are limited. Here, we prospectively measured the percentages of 15 circulating T-cell subtypes using flow cytometry. We obtained transversal and longitudinal data in 30 anti-TNF responders, 19 secondary anti-TNF nonresponders, and 43 IL-6R antagonist responders, before, 8 weeks and at least 6 months after biological therapy. Untreated RA patients and healthy controls were also included. The important findings are the following: (1) the proportion of regulatory T-cells (Tregs) which are decreased in untreated RA patients becomes normal in all long-term-treated groups; (2) in anti-TNF responders as well as in nonresponders, the frequencies of naïve CD4+ and CD8+ cells are lower, whereas those of proinflammatory Th1, Th2, and Th17 cells and HLA-DR+-activated cells are higher than those in untreated RA or healthy controls; (3) in IL-6R responders, Th1 proportion is decreased, while that of Th2 and Th17 is increased as compared to that in anti-TNF-treated patients and controls; (4) pending confirmation, a CD4CD69 ratio<2.43 at baseline, could be useful to predict a good therapeutic response to anti-TNF therapy. This study provides comprehensive information regarding the long-term impacts of those biological therapies on the ecotaxis of T-cells in RA. The ClinicalTrials.gov registration number of our study is NCT03266822.
1. Introduction
Rheumatoid arthritis (RA) is the most common chronic autoimmune joint disease, which leads to progressive articu- lar destruction without treatment [1]. The abnormal function of CD4+ and CD8+ cells plays a key role in the autoimmune process leading to the development of RA. This is reflected by a number of observations indicating that the proportion of different CD4+ subsets responsible for the harmonized immune response is skewed to a proinflammatory direction.
The frequency of Th1, Th2 helper, and proinflammatory Th17 cells is increased [2, 3], while that of regulatory
T-cells (Treg) is decreased in the peripheral blood of RA patients [4–7]. Biological therapies, including monoclonal antibodies targeting tumor necrosis factor-α (TNF) and interleukin-6 receptor (IL-6R), have emerged as disease- modifying agents with much higher therapeutic potential than conventional immunosuppressive therapies. Little is known about how the alterations in the T-cell subset compo- sition are affected by anti-TNF or anti-IL-6R drugs. Few studies, including our previous examinations [7], followed T-cell subset prevalence changes, but in most of them, only short-term follow-up was evaluated [8–15]. As changes in cell numbers are supposed to require longer time, we
https://doi.org/10.1155/2017/6894374
presume that short-term follow-up may not be sufficient.
Furthermore, the number of patients was not high enough to capture subtle changes in cell proportions; moreover, some studies were not homogenized for disease activity or response to therapy, or only few types of cells were monitored. Data on the effects of IL-6R blocker therapy are especially limited [16–18].
Our knowledge about the long-term consequences of biological therapies is still insufficient. Data on the risk of the susceptibility to infections, efficacy of vaccination, or tumor development after several years of anti-TNF therapy are not yet conclusive [19, 20]. A detailed insight into how a sustained interference to the adaptive immune system with biological therapies skews the status of the adaptive immune system would provide useful information in this regard.
Furthermore, as only about 40% of patients respond with complete remission to anti-TNF or anti-IL-6R treatment, and the number of available therapies with different target specificities is increasing, there is a highly recognized need for predictors of a good response for every therapeutic agent to establish the choice of therapy in a personalized manner.
Although some soluble predictive biomarkers have been pro- posed [21, 22], predictors relating to the cellular component of the immune system, as identified through a long-term follow-up assessment, are lacking.
We aimed to answer the following questions: (1) Is the T-cell subset distribution different in RA patients on long- term (more than six-month duration) biological therapy as compared to the short-term data (baseline, i.e., biological therapy naive patients and short term: eight-week anti-TNF therapy)? (2) Is the immune phenotype different between anti-TNF responder and nonresponder patients? and (3) Are there any T-cell subtypes that can be used as predic- tors of the response to anti-TNF therapy? Finally, we wished to analyze the T-cell phenotype in patients on IL-6R blocker therapy.
Herein, we present a detailed description of the T-cell phenotype of RA patients on established biological therapies, obtained with two approaches: (1) a cross-sectional analysis of a high number of RA patients on a long-term treatment with anti-TNF or anti-IL-6R therapies; (2) we present the long-term follow-up results of our prospective study of anti-TNF-treated RA patients, in whom these parameters have serially been measured from the start of the anti-TNF treatment (short-term follow-up data have been published in [7]). The evaluation of the long-term outcome of anti- TNF therapy enabled us to evaluate which T-cell subset changes may be predictive of a long-standing therapeutic response to these treatment agents.
2. Patients and Methods
2.1. Patients.In the cross-sectional analysis, 92 RA patients (who had been treated with biological therapy for more than six months) were evaluated. All of them are treated at the Department of Rheumatology and Immunology, University of Szeged. Rheumatoid arthritis was classified according to the 2010 ACR/EULAR classification criteria for RA [23].
49 patients were treated with anti-TNF therapy (adalimumab
n= 14, certolizumab pegoln= 14, etanerceptn= 11, inflixi- mab n= 6, and golimumab n= 4 patients) and 43 patients with the anti-IL-6R agent tocilizumab. Within the anti- TNF-treated RA patients, we distinguished anti-TNF responder or anti-TNF nonresponder patients. For the defi- nition of the therapeutic response, we used the EULAR good response criteria [24]; therefore, in the responder group, patients had a DAS28 score of ≤3.2, and its improvement since the initiation of the biological therapy was>1.2. Since there were insufficiently low numbers of IL-6R antagonist nonresponder patients within our patient population, we included only IL-6R blocker responders in this study.
We compared their results with newly diagnosed, untreated RA patients (n= 19). Treatment-naïve, early RA patients had not received any anti-RA treatment prior to our study. The measurements on this cohort of patient have been published earlier [7]. The detailed clinical data and patient characteristics are presented in Table 1. ACPA was measured using ELISA-based routine laboratory methods with specificity to mutated citrullinated vimentin.
As a further control group (healthy controls), we enrolled 30 age- and gender-matched healthy volunteers (18 men, 12 women; mean age 52.4 years range (24–63.5). All of them had a negative history of RA symptoms and a negative status upon detailed physical and laboratory examination including normal CRP and ESR values.
The prospective follow-up cohort included 13 of the anti- TNF-treated patients, in whom T-cell frequency values at the initiation of anti-TNF therapy and 8 weeks thereafter were measured earlier [7]. Six of them have become (secondary) nonresponders in the long-run (i.e., since the completion of the short-term follow-up), whereas 7 of them remained to be long-term responders to anti-TNF therapy. Average age of these 13 patients was 59 (39–65) years, and the mean duration of anti-TNF treatment was 27 (11–52) months;
there was no statistically significant difference between the two groups in either of these parameters. The conditions of the present laboratory measurements and all the clinical assessments were fully identical to those described for the study on therapy-naïve patients and those on short-term anti-TNF therapy [7].
Informed consent was signed by all participants, and the protocol had been approved by the Ethics Committee of the Ministry of Health of Hungary and Ethics Committee of the University of Szeged (ETT-TUKEB905/PI/09).
2.2. Flow Cytometry Measurements. Blood samples were taken in the laboratory unit of the Department of Rheuma- tology and Immunology. We used 15 ml of anticoagulated blood and separated the peripheral blood mononuclear cells (PBMCs) by centrifugation with Ficoll-Paque (GE Health- care Life Sciences, Pittsburgh, PA, USA). PBMCs were frozen and kept at−80°C until analysis. After thawing, samples were washed twice with phosphate-buffered saline solution (pH 7.4). We usedfluorescent antibodies (Becton Dickinson, San Diego, CA, USA) for cell surface staining according to the manufacturer’s manual.
Cell subtypes were defined as helper T-cells (CD4+), Th1 cells (CD4+CXCR3+), Th2 cells (CD4+CCR4+CCR6−),
Table1: Clinical data and patient characteristics.
Anti-TNF
responders (n= 30) Anti-TNF
nonresponders (n= 19) Anti-IL-6R
responders (n= 43) Newly diagnosed untreated RA (n= 19)
Mean age (range) 57.2 (26–75) 55.7 (29–71) 57.5 (34–76) 48.3 (22–67)#
Gender (female/male) 19/11 12/7 28/15 11/8
Anti-TNF treatments 30 (100.0) 19 (100.0)
n(%) adalimumab 10 (33.3) 4 (21.1)
Certolizumab 6 (20.0) 8 (42.1)
Etanercept 7 (23.3) 4 (21.1)
Infliximab 4 (13.3) 2 (10.5)
Golimumab 3 (10.0) 1 (5.3)
Mean disease duration (range) 11.3 (2–33) yrs 10.8 (4–44) yrs 12.0 (2–34) yrs 2.7 (1–3) months
Adalimumab 11.9 (3–24) 11.8 (5–19)
Certolizumab 10.7 (2–31) 10.2 (4–44)
Etanercept 12.4 (2–33) 11.0 (5–26)
Infliximab 13.5 (4–22) 12.0 (5–19)
Golimumab 8.0 (3–16) 9.0
Mean duration of current biological
therapy months (range) 29.8 (6–52) 30.95 (6–50) 33.0 (6–48) —
Adalimumab 35.1 (6–52) 30.8 (24–48)
Certolizumab 28.2 (8–42) 29 (6–43)
Etanercept 26.7 (7–41) 36.8 (18–50)
Infliximab 27.6 (10–33) 22.5 (8–37)
Golimumab 31.4 (11–42) 41
Prior use of TNF inhibitors 3/30 6/19 29/43 —
No. of switching,
n: 1 3/3 4/6 15/26
2 — 2/6 9/26
3 — — 5/26
Patients on corticosteroid therapyn(%) 8 (26.7) 8 (42.1) 15 (40.5) —
Adalimumab 3/10 1/4
Certolizumab 1/6 3/8
Etanercept 2/7 2/4
Infliximab 2/4 1/2
Golimumab 0/3 1/1
Patients on conventional DMARD
therapyn(%) 26 (86.7) 15 (79.0) 23 (62.2)∗ —
Adalimumab 8/10 3/4
Certolizumab 5/6 6/8
Etanercept 6/7 3/4
Infliximab 4/4 2/2
Golimumab 3/3 1/1
ACPA positivityn(%) 24 (85.4) 14 (82.4) 21 (41.4)∗ 19 (100.0)
Adalimumab 8/10 3/4
Certolizumab 5/6 6/8
Etanercept 5/7 2/4
Infliximab 3/4 2/2
Golimumab 3/3 1/1
Th17 cells (CD4+CCR4+CCR6+), Tregs (CD4+CD25 high), naive T-cells (CD4+CD45RA+), or memory T-cells (CD4+CD45RO+). The proportion of cells expressing early (CD69), intermediate (CD25), or late (HLA-DR) activation markers was also determined within both the CD4+ and CD8+ subsets. An average of 200,000 cells were registered for each acquisition. All measurements were performed on a BD FACSAria flow cytometer (Becton Dickinson, San Jose, CA, USA). Cell proportion values were determined with conventional gating, through the use of FACSDiva software (Becton Dickinson, San Jose, CA, USA). Figure 1 represents the gating strategy of T-helper subsets.
2.3. Statistical Methods.Data are presented as mean±SD or median (25–75 percentile) depending on the distribution of the values. Cell subset percentage values were compared among groups with analysis of variance or with Kruskal- Wallis test, with Bonferroni’s or Dunn’s tests for multiple comparisons, respectively. Predictive value of baseline per- centage values to subsequent response to anti-TNF therapy was assessed with ROC analysis. Apvalue<0.05 was taken as statistically significant.
3. Results
3.1. Patient Characteristics. Thirty of the 49 anti-TNF RA patients were responders and 19 were nonresponders, while all of the 43 IL-6R-treated RA patients were responders. As it can be seen in Table 1, mean ages, disease duration, and the proportion of patients who were on low-dose corticoste- roid therapy in these three groups were not different. Fewer IL-6R responders took traditional DMARDs than the anti-TNF-treated patients, and the proportion of anti- citrullinated peptide antibody- (ACPA-) positive patients was also lower in the IL-6R blocker-treated group. The newly diagnosed untreated RA patients were slightly younger than the long-term-treated patients; all of them were ACPA- positive, and they had the highest mean DAS28 score.
3.2. Immunophenotype of Patients with RA on Long-Standing Anti-TNF Therapy.The proportions and ratios of various T- cell subsets are demonstrated in Table 2 and Figures 2 and 3.
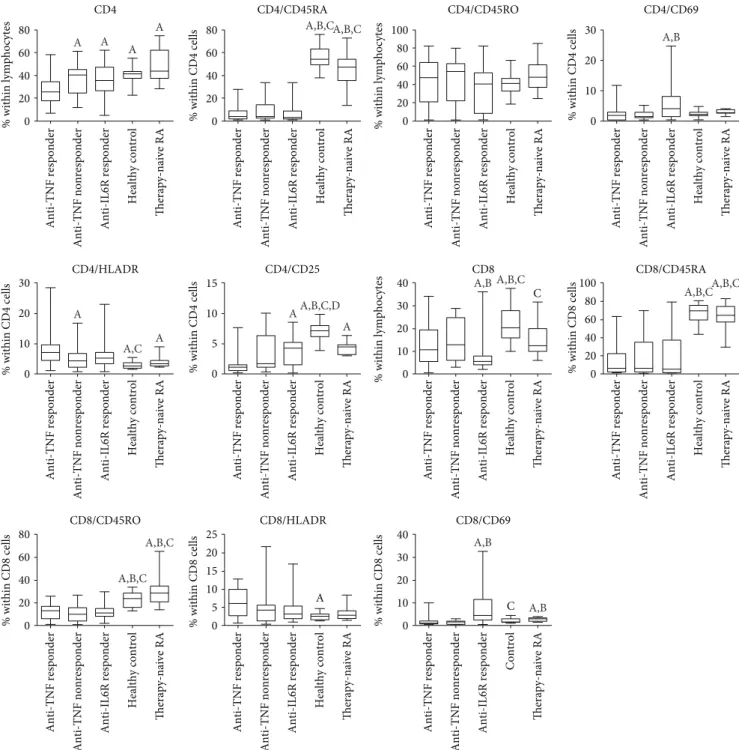
3.3. Anti-TNF Responders.As compared with early, active, untreated RA, anti-TNF responders had lower proportions
of CD4+ cells, naïve CD4+ and CD8+ cells and memory CD8+ cells, and higher percentages of activated CD4+ T- cells with HLADR marker positivity, but lower prevalences of CD4+ cells with CD25 and of CD8+ T-cells with CD69 marker positivity. Anti-TNF responders were characterized by higher Th1 and Treg frequencies than early active, untreated RA patients.
When compared with healthy controls, anti-TNF responders had lower proportions of CD4+ and CD8+
T-cells. The frequencies of naive T-cells (both CD4+ and CD8+CD45RA+ cells) were lower compared with controls, whereas those of the memory subtype (CD45RO+) were similar among CD4+ cells and were also lower among CD8+
cells in the anti-TNF responders than in healthy volunteers.
The proportion of activated T-cells bearing the CD25 marker was lower and that of the HLA-DR+ cells (both CD4+ and CD8+) was higher in anti-TNF responders than in controls (Figure 2). In anti-TNF responders, Th1, Th2, and Th17 proportion values were all higher than those in healthy controls, but, importantly, Treg frequencies were not different (Figure 3).
3.4. Anti-TNF Nonresponders. There are somewhat less differences between the T-cell composition of anti-TNF non- responders and early untreated RA patients, but naïve T-cells (both CD4+ and CD8+) and also CD8+ memory cells are less prevalent in anti-TNF nonresponders, similarly to CD8CD69+-activated cells. A comparison with healthy con- trols also revealed that anti-TNF nonresponders had lower proportions of CD4+ and CD8+ naïve and CD8+ memory T-cells; furthermore, CD4+CD25+-activated T-cells also occurred less frequently in the anti-TNF nonresponders than in the healthy subjects. The percentage of CD8+ cells was lower in anti-TNF nonresponders than in controls, but, in contrast with anti-TNF responders, CD4+ cell prevalence was not different from controls (Figure 2). Similarly to the anti-TNF responders, Th17 and Th2 percentages were also higher in nonresponders than in the controls, and, again, Treg frequencies were equal to the healthy controls (Figure 3).
The differences between anti-TNF responders and non- responders, as revealed in this analysis, were significantly lower percentages of total CD4+ and higher proportion of CD4+HLA-DR+ T-cells in anti-TNF responders as com- pared with anti-TNF nonresponders.
Table1: Continued.
Anti-TNF
responders (n= 30) Anti-TNF
nonresponders (n= 19) Anti-IL-6R
responders (n= 43) Newly diagnosed untreated RA (n= 19)
DAS 28 score (mean±SD) 2.2±0.8 5.12±1.29+ 1.89±0.87 7.71±4.06#
Adalimumab 2.16±0.79 4.64±1.35
Certolizumab 2.09±1.18 5.53±0.82
Etanercept 1.70±0.48 5.18±1.98
Infliximab 3.00±0.92 4.95±0.27
Golimumab 2.36±0.47 4.21±0.00
∗p< 0 05between anti-TNF responders and IL-6R blocker responders.+p< 0 05between anti-TNF nonresponders and IL-6R blocker responders,#p< 0 05 between newly diagnosed untreated RA group and all other groups. DMARD: disease-modifying antirheumatic drug; ACPA: anti-citrullinated protein antibody; DAS28: disease activity score with 28 joints; TNF: tumor necrosis factor alpha; IL-6R: interleukin-6 receptor.
3.5. Immunophenotype of Patients with RA on Long-Standing IL-6 Receptor Blocker Therapy.Most important differences between the T-cell composition of RA patients on effective IL-6R blocker therapy and early, active, untreated RA patients are the strikingly low number of CD8+ cells and the higher prevalence of Th17 and Treg cells in the IL-6R blocker- treated patients. Naive T-cell (both CD4+ and CD8+) and CD8+ memory cell proportions were lower in anti-IL-6R- treated RA patients (Figures 2 and 3). As compared with healthy subjects, some further differences can also be observed: higher prevalence of Th2 cells and of CD4+HLA- DR+- and CD8+CD69+-activated T-cells than in controls.
Comparisons between anti-IL-6R responders and anti- TNF responders reveal significantly higher CD4+ and lower CD8+ T-cell frequencies with anti-IL-6R therapy (Figure 2).
Anti-IL-6R responders had the lowest proportion of Th1 cells in all the examined groups, and this difference was significant from both anti-TNF responders and anti-TNF nonre- sponders (Figure 3). On the contrary, the proportions of Th2 and Th17 cells were higher among anti-IL-6R responders
than in anti-TNF-treated RA patients including anti-TNF responders and anti-TNF nonresponders. Nevertheless, similarly to anti-TNF-treated groups, Treg frequencies were normal (Figure 3). With regards to the activated T-cell subsets, anti-IL-6R therapy was associated with higher per- centages of CD69+ T-cells, within both the CD4+ and the CD8+ subsets, than anti-TNF therapy, and CD4+CD25+ cells were also more prevalent in anti-TNF responders (Figure 2).
3.6. Time-Course of the Changes in the T-Cell Subset Distribution in RA Patients on Long-Standing Anti-TNF Therapy.We compared the T-cell subset proportion values from the beginning of the disease in 13 patients (7 anti- TNF responders and 6 anti-TNF nonresponders). As compared with the baseline values (at disease onset, before anti-TNF therapy initiation), percentages of total CD4+
T-cells, CD4+ and CD8+ naive T-cells decreased (Figure 4), but those of Tregs increased over time in both anti-TNF responders and anti-TNF nonresponders (Figure 5). Th1 and Th17 proportions increased only in the anti-TNF
250k 200k 150k
SSC CD4 PE-Cy7
CD4 PE-Cy7
CCR4 PECXCR3 APC
100k 50k 0
250k
105 Treg 104
103
103
105 104
105 104
103
‒103
‒103 103 104 105
106 105 104 103
102 101 100
0 1.2
900
CD4+
Count 600
300 0
0 Th1
Th2 0
CCR6 PerCP
CCR4 PE 10‒1
10‒1 101 103 105 107 104 105 0
CD25 FITC
Th17 0
‒103
‒103 200k
150k FSC 100k 50k
Lymphocyte
0
K
Figure1: Gating strategy for the identification of T-helper cell subsets withflow cytometry. FSC: forward scatter characteristics; SSC: side scatter characteristics.
Table2:PrevalencevaluesofthevariousT-cellsubsetsintheexaminedpatientgroupsandcontrols. CD4CD4/ CD45RACD4/ CD45ROCD4/ CD69CD4/ HLADRCD4/ CD25CD8CD8/ CD45RACD8/ CD45ROCD8/ HLADRCD8/ CD69Th1Th2Th17Treg Anti-TNFresponders
Median25.903.3747.151.637.181.1610.705.6912.856.020.9521.008.032.815.89 25% percentile17.431.5420.680.464.440.565.392.275.1732.630.4616.707.142.254.34 75% percentile33.938.4663.852.8459.621.5219.3022.0017.009.742.1523.789.353.266.85 Anti-TNF nonresponders
Median40.8a 4.1353.901.314.33a 1.7112.807.189.4804.101.2718.408.193.295.80 25% percentile24.502.5522.101.072.391.096.002.083.5501.200.596.906.7401.414.64 75% percentile44.9014.0062.502.706.916.3924.7035.2015.405.412.0121.6011.204.407.21 aIL-6Rresponders
Median35.4a 3.0240.004.14a,b 5.354.38a 5.71a,b 4.9610.702.884.47a,b 5.48a,b 12.50a 5.01a,b 4.75 25% percentile26.61.528.6201.463.321.504.002.017.3701.642.253.048.5403.954.08 75% percentile47.308.3752.808.107.165.358.1237.7014.805.1911.5016.0014.405.875.65 Newlydiagnosed untreatedRApatients
Median43.9a 46.55a,b,c 48.602.723.47a 4.57a 12.40c 64.80a,b,c 28.25a,b,c 2.772.59a,b 12.15a 9.251.76c 3.14a,b,c 25% percentile37.0534.9037.252.362.973.199.7857.4821.051.841.7710.208.841.612.81 75% percentile62.0354.2361.633.514.584.8620.0574.3334.153.983.3814.7011.001.983.66 Healthycontrols
Median41.55a 52.65a,b,c 41.552.42.80a,c 7.13a,b,c,d 19.64a,b,c 69.20a,b,c 23.65a,b,c 2.3a 1.88c 10.75a 5.79a,b,c,d 1.04a,b,c 5.17d 25% percentile37.549.1535.8751.842.476.1415.7259.7715.81.651.379.224.850.784.44 75% percentile43.6562.63849.42.853.887.7924.1275.7728.22.923.0812.377.091.195.91 Numbersindicatethemedianpercentagesand25%and75%percentilevalueswithinthewholeT-cellpopulation(CD4andCD8cells),orwithinCD4cells(Th1,Th2,Th17,Treg,andratios),orfortheother markerswithintheCD4orCD8cells,asindicated.a p<005versusanti-TNFresponder,b p<005versusanti-TNFnonresponder,c p<005versusanti-IL-6receptorresponder,d p<005versusnewly diagnoseduntreatedRApatients.TNF:tumornecrosisfactoralpha;IL-6R:interleukin-6receptor.
responder group, and Th2 cell frequencies increased only within the anti-TNF nonresponders (Figure 5). CD4+
CD69+ cell proportion decreased in the anti-TNF nonre- sponders (p< 0 05with ANOVA, but no significant differ- ences with Bonferroni’s correction), and CD4+HLA-DR+
cell percentages increased only in the anti-TNF responders (Figure 5). Among CD8+ cells, memory T-cells became less prevalent during the course of the disease only in the
anti-TNF nonresponders, while HLA-DR+-activated cell fre- quency was gradually rising in the anti-TNF responder group only. As it can be seen in Figures 4 and 5, most of these changes have become evident only after long-term follow-up.
3.7. The Impact of the Length of the Biological Therapy on T-Cell Subsets in Long-Term-Treated RA Patients.Since the duration of biological therapies was highly variable among
Anti-TNF responder Anti-TNF nonresponder Anti-IL6R responder Therapy-naive RA
Healthy control Anti-TNF responder Anti-TNF nonresponder Anti-IL6R responder Therapy-naive RA
Healthy control
80 60
A
C
CD4 CD4/CD45RA CD4/CD45RO CD4/CD69
CD4/HLADR CD4/CD25 CD8
CD8/CD45RO CD8/HLADR CD8/CD69
CD8/CD45RA 40
% within lymphocytes% within lymphocytes
% within lymphocytes % within CD4 cells
% within CD4 cells % within CD4 cells % within CD4 cells% within CD8 cells
% within CD8 cells
% within CD8 cells
% within CD8 cells
20 0
80 60 40 20 0
25 20
10 15 5 0 80 60 40 20 0
40 30 20 10 0
40 30 20 10 0 80 100
60 40 20 0
80 100
60 40 20 0 20 30
10 0
20 30
10 0
10 15
5 0
Anti-TNF responder Anti-TNF nonresponder Anti-IL6R responder Therapy-naive RA
Healthy control Anti-TNF responder Anti-TNF nonresponder Anti-IL6R responder Therapy-naive RA
Healthy control
Anti-TNF responder Anti-TNF nonresponder Anti-IL6R responder Therapy-naive RA
Healthy control Anti-TNF responder Anti-TNF nonresponder Anti-IL6R responder Therapy-naive RA
Healthy control Anti-TNF responder Anti-TNF nonresponder Anti-IL6R responder Therapy-naive RA
Healthy control Anti-TNF responder Anti-TNF nonresponder Anti-IL6R responder Therapy-naive RA
Healthy control
Anti-TNF responder Anti-TNF nonresponder Anti-IL6R responder Therapy-naive RA
Healthy control Anti-TNF responder Anti-TNF nonresponder Anti-IL6R responder Therapy-naive RA
Healthy control Anti-TNF responder Anti-TNF nonresponder Anti-IL6R responder Therapy-naive RA
Control
C
A A
A
A A,B,CA,B,C
A,B
A
A
A
A A,C
A,B,C,D
A,B A,B,C A,B,C
A,B,C
A,B,C
A,B,C A,B
A,B
Figure 2: Proportions of various T-cell subsets in rheumatoid arthritis patient groups of anti-TNF responders (n= 30), anti-TNF nonresponders (n= 19), and IL-6R blocker responders (n= 43), early, active, therapy-naïve RA patients (n= 19), and healthy controls (n= 30). Data are presented as median (horizontal line within boxes), 25 and 75 percentile (horizontal borders of the boxes), and minimum and maximum (whiskers). Ap< 0 05 versus anti-TNF responder, Bp< 0 05versus anti-TNF nonresponder, Cp< 0 05versus IL-6R blocker responder,Dp< 0 05versus early, untreated RA patients.
long-term-treated RA patients (ranging from 6 to 52 months), the question may arise whether this wide time span could have an impact on the long-term effects of biologicals on the T-cell composition. We therefore further stratified the patients according to the duration of long-term biological therapy to“short”(6–12 months),“medium”(12–18 months), and“long”(>18 months) duration of treatment. Comparison among these subgroups has revealed that only two of the examined 15 T-cell subtypes displayed a significant variabil- ity across these three subgroups: the prevalences of CD4+
CD45RA+ and CD8+CD45RA+ naive cells decrease gradu- ally among the three subgroups with longer treatment duration and reach a significance ofp< 0 05in the compar- ison between long-term duration versus the other two subgroups. All the other parameters have remained stable irrespective of the length of biological therapy (Table 3).
3.8. The Impact of Previous Switching of Anti-TNF Agents on T-Cell Subsets.As it can be seen in Table 1, in some patients (especially in the IL-6R blocker-treated group), the biological agent applied at the time of sampling was not the first one, but there were previous switches from other anti-TNF drugs.
Although these switches occurred more than 6 months before the blood sampling, we wanted to know whether the previous changes in therapy may have influenced the T-cell phenotype. We therefore compared the patient subgroups as defined by the number of previous switches in all thera- peutic groups (Table 4). This analysis revealed that the proportions of CD4+CD69+ and of CD8+CD69+ cells were higher in IL-6R responder patients who had experienced three switches before the current therapy than in those who had only one switch before (Figure 6). Opposite difference was observed with regard to Th1 percentage.
Anti-TNF responder Anti-TNF nonresponder Anti-IL6R responder Therapy-naive RA
Healthy control Anti-TNF responder Anti-TNF nonresponder Anti-IL6R responder Therapy-naive RA
Healthy control
Anti-TNF responder Anti-TNF nonresponder Anti-IL6R responder Therapy-naive RA
Healthy control Anti-TNF responder Anti-TNF nonresponder Anti-IL6R responder Therapy-naive RA
Healthy control
% within CD4 cells% within CD4 cells % within CD4 cells% within CD4 cells
30 20 10 0 40
Th1 cells Th2 cells
Th17 cells Regulatory T-cells
20 15
15
10
5
0
15
10
5
0 10 5 0 A,B
A A
A
A,B,C,D
A,B
A,B,C C
D
A,B,C
Figure3: Proportions of the major effector T-helper cell subsets in rheumatoid arthritis patient groups of anti-TNF responders (n= 30), anti- TNF nonresponders (n= 19), and IL-6R blocker responders (n= 43), early, active, therapy-naïve RA patients (n= 19), and healthy controls (n= 30). Data are presented as median (horizontal line within boxes), 25 and 75 percentile (horizontal borders of the boxes), and minimum and maximum (whiskers). Ap< 0 05 versus anti-TNF responder, Bp< 0 05versus anti-TNF nonresponder, Cp< 0 05versus IL-6R blocker responder,Dp< 0 05versus early, untreated RA patients.
3.9. Differences among the Various Anti-TNF Agents.When we compared the T-cell subset proportions among the 5 anti-TNF agents individually (including adalimumab, eta- nercept, certolizumab, golimumab, and infliximab) and
between the particular anti-TNF drugs and anti-Il-6R responders or healthy controls, only one significant differ- ence was revealed in addition to the comparisons when the anti-TNF drugs were considered as one single group:
80 60
CD4 CD8 CD4 CD25 CD4 CD45RA
CD4 CD45RO CD4 CD69 CD4 HLA-DR
CD8 CD45RO CD8 CD69 CD8 HLADR
CD8 CD45RA 40
% among lymphocytes % among lymphocytes % among CD4+ cells
% among CD4+ cells % among CD4+ cells % among CD4+ cells % among CD8+ cells
% among CD8+ cells
% among CD8 cells
% among CD8+ cells % among CD4+ cells
20 0
80 100 60 40 20 0
80 100 60 40 20 0
20 25 15 10 5 0 6
8
4 2 0
6 8 10
4 2 0
20 30
10 0
80 60 40 20 0 40
30 20 10 0
40 30 20 10 0
15 10 5 0
Baseline aTNF nonresponder Short-term aTNF nonrespoder Long-term aTNF nonresponder Baseline aTNF responder Short-term aTNF responder Long-term aTNF responder Baseline aTNF nonresponder Short-term aTNF nonrespoder Long-term aTNF nonresponder Baseline aTNF responder Short-term aTNF responder Long-term aTNF responder Baseline aTNF nonresponder Short-term aTNF nonrespoder Long-term aTNF nonresponder Baseline aTNF responder Short-term aTNF responder Long-term aTNF responder Baseline aTNF nonresponder Short-term aTNF nonrespoder Long-term aTNF nonresponder Baseline aTNF responder Short-term aTNF responder Long-term aTNF responder
Baseline aTNF nonresponder Short-term aTNF nonrespoder Long-term aTNF nonresponder Baseline aTNF responder Short-term aTNF responder Long-term aTNF responder Baseline aTNF nonresponder Short-term aTNF nonrespoder Long-term aTNF nonresponder Baseline aTNF responder Short-term aTNF responder Long-term aTNF responder Baseline aTNF nonresponder Short-term aTNF nonrespoder Long-term aTNF nonresponder Baseline aTNF responder Short-term aTNF responder Long-term aTNF responder Baseline aTNF nonresponder Short-term aTNF nonrespoder Long-term aTNF nonresponder Baseline aTNF responder Short-term aTNF responder Long-term aTNF responder
Baseline aTNF nonresponder Short-term aTNF nonrespoder Long-term aTNF nonresponder Baseline aTNF responder Short-term aTNF responder Long-term aTNF responder Baseline aTNF nonresponder Short-term aTNF nonrespoder Long-term aTNF nonresponder Baseline aTNF responder Short-term aTNF responder Long-term aTNF responder Baseline aTNF nonresponder Short-term aTNF nonrespoder Long-term aTNF nonresponder Baseline aTNF responder Short-term aTNF responder Long-term aTNF responder A,B
A
A
A,B
A,B
A
A,B A,B
A,B
A,B
Figure4: Changes in the proportions of T-cell subsets in RA patients in whom long-term follow-up data from the initiation of anti-TNF therapy were available (n= 13). 7 patients from the initial short-term cohort (7) proved to be long-term responders, whereas the other 6 patients lost the initial response and therefore belonged to the nonresponder group. Measurement time points: baseline: at anti-TNF initiation, short term: 8 weeks of anti-TNF treatment (previously published data (7)), long-term: current measurement results after long- standing anti-TNF treatment. Data are presented as median (horizontal line within boxes), 25 and 75 percentile (horizontal borders of the boxes), and minimum and maximum (whiskers).Ap< 0 05versus baseline,Bp< 0 05versus short term.
the frequencies of CD4+CD45RO+ cells were higher among etanercept-treated patients (responders and nonre- sponders taken together) than among IL-6R blocker responders. The effect of the various anti-TNF agents on the immunophenotype of the RA patients was not differ- ent (Table 5).
3.10. Relationship between Baseline T-Cell Subset Prevalences and Response to Therapy. Through the analysis of the pro- spective follow-up cohort, in which we compared the T-cell subset frequencies at baseline (i.e., at the start of the anti-
TNF therapy), short-term (8 weeks), and long-term therapies, we examined whether any baseline parameters are predictive of the long-term response to anti-TNF therapy.
The proportion of CD4+CD69+ T-cells at baseline (2.16±0.12 versus 2.69±0.16, p= 0 08) and at 8 weeks (2.01±0.20 versus 2.81±0.28, p= 0 03) was lower in those who later belonged to anti-TNF responders than in those who became anti-TNF nonresponders. ROC analysis revealed that a CD4+CD69+ T-cell percentage<2.43 at baseline predicts a future response to anti-TNF therapy with a like- lihood ratio of 4.29 (CI: 0.58–1.06) and discriminates
A Th1
25 20 15 10 5 0
Baseline aTNF nonresponer
% among CD4+ cells Short-term aTNF nonresponder Long-term aTNF nonresponder Baseline aTNF responder Short-term aTNF responder Long-term aTNF responder
Th2 25
10
5
0
% among CD4+ cells
Th17
A,B 25
10
5
0
% among CD4+ cells
Treg 25
10
5
0
% among CD4+ cells
B
Baseline aTNF nonresponer Short-term aTNF nonresponder Long-term aTNF nonresponder Baseline aTNF responder Short-term aTNF responder Long-term aTNF responder
Baseline aTNF nonresponer Short-term aTNF nonresponder Long-term aTNF nonresponder Baseline aTNF responder Short-term aTNF responder Long-term aTNF responder Baseline aTNF nonresponer Short-term aTNF nonresponder Long-term aTNF nonresponder Baseline aTNF responder Short-term aTNF responder Long-term aTNF responder A,B
A A,B
Figure5: Changes in the proportions of the major effector T-helper cell subsets in RA patients in whom long-term follow-up data from the initiation of anti-TNF therapy were available (n= 13). 7 patients from the initial short-term cohort (7) proved to be long-term responders, whereas the other 6 patients lost the initial response and therefore belonged to the nonresponder group. Measurement time points:
baseline: at anti-TNF initiation, short term: 8 weeks of anti-TNF treatment (previously published data (7), long-term: current measurement results after long-standing anti-TNF treatment. Data are presented as median (horizontal line within boxes), 25 and 75 percentile (horizontal borders of the boxes), and minimum and maximum (whiskers). Ap< 0 05 versus baseline, Bp< 0 05 versus short term.
Table3:Subgroupanalysisinthelong-term-treatedRApatientgroupsaccordingtothelengthofthebiologicaltherapy. CD4CD4/ CD45RACD4/ CD45ROCD4/ CD69CD4/ HLADRCD4/ CD25CD8CD8/ CD45RACD8/ CD45ROCD8/ HLADRCD8/ CD69Th1Th2Th17Treg Anti-TNF responders
“Short”
Median25.354.60a 46.951.958.031.009.184.68a 5.972.900.5618.27.512.494.67 25% percentile32.477.7360.322.749.131.6219.4546.7018.1010.512.5023.159.023.356.82 75% percentile25.354.6046.951.958.031.009.184.685.972.900.5618.27.512.494.67 “Mid”
Median31.258.14a 49.25a 1.925.581.1613.0514.11a 15.254.011.1020.77.762.905.57 25% percentile26.654.0645.451.325.360.8810.295.6712.221.840.6318.87.172.564.88 75% percentile36.7710.5766.822.697.891.2416.0731.4517.955.961.6223.4710.053.356.11 “Long”
Median22.201.7937.300.846.021.108.573.9710.856.820.7819.908.062.386.43 25% percentile16.701.2813.690.234.350.514.631.084.363.030.4916.656.992.174.30 75% percentile32.872.9156.002.5912.571.7717.976.3214.209.741.0923.779.003.046.86 Anti-TNF nonresponders
“Short”
Median41.003.4953.201.075.891.599.542.085.725.410.6118.707.964.934.44 25% percentile30.903.2426.801.033.780.977.621.553.162.820.5812.797.512.854.32 75% percentile41.3010.9957.853.027.255.5218.8711.6916.119.350.6220.4511.235.125.70 “Long”
Median40.154.5255.701.374.202.3213.357.4511.194.071.3618.258.702.715.86 25% percentile25.622.4722.921.152.601.166.332.406.861.331.0511.926.651.455.45 75% percentile44.9213.1762.672.636.295.6520.5736.1214.874.672.0721.5211.124.207.81 Anti-IL-6R responders
“Short”
Median31.703.9628.75.194.174.285.793.478.522.883.684.8313.005.194.69 25% percentile25.301.8117.71.852.521.503.731.717.371.461.763.409.313.094.01 75% percentile42.408.0342.78.105.834.786.969.9615.204.2311.5013.6014.306.195.83 “Mid”
Median27.053.2147.753.635.654.305.414.549.702.926.967.4111.214.694.75 25% percentile25.772.516.411.353.511.074.042.898.151.603.373.446.743.274.58 75% percentile36.2510.0464.606.410.476.028.8232.4812.308.2210.2917.8216.405.385.00