Hungarian Geographical Bulletin 63 (2) (2014) 135–157.
DOI: 10.15201/hungeobull.63.2.2
Ethnic diversity and polarization in Vojvodina
1Áron LÉPHAFT, Ádám NÉMETH and Péter REMÉNYI2
Abstract
From a methodological perspective, this paper aims to demonstrate that ethnic diversity can be an objectively measurable notion, thus multi-ethnicity may have its own ‘units of measurement’. However, while the Hungarian geographic literature has concentrated by now on only the fragmentation (i.e. ‘Ethnic Diversity Index’), another type of diversity should be also defi ned: the phenomenon called polarization when two or maximum three ethnic groups with nearly equal population number are present. Using the so-called
‘ethnic polarization index’ our paper emphasizes that the increase or decrease of diversity cannot be described as a two-dimensional process. Thus in our case study of Vojvodina not only the homogenizing and diversifying territories are outlined, where the minorities are shrinking, and conversely where the minorities increase their rate at the expense of the majority. Since both homogenization and diversifi cation can result in polarization, it does also matt er, which way the balance will shift regarding polarization. Taking into consideration the broad scale of potential impacts of ethnic polarization on social, economic and political spheres (e.g. on the risk of confl icts), we fi nd it important to underline that human geography and sociological research in the future should focus on the polarizing territories as well which have been defi ned in our study.
Keywords: ethnic diversity, polarization, Vojvodina, Serbia
Introduction
The issues related to the coexistence of groups with diff erent ethnic, religious and cultural background have long been in the forefront of human geography.
In Hungary, due to its peculiar history, ethnic studies have been given special
1 This research was supported by the European Union and the State of Hungary, co-fi nanced by the European Social Fund in the framework of TÁMOP-4.2.4.A/2-11/1-2012-0001
‘National Excellence Program’ OTKA research project no. 75624 provided the research infrastructure
2 University of Pécs, Institute of Geography, H-7624 Pécs, Ifj úság u. 6.
E-mails: haft @gamma.tt k.pte.hu, nemethadam@gamma.tt k.pte.hu, remko@gamma.tt k.pte.hu
att ention not only in geography but also in many other sciences. A renais- sance of ethno-cultural studies took a fresh start in the last decades of the 20th century, when many saw the motives for future confl icts in the cultural fault lines instead of the ideological opposition of a bipolar world (Huntington, S.P. 1996).
A number of international confl icts have recently occurred with diff er- ent intensity and at various levels in which the ethnic, religious or ‘civilizatory’
factors cannot be neglected (Yugoslav confl ict, Rwandan confl ict, Middle East set of confl icts, Caucasus etc.).
The ethnically diverse or polarized societies can become an integral part of social tensions in the so-called ‘Western, developed’ world too, par- ticularly through the ever-increasing migration, which largely diversifi ed the once single-faced societies in the past decades.
Our work aims to fi nd out what results can be achieved by using sta- tistical and mathematical methods to explore a traditionally multi-ethnic and multicultural region, and its ethnic transformation. Is generalization possible by using mathematized studies, can these devices help the researcher or the decision-maker and if so, where are the limits of these methods? As the actual fi eld of study, we have chosen a region, Vojvodina in Serbia, which claims to have one of the most heterogeneous ethnic structures in Southeast Europe and where signifi cant ethnic changes took place in the past decades.
Measurement and practical use of ethnic diversity
In its original sense, diversity means the species diversity of living organisms at the various levels of biological systems (Hawksworth, D.L. 1995, 6–7). In other words, ‘the mathematical quantitative representation of biological di- versity,’ whose extent can be determined by methods based on statistical dis- tributions (geometrical, logarithmic etc.) or probability calculation (Majer, J.
1993, 177–203; Magurran, A.E. 2004, 100–130). The fi rst att empt by the social sciences to exactly measure ethnic and linguistic diversity was the so-called
‘ethno-linguistic fractionalization index,’ also known as the Herfi ndahl index (Taylor, C. and Hudson, M.C. 1972), originally applied by ecologists to meas- ure the biological species diversity.
The method which has become known in Hungary as the ‘ethnic di- versity index’ (Bajmócy, P. 2004, 2009; Reményi, P. 2009; Németh, Á. and Šolks, G. 2012; Németh, Á. 2013) indicates the chances that two randomly meeting inhabitants of a given area have diff erent ethnic origins. The values could vary between 0 and 1: while 0.00 suggested a homogeneous ethnic composition, 1.00 showed a perfectly heterogeneous composition when each inhabitant of the sett lement belonged to a diff erent ethnic group.
where L = population of sett lement/area, e1, e2, … en = number of persons belong- ing to the ethnic groups, EDI = Ethnic Diversity Index (Bajmócy, P. 2009).
The widespread use of the method started in the 1990s, when the re- search into the social eff ects of ethnic and religious heterogeneity, in connec- tion with the rapidly diversifying population of Western European and North American states, was increasingly brought into the spotlight (e.g. Mauro, P.
1995; Easterly, W. and Levine, R. 1997; Reilly, B. 2000/2001; Collier, P. 2001;
Alesina, A. et al. 2003; Fearon, J. 2003; Montalvo, J. G. and Reynal-Querol, M. 2005). The potential eff ects on political structures, economic development, social cohesion, educational systems, the risk of confl ict development etc. have since been fi ercely debated in the literature.
But whatever conclusion is drawn by the case studies and models, a special type of ethnic diversity almost always emerges in one way or another:
the case of polarization. In recent decades, more and more researchers recog- nized that not only (or not primarily) fragmentation can directly or indirectly infl uence the various spheres of society but also a high degree of polarization when two or maximum three ethnic groups with nearly identical popula- tion are present. Without taking sides in this extremely complex and rather sensitive issue, we would like to highlight only a few aspects below to prove that ethnic geography in the future should focus on research into not only fragmentation but also polarization.3
Ethnic diversity is generally described in the literature as a phenom- enon with dual nature: it can be a potential resource but also a risk factor for the states at the same time. An open and plural society experiences diversity as a basically positive, inspiring phenomenon. The mixture of ethnicities and cul- tures, and the practical realization of multiculturalism are considered by some researchers as morally necessary and particularly useful from a pragmatic point of view (Kymlicka, W. 1998, 2007). As well as this approach minimizes the risk of confl icts, it can positively infl uence the performance of economy and the labour market (e.g. Florida, R. 2002; Florida, R. and Tinagli, I. 2004).
In addition, theorists supporting multiculturalism oft en argue – typi- cally relying on examples from metropolises – for the elimination of segrega- tion and the creation of residential areas with mixed ethnicities. They assume that this form of coexistence protects, on the one hand, the minority groups
3 The fi rst use of ‘polarization index’ in Hungarian geographic literature as well as the method applied in this paper (parallel analysis of diversity and polarization indices) is described in greater detail in the PhD thesis of Németh, Á. 2014.
and the district itself from being stigmatized, and on the other hand, it can contribute to the catching up of disadvantaged groups by strengthening the network of relationships (Gij sberts, M. et al. 2012, p. 528). If ethnic diversity also means the mixture and the parallel existence of languages, the inhabitants will automatically and involuntarily become multilingual. Although societies in Central and Eastern Europe still oft en fi nd it necessarily bad, it is in fact an incredible competitive advantage in the global labour market against those who grew up in a homogeneous, multilingual environment. Accordingly, these regions can/could be viewed as areas capable of off ering a valuable, potentially qualifi ed, multilingual labour force. Also, the mixed ethnic composition is mostly coupled with a colourful and vivid cultural life, which can occasionally constitute a tourist att raction, being another serious competitive advantage in this dynamically developing sector of economy.
However, some of the economists studying the eff ects of ethnic diver- sity believe that ethnic fragmentation undoubtedly involves certain extra costs.
In the case of less developed states with smaller fi nancial capacities, it can be an aspect of key importance. Also, heterogeneity oft en negatively infl uences economic growth in an indirect way (e.g. Mauro, P. 1995; Easterly, W. and Levine, R. 1997; La Porta, R. et al. 1999; Tavares, J. and Wacziarg, R. 2001;
Alesina, A. et al. 2003). One of the reasons can be that it is usually harder for ethnically fragmented communities to fi nd a cooperative solution to the emerging problems, and they are more likely to waste available resources on fi ghting for various particular interests (Alesina, A. et al. 1997; Habyarimana, J. et al. 2007). In a polarized society it can invite a form of behaviour which is known as the ‘theory of rent-seeking’ in the economic literature, and which is considered a particularly damaging social phenomenon.4
On the other hand, the social and economic problems may involve more severe political consequences by that people sometimes interpret what are social problems of a diff erent origin as ethnic problems. In other words, the tensions frequently break out along ethnic fault lines, even in cases where previously ethnic issues were apparently less remarkable (Fearon, J. and Laitin, D. 2000). Therefore in certain cases, ethnic fragmentation can lead to political instability.
There are researchers who go even further and claim that diversity in certain conditions can increase the risk of eruption of ethnic confl icts or even civil wars. In Richard Hartshorne’s classic theory the ethnically, religiously,
4 If the benefit is not generated naturally but created artifi cially, e.g. by government measure, competition will arise for the benefi t, and the resources which the companies use to grab the benefi t – e.g. in the form of lobbying – will be wasted from the society’s point of view – Lőrincz, L. 2007. In return, this ‘competition’ is usually more likely to sharpen in polarized communities than in homogeneous or fragmented ones (Montalvo, J. G. and Reynal-Querol, M. 2005, 293–294).
and mother tongue-wise heterogeneous population (without mathematizing diversity) is one of the most signifi cant centrifugal forces that can infl uence a state (Hartshorne, R. 1950; Pap, N. 1999). In return, by a negative feedback, this can have further damaging eff ects on the economy, since e.g. the uncer- tainty in domestic politics can signifi cantly decrease the size of foreign capital investment (Montalvo, J.G. and Reynal-Querol, M. 2005, p. 308). A number of researchers, however, think that this issue is not determined by the extent of ethnic fragmentation but rather polarization. Horowitz, D. (1985), e.g. points out that civil wars unfold relatively rarely in homogeneous and heavily frag- mented (i.e., highly diverse) societies. The biggest tensions usually break out where there is one or maximum two infl uential minorities next to the domi- nant majority, i.e., where polarization is perceivable.
A similar conclusion was drawn by Collier, P. (2001, p. 130) and Bates, R. (1999, p. 31) who think diversity does not increase (to the contrary, it de- creases) the risk of confl ict generation, and it does not negatively infl uence the performance of economy. Montalvo, J. G. and Reynal-Querol, M. (2005) directly apply the ethnic polarization index to emphasize that on a global scale there shows a defi nitive correlation between the extent of social polarization and the development of ethnic confl icts.
The potential effects of diversity on social cohesion are possibly even more intensely contested than the previous ones. Leigh, A. (2006) and Putnam, R.D. (2007) claim that in ethnically fragmented urban districts, mutual trust and solidarity is lower, and the tendency to assist and cooperate is usually weaker. Other researchers, however, reject this hypothesis and argue that in the European context there is no evidence that ethnic diversity in itself un- dermines social cohesion (e.g. Tolsma, J. et al. 2009; Hooghe, M. et al. 2009, 528–529). Therefore there is no consensus, and it is not surprising either that several theories of the problems have recently been published (summarized in: Gij sberts, M. et al. 2012).
The so-called ‘homogeneity theory’ claims, e.g., that people mostly seek contact with people who are culturally similar to them, thus interaction in ethnically and religiously mixed communities is usually less and more su- perfi cial. This is related to ‘social control theory’ which claims that if the social norms accepted as common values are missing from the community, mutual distrust can easily prevail.
With the accumulation of other adverse conditions, social control may stop, leading to the overall deterioration of public safety. This is in sharp contrast to ‘contact hypothesis’ which emphasizes the positive eff ects of het- erogeneity. Its motive is the tolerance developed by mutual understanding, which can ideally result in the strengthening of solidarity and mutual trust.
All this will inspire the individual who can become open, culturally richer, and thus socially more successful.
The fourth, so-called ‘competition theory’, though without actually nam- ing it, in fact examines a potentially negative eff ect of polarization. The theory claims that the rise of suspicious, hostile att itude between ethnic groups can merely be triggered by the signifi cant increase of the number of members be- longing to the ‘other group’ (e.g. Quillian, L. 1995). ‘The closer they are’ and the more there are of ‘them,’ the more probable that people’s sense of threat intensifi es, they see the situation as competition, and they will retreat under the ‘protective shield’ of their own group. This hypothesis states that the rise of ethnic polarization, whether intended or not, generates an imaginary or real competitive situation between the ethnic groups which can imply the splitt ing of micro communities and the weakening of social cohesion.
Like us, no one claims that ethnic fragmentation or polarization in itself could determine any social patt ern of eff ect. However, most researchers agree that in analyzing complex social, economic and political processes, the phenomenon of ethnic fragmentation and polarization cannot be neglected as important but never exclusive factors.
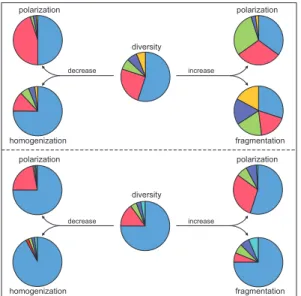
The ambitious research projects of the recent past have therefore point- ed out that ethnic polarization should not be seen merely as a form of diversity but a particular quality that is equivalent to homogeneity and the perfect het- erogeneity. This theoretical basis forms the starting point of our work. In our assumption the change in diversity is a process that cannot be described as a two-dimensional motion. Both homogenization and diversifi cation can, de- pending on the initial status, result in polarization; and conversely, if the extent of polarization decreases, the ethnic structure may shift toward both homogeni- sation and fractionalisation. A simplifi ed model of the relation between diver- sity and polarization (with the same number of ethnic groups) is shown in Figure 1.
Considering the broad scale of potential social impacts of ethnic polarization, it is not surprising that by the late 1990s the need emerged international- ly to exactly defi ne and measure polarization. The simplest way is classifi cation based on the per- centage rates of majority and mi-
Fig. 1. A simplified model of the change of diversity and polariza- tion based on a hypothetical society
(Németh, Á. 2014, p. 28)
norities (Reilly, B. 2000/2001). Fearon represented each country by a rectangular coordinate system, indicating the rate of majority on the x-axis, and the rate of the largest ethnic minority on the y-axis (Fearon, J.D. 2003, 206–208). The closer these points were to the vertex (0.5, 0.5), the more bipolar the society was.
A more sophisticated defi nition of the extent of polarization uses a different logic: the ‘ethnic polarization index’ (EPI) can be determined by the normalized distance of a particular distribution of ethnic groups from a bimodal distribution. The deviation of each group from the maximum polari- zation share of 0.5 is weighted by the group’s own share (Montalvo, J. G. and Reynal-Querol, M. 2005; Alesina, A. and La Ferrara, E. 2004)5. In Montalvo and Reynal-Querol’s index the received values can also vary between 0 and 1 but the index reaches its maximum if the given society is divided between two equally populated groups (at that point the diversity index is 0.50); thus the state of perfect polarization has emerged. Aft er this point, however, the two curves will behave diff erently: with the increase of fragmentation, the extent of polarization gradually decreases. If each person of a sett lement with 100 inhabitants claims to be of a diff erent ethnicity, the state of perfect fragmenta- tion and, concurrently, the state of perfect diversity have been reached, while the extent of polarization will converge to zero.
It also means that theoretically every EPI value can be associated with two states. The ethnic polarization index will be, e.g., 0.40 if the rate of ethnicities stands at 88.8%–11.2%, but also when the society is fragmented into nine equally populated ethnic groups. The EPI can be calculated with the following formula:
N
Q = 1 – Σ ([0.5 –πi]/0.5)2 * πi, i=1
where, πi = share of group i in the whole population, Q = Q-index or Ethnic Polarization Index (EPI).
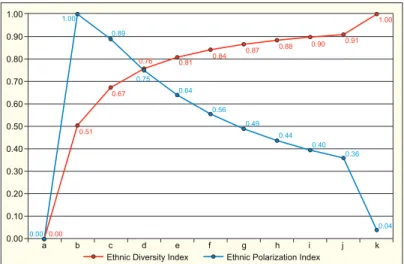
The relation of these two parameters of ethnic diversity is shown in the fi gures below. The lett ers on the x-axis in Figure 2 show a hypothetical state where a = 1 ethnic group with 100 persons; b = 2 ethnic groups with 50 persons; c = 3 ethnic groups with 33 persons; … j = 10 ethnic groups with 10 persons; k = each member of the population belongs to a diff erent ethnic group.
If the EDI and EPI values calculated for each area unit are represented by a rectangular coordinate system (Figure 3), the result will be the following: the polarization index is highly correlated with fractionalization at low levels of EDI, uncorrelated at intermediate levels, and negatively correlated at high levels (Alesina, A. and La Ferrara, E. 2004, p. 28).
5 A special case of the polarization index (Esteban, J.M. and Ray, D. 1994) controls the distances between the groups, in other words it uses continuous measures of distances (Desmet, K. et al. 2009, 1294–1299).
Fig. 2. EDI and EPI values related to each other in the case of a community with 100 inhabitants (Németh, Á. 2014, p. 26)
Fig. 3. EPI related to EDI (in other words ‘fragmentation index’) exemplified by the states of the world (Montalvo, J.G. and Reynal-Querol, M. 2005, p. 307)
Based on the points arranged in a typical V-shape on the graph, we are able to create types; however, only units with medium or high diversity index are worthwhile for such an analysis. The reason for it is that at low values (around EDI < 0.40) the correlation coeffi cient is extremely high, the points are arranged in a linear order, it makes no sense to create groups. Nevertheless, this method helps identify the two diff erent forms of diversity, which can be further analyzed by an automated dimension-reducing procedure (e.g. cluster analysis). The analysis can
also be made dynamic by displaying the change between two points of time. In that case, four categories can be created based on ΔEDI and ΔEPI which refl ect the modifi cation of ethnic structure according to the directions shown in Figure 1.
The method has the same fl aws and imperfections as every other math- ematical method similar to it. The contrast between the postmodern, soft defi - nitions of ethnicity (pl. Barth, F. 1969; Jenkins, R. 1997; Brubaker, R. 2001) and the analysis of naturally rigid statistical data can possibly be termed the most fundamental set of problems of the research. While the diversity and polariza- tion indices can classify each individual under a single category, ethnic identity in modern societies must not be considered a static fact but rather a dynamic category which can be changed by emotional and rational aspects. This makes addressing individuals with dual or multiple identities problematic.
The diff erent interpretation of the basic notion itself (ethnicity) in space and time may be misleading too. Mainly, it extremely complicates compara- bility as the notion of ‘ethnic group’ appears diff erently e.g. in the US and Ugandan statistics, not to mention countries where such data are not even col- lected. One must not forget about the fault factor arising from the uncertainty of data collection, which typically characterized the older statistical publica- tions. Therefore some researchers argue that these indicators oft en reveal as much of the individual phenomena as they also hide. We, however, believe that the statistical data and the quantitative methods based on them, despite all their faults and imperfections, should continue to form an important part of ethnic research, since the interpretation of processes in a geographical space and the non-microregional studies are only conceivable in this framework.
Ethnic transformation in Vojvodina
Based on the ideas proposed above, the following is the study of a typical Cen- tral European multicultural space and its signifi cant ethnic changes in the past two decades, presented to illustrate the theoretical considerations above.
For centuries, Vojvodina has been one of the ethnically most diverse macro regions of the Carpathian Basin (Kocsis, K. 2006; Gulyás, L. 2005) (Figure 4). Three dominant ethnicities (Serbian, Hungarian and German) and many smaller but signifi cant groups lived here at the dawn of the 20th century. During the 20th cen- tury, however, a large-scale ethnic homogenization took place continuously, but particularly in two big waves (following the 2nd World War and aft er 1991) (Kocsis, K. et al. 2006; Léphaft, Á. 2011a; M. Császár, Zs. and Mérei, A. 2012). In our ethnic studies we use the offi cial results of the last three censuses (1991, 2002 and 2011), partly on sett lement level and partly on municipality level, which will be used to calculate the diversity and polarization indices as well as their changes with the above devices, to be assessed later on the basis of our fi eld experiences.
Ethnic homogenization in Vojvodina
As already mentioned, the ethnic homogenization of Vojvodina took place continuously in the 20th century. However, its intensity has varied in time (Figure 5) as well as in space.
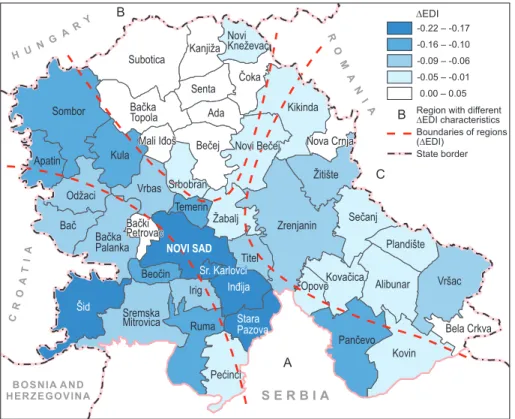
Between 1991 and 2011, Srem and Western Bačka became the most homogeneous territories. Degrees of ethnic homogenization on the level of municipalities are signifi cant, the change in the ethnic diversity index can reach -0.22, which can be described as a huge change, since this scale of ethnic transformations could generally be seen only in the former Yugoslavian mu- nicipalities involved in armed confl icts. This outstanding value is primarily observable in the sett lements along the Belgrade–Novi Sad axis. In the case of Western Bačka, the level of homogenization is lower, the change of the in- dex is between -0.00 – -0.16. The primary cause of the above processes is the Fig. 4. Ethnic composition of Vojvodina accordingto the 2011 census, based on preliminary data of the StatisticalOffi ce of the Republic of Serbia. Cartographic methodology ispartially
based on the 2002 map of the province (Kocsis, K. and Kicošev,S. 2004)
Serbian immigration and the departure and decreasing ratio of Hungarians, Croats, as well as other small ethnic groups. The drastic decrease of the rate of ‘Yugoslavs’ also fuels the change (Figure 6).
The immigration of Serbs originates from two processes: it is caused, on the one hand, by the Serbs fl own to Serbia during the wars accompanying the breakup of Yugoslavia, and on the other hand, by the att raction of one of the most important axes of the country between Belgrade and Novi Sad, as well as the agglomeration of these two cities. The latt er is much more like a natural economic migration fi tt ing within the classic urbanization theory, and it explains why we were able to measure outstanding homogenization values in the mentioned region.
To some extent, the above logic can be used, although with opposing values, to explain why the south of Banat, though ethnically diverse, has barely changed. The urbanized municipalities such as Vršac (0.80) and Pančevo (0.14), which exceed the regional average of South Banat in terms of their develop- ment level, the latt er being a functional part of the Belgrade agglomeration, experience larger homogenization in which both refugees and spontaneous migrants play a part. In the case of others, in spite of the basically diverse structures, which therefore allow ethnic homogenization, the level of ethnic homogenization is low. One of the possible reasons is the region’s relative backwardness and poverty, i.e., compared to the Belgrade–Novi Sad axis it is a less att ractive target area for migration, therefore substantially less immi- grants arrive here, and even the Serbs are leaving the region in large numbers because of economic or development issues.
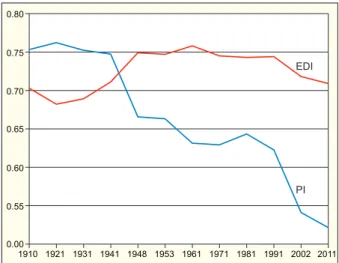
Fig. 5. The relative change of diversity and polarization indices between 1910 and 2011 in Vojvodina
The middle part of Banat, the Žitište–Zrenjanin–Titel strip shows an above-average rate of homogenization compared to the southern part of Banat mentioned above (the change of the ethnic diversity index in all three mu- nicipalities is 0.7, rounded). The homogenization of Zrenjanin, the third most populated city of Vojvodina, is of central importance. The western part of the strip (Titel) still belongs to the Novi Sad agglomeration and all three munici- palities take a signifi cant number of refugees.
On the edge of the Hungarian block, where the Hungarian ethnicity has become a minority, slow homogenization can be observed (-0.005 – -0.03), and the block with Hungarian majority has been diversifying at an almost similar rate – i.e., a slight Serbian immigration and a larger scale of Hungarian emigration/assimilation are under way. As a result of the above processes, 3 regions with diff erent characteristics can be defi ned in terms of ethnic diversity in Vojvodina (see Figure 6):
Fig. 6. The ethnic homogenization of Vojvodina’s municipalities between 1991 and 2011 based on the ethnic diversity indices calculated from the results of offi cial censuses. A, B
and C = detailed explanation is in the text
A) A rather homogeneous (on Vojvodina’s scale) and further homog- enizing southern strip was formed, as the result of the Serbs’ permanent northbound migration. It is a Serb-dominated zone South of the Odžaci–
Žabalj–Kovin bend. Here the Serbs today form minimum three-fourths of the municipality’s population almost everywhere with a couple of minor excep- tions (Bački Petrovac, Beočin, and Kovačica). The region – as the rate of ethnic minority groups is low – is not characterized by ethnicity-driven confl icts.
B) On the North a transition zone has been formed, the area of the narrowly defi ned ethnic boundary, where on the level of municipalities, gen- erally no ethnic group claims a majority of over two-thirds. The ratio of the majority ethnicity varies between two-thirds and 50% (again with one or two exceptions, e.g. in Kikinda the ratio of Serbs reaches three-fourths of the total population). This zone is the Bela Crkva–Sombor strip, whose northern side is Hungarian–Serbian (Subotica, Mali Iđos, Bačka Topola, Bečej), the middle strip today is already Serbian–Hungarian (Srbobran, Temerin, Novi Bečej, Nova Crnja). The southern part has been until today mosaic-like, mixed Serbian–
Hungarian–Romanian (Žitiste, Plandiste, Sečanj, Alibunar), and the western part is Serbian–Croatian–Hungarian, in which other locally signifi cant ethnic groups appear too (Rusyns, Montenegrins, Slovaks).
This whole ethnic status is already the consequence of a Serbian infl ux occurring in several waves, the Hungarian–Serbian inter-ethnic confl icts of the recent past are mostly associated with this zone. This is the strip where signifi cant ethnic transformations took place in the past decades in a way that the ratio of minority-bound Hungarians is still considerable (around 30%), but there is a new and growing Serb majority. This is also the region where the members of both groups display ‘border-mentality’ (Ilić, V. and Keveždi, M. 2012), the region ethnically being a real frontier, where both communities experienced great changes in their position: from majority to minority and to minority from majority within one generation (see the case of Temerin – Nagy, I. and Tátrai, P. 2013).
These changes then create frustration in many among the communities.
The presence of competing extremist groups from both sides (Serbians and Hungarians) also points to the transition zone (Léphaft, Á. 2011b) that best fi ts the previously mentioned ‘competition theory’. It must be emphasized that quantitative methods (as census data generally) are not able to distinguish domicile and recent migratory subgroups, however in the latt er case the po- tential of confl ict is presumably higher.
C) A shrinking area chipping at the edge with Hungarian majority along the river Tisza. Here assimilation, emigration and the slow but steady Serbian immigration brings about a not too high but constant ethnic diversi- fi cation. On the edge where the Hungarian bloc connects the transition zone described above a new confrontation is forming, a new frontier zone is being
born. Taking into consideration the potential eff ects of ethnic polarization on social cohesion, the Hungarian–Serbian tension could heighten across this zone, while the confl icts on the former frontier area could gradually stop.
Comparing the 2011 values of ethnic diversity (Figure 7) and polariza- tion indices with those of 1991, it can be concluded that the Serbian ethnic group, due to the signifi cant immigration and the shrinking of non-Serbian communities, set out to homogenize the southern band of Vojvodina and the former ethnic boundary which lay there in 1991, shift it to the North, narrow the Hungarian majority areas from the south and connect the formerly insular Serbian ethnic enclaves (Odžaci, Žabalj, Titel, Zrenjanin).
However, by splitt ing the 20 years under examination, it can be ob- served in many places (e.g. Kikinda, Srbobran, Novi Bečej, Nova Crnja) that the ethnic homogenization of the war period (between the censuses in 1991 and 2001) is signifi cant because of the Serbs’ immigration, but in the period between 2001 and 2011 a counter-process is under way although on a smaller
Fig. 7. The ethnic diversity indices of Vojvodina’s municipalities in 2011 based on the of- fi cial census results
scale. Some regions have re-diversifi ed, mainly as the result of the rapidly decreasing Serbian population due to low birth rates and economy based emi- gration from the region (either to urban centers within Serbia or to abroad).
Ethnic polarization in Vojvodina
Both homogenization and diversifi cation can result in polarization, depending on the initial status. And conversely: if polarization decreases, the ethnic structure can shift toward both homogenization and fragmentation. This is clearly visible by studying the ethnic transformation of Vojvodina in the 20th century. Between 1910 and 1921, the diversity index rose while the polarization index dropped, i.e., the ethnic structure of the region became more and more fragmented.
Between 1921 and 1948 (intensively between 1941 and 1948) the diver- sity index decreases and the polarization index rises, i.e., the structure becomes increasingly bipolar with the shrinking of small ethnicities and mainly the German population, and the further increase of the most numerous Serbian ethnicity. In the following period, the processes generally point toward ho- mogenization, i.e., both indices, though not steadily, start to decrease, which clearly indicates the development of homogeneous ethnic structures.
At the same time, the diff erent pace of change in the two indices also means that next to the Hungarian minority, the rate and signifi cance of other groups are decreasing. Thus homogenization is much faster-paced than polari- zation, but the former one is caused only to a smaller extent by the decrease of Hungarians, and to a greater extent by the decreasing population of other non-Serbian ethnicities.
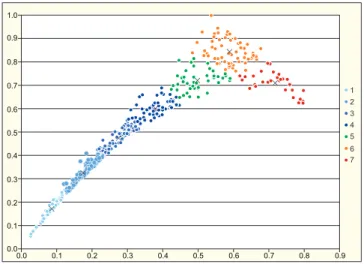
Classifi cation of Vojvodina’s sett lements based on ethnic diversity and polarization
Using cluster analysis (K-means cluster) in our research, we were able to sepa- rate seven types based on the 2010 ethnic diversity and polarization indices (Figure 8). It clearly shows that nearly half of the sett lements have a diversity greater than 0.50, i.e. the mathematical midpoint of the diversity scale. Ad- ditionally, the majority has a polarization index bigger than medium. That is, despite the continuous ethnic homogenization during the 20th century, the local ethnic diversity of the region is still signifi cant.
Based on the result of cluster analysis projected onto the map, four diff erent types of space can be separated that are important to us (Figure 9):
a) The sett lements of the Belgrade–Novi Sad axis and Srem can be characterized, with very few exceptions, by low polarization and diversity indices, since practically this is the only unbroken area of population growth
Fig. 8. Grouping of Vojvodina’s sett lements by cluster analysis based on ethnic diversity and polarization. 1–4 = linearly increasing diversity and polarization (positive correlation); 5 = more diverse and polarized than the average (no correlation); 6 = diverse, more polarized
(no correlation); 7 = diverse, more fragmented (negative correlation)
of the last two decades which almost exclusively brought about the decline of the rate of minorities and the rise in the population and rate of Serbian majority. This includes both the immigration of Serbs and the departure of non-Serbs (mainly Croats).
b) Western-Bačka. It is well observable in the region that both the po- larization and diversity indices show a higher value than in Srem, and there are more values standing out of the basically low averages concerning both indicators. Compared to the above process in Srem here the increase of the rates of the (Serbian) majority are lower, which are nourished by, along with the Serbian immigration, the parallel losses of rapidly aging minorities. The sett lements of the region having no ethnically dominant group can be de- scribed to be rather polarized than diverse.
c) In the north-eastern part of Vojvodina ethnic blocs (Hungarian along the Tisza, Serbian around Kikinda) are characterized by low index values, the ethnic composition of sett lements is not so much homogeneous as domi- nated by one ethnicity. On the edge of blocks (predominantly on the external boundaries of the Hungarian bloc) in the mixed ethnicity zones we can see high, sometimes extremely high, polarization and diversity values. This nar- rowly defi ned Hungarian–Serbian ethnic contact zone has become today the primary fi eld of ethnic competition, which according to fi eld experiences and patt erns of media reports (Léphaft, Á. 2011b) coincides with the areas of inter-ethnic frictions.
d) Befi tt ing the history of Banat, the south-eastern part of Vojvodina still displays an extremely mosaic-like image, a number of ethnic groups live here in sporadic islands, ethnic enclaves, as well as many multiethnic sett le- ments have survived too. As a result, the indicators we studied also show a diverse, vivid picture. The parts close to Belgrade have already become Serbian-majority, so both of their indicators in question are low. However, the border and inner peripheries (Deliblato sand plains, Begej-Tisza wetlands) have still retained their diverse and polarized population.
Types of ethnic transformation on the basis of diversity and polarization
If we study the ethnic changes and not the current situation the sett lements of Vojvodina can be divided into four basic groups, according to how much the change in ethnic diversity and polarity aff ects them (Figures 1 and 10).
Fig. 9. The spatial distribution of the grouping of Vojvodina’s sett lements based on ethnic diversity and polarization using cluster analysis. (The 7 categories and the colour scheme
are the same as in Fig. 8)
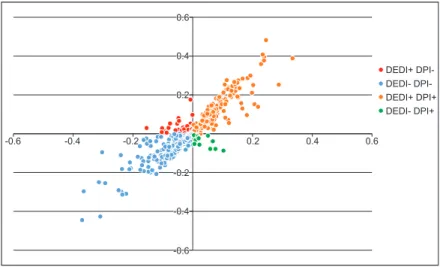
Fig. 10. Classifi cation of Vojvodina’s sett lements based on the ethnic diversifi cation and polarization.
Diversifi cation value is shown on the x-axis, polarization on y-axis. ΔEDI– and ΔEPI+ = decreasing ethnic diversity but increasing polarization; ΔEDI– and ΔEPI– = decreasing diversity and decreasing polarization (homogenization); ΔEDI+ and ΔEPI+ = increasing diversity and increasing polarization;
ΔEDI+ and ΔEPI– = increasing diversity but decreasing polarization (fragmentation)
The upper left quarter contains sett lements whose ethnic diversity is decreasing, i.e. being homogenized, but meanwhile the ethnic polarization index increases. Typically, it occurs in cases when a previously diverse, mul- tiethnic society is becoming bipolar. In practice, this aff ects 15 sett lements in Vojvodina, being the third most common type (Figure 11).
Generally, while the rate of Serbian majority increases and the minori- ties “become homogenized”: the relative weight of small ethnicities decreases, and that of the largest minority (generally Hungarians) increases. It can gener- ally be stated that next to Serbs and Hungarians at least one other minority is present in signifi cant number (Bač – Croats, Slovaks; Kovačica – Romanians, Slovaks; Kula – Montenegrins, Rusyns) and this situation is ‘becoming simpler’
due to ethnic changes.
Concerning the sett lements in the lower left quarter, both diversity and polarization decrease, therefore it is the simplest and most common case of ethnic changes. It can mainly be observed when the dominance of the majority is gaining strength, and/or the weight of the dominant minority decreases. In Vojvodina, it aff ects territories where the development and strengthening of Serbian majority have progressed. A heavy immigration has been under way, the minority communities have disappeared, and the places have become a part of the Serbian bloc. Aff ected are Srem, which experienced the most intensive ethnic transformation of the past decades, and the sett lements of the Belgrade–Novi
Sad axis. Although to a lesser extent of polarization, similar processes take place in Western Bačka, which is the extension of the previously described axis.
The sett lements of the upper right quarter are simultaneously diver- sifying and polarizing. This is the second most common type with 189 set- tlements. Society becomes varied; transformation is rather pointing toward polarization, i.e. one other or maximum two groups are formed and gain strength next to the dominant ethnic group. Concerning Vojvodina, these are districts where the majority is not Serbian (either Hungarian or Slovak) but there is signifi cant Serbian immigration because of which they are still not the majority, so the ratio of local majority decreases and that of local minority increases. Most of the Hungarian bloc at the Tisza belongs here as well as the primary territories of Slovaks or Romanians. In this category a special role is att ributed to sett lements which are losing their Serbian majority population, and at the same time the ratio of minorities (specifi cally the Roma population in many cases) is on the increase.
Fig. 11. The regional distribution of four groups formed on the basis of ethnic diversifi cation and polarization values of Vojvodina’s sett lements. (For legend see Fig. 10)
The ethnic structure of sett lements belonging to the lower right quar- ter is diversifying while polarization is decreasing. These cases suggest the fragmentation of society: the percentage rate of ethnicities becomes relatively balanced, or at least it moves into that direction. Actually, those sett lements belong here which are multiethnic and it is not the population of the larg- est ethnicities that grows. These include, e.g. Ivanovo and Svetozar Miletić, where the number of Serbs rises, who in 1991 formed only the third largest community behind the Hungarian and Bulgarian groups in the former and the Hungarian and Croatian groups in the latt er, whose population count has conversely decreased. There are several cases when the number of Serbs has in- creased parallel to the shrinking of a dominant minority (Novi Bečej, Dolovo), but a number of other smaller groups have appeared in place of Yugoslavs.
Conclusions
In our paper we presented the applicability of diversity and polarization in- dices in the study of ethnic transformations. These methods can, regardless of ethnic groups and observing the current uncertainties of input data, help to form an objective and comparative picture of the most important ethnic changes of an area. Our paper emphasizes that the increase or decrease of diversity cannot be described as a two-dimensional process, since both homog- enization and diversifi cation can result in polarization. As previous research pointed out, distinguishing between the two subtypes of ethnic diversifi ca- tion (fragmentation and polarization), due to the broad scale of their poten- tial social impacts, is a particularly important task. Methodologically, it can be considered the most important innovation of the research, since both the Hungarian and the wider Central and Southeast European literature of ethnic geography has concentrated on only one type as yet.
Therefore the use of the method made it possible to trace, while the pre- vious results and the demographic trends of the given period made it possible to prognosticate, where and how Vojvodina’s most important ethnic processes occur. Obviously, the diff erent scales show the trends with diff erent details:
interethnic confl icts are best studied on the sett lement level, while analysing the migration accompanying a regional confl ict requires a larger scale. Therefore we analysed two levels of public administration: municipalities and sett lements.6
Nevertheless, in our case study of Vojvodina the homogenizing spaces are well outlined, where the majority population continuously prevails and
6 Next to the ratios themselves, it has to be taken into consideration that the Serb ethnicity had suff ered a loss of signifi cant masses by 2011, and for ideological reasons, the content of the category ‘other’ of the census has also changed. Due to the parallel losses and transforming identities, the observable changes are often relatively small in terms of statistics.
minorities are shrinking; and the diversifying territories too where one or more minorities increase their rate at the expense of the majority population.
On a more general level, it is typically some kind of manifestation of the Serbs’ prevalence, who also forms the majority on a regional level, since what is diversifi cation in a sett lement with non-Serbian majority is often the direct result of the shrinking Hungarian, Slovak, and Romanian etc. communities.
It does matt er, however, which way the balance will shift regarding polariza- tion. Therefore within the two basic types, we separated the sett lements whose composition shift ed toward fragmentation or even polarization during the last twenty years.
Groups of sett lements with high polarization indices overlap with spots of Hungarian–Serbian confl icts which in recent years have been publi- cized (and deemed ethnically based) by the press, and which were previously collected by Léphaft, Á. (2011b). This is reason why we fi nd it important that further fi eld studies and other qualitative methods in the future should pur- posely focus on polarizing spaces, where the deepening of ethnic tensions can be anticipated the most.
REFERENCES
Alesina, A. and La Ferrara, E. 2004. Ethnic Diversity and Economic Performance. National Bureau of Economic Research, Working Paper, 10313
Alesina, A., Baqir, R. and Easterly, W. 1997. Public Goods and Ethnic Divisions. Quarterly Journal of Economics 114. (4): 1243–1284.
Alesina, A., Devleeschauwer, A., Easterly, W., Kurlat, S., and Wacziarg, R. 2003.
Fractionalization. Journal of Economic Growth 8. (2): 155–194.
Bajmócy, P. 2009. Általános etnikai és vallásföldrajz. (General ethnic and religious geography).
Szeged, JATE Press.
Barth, F. 1969. Ethnic Groups and Boundaries: the Social Organization of Culture Diff erence.
Oslo, Universitetsforlaget. 153 p.
Bates, R. 1999. Ethnicity, Capital Formation and Confl ict. Social Capital Initiative Working Paper 12. Washington DC, World Bank.
Brubaker, R. 2001. Csoportok nélküli etnicitás. (Ethnicity without groups). Beszélő Online 6. (7): htt p://beszelo.c3.hu/cikkek/csoportok-nelkuli-etnicitas last accessed: 12–18.
2013.
Collier, P. 2001. Implications of ethnic diversity. Economic Policy 16. (32), 127–166.
Desmet, K., Oruño-Ortín, I. and Weber, S. 2009. Linguistic Diversity and Redistribution.
Journal of European Economic Association 7. (6): 1291–1318.
Easterly, W. and Levine, R. 1997. Africa’s Growth Tragedy: Policies and Ethnic Divisions.
Quarterly Journal of Economics 112. (4): 1203–1250.
Esteban, J.M. and Ray, D. 1994. On the Measurement of Polarization. Econometrica 62. (4):
819–851.
Fearon, J.D. and Laitin, D. 2000. Violence and the Social Construction of Ethnic Identity.
International Organization 54. (4): 845–877.
Fearon, J.D. 2003. Ethnic and Cultural Diversity by Country. Journal of Economic Growth 8. (2): 195–222.
Florida, R. 2002. The Rise of the Creative Class: And How Its Transforming Work, Leisure, Community and Everyday Life. New York, Basic Books.
Florida, R. and Tinagli, I. 2004. Europe in the Creative Age
Gij sberts, M., Van der Meer, T. and Dagevos, J. 2012. ’Hunkering Down’ in Multi-ethnic Neighbourhoods? The Effects of Ethnic Diversity on Social Cohesion. European Sociological Review 28. (4): 527–537.
Gulyás, L. 2005. Két régió – Felvidék és Vajdaság sorsa – az Osztrák-Magyar Monarchiától napjainkig (The fate of two regions – Upper Hungary and Vojvodina – from the Austro–Hungarian Monarchy to the present). Budapest, Hazai Térségfejlesztő Rt.
Habyarimana, J., Humphreys, M., Posner, D.N. and Weinstein, J.M. 2007. Why Does Ethnic Diversity Undermine Public Goods Provision? American Political Science Review 101.
(4): 709–725.
Hartshorne, R. 1950. The functional approach in political geography. Annals of the Association of American Geographers 40. (2): 95–130.
Hawksworth, D.L. ed. 1995. Biodiversity: Measurement and Estimation. Chapman & Hall and The Royal Society, Springer.
Hooghe, M., Reeskens, T., Stolle, D. and Trappers, A. 2009. Ethnic Diversity and Generalised Trust in Europe: a Cross-national Multilevel Study. Comparative Political Studies 42.
(2): 198–223.
Horowitz, D. 1985. Ethnic Groups in Confl ict. Berkeley, CA, University of California Press.
htt p://www.creativeclass.com/rfcgdb/articles/Europe_in_the_Creative_Age_2004.
pdf, accessed at 15 Jan. 2013. htt p://www.nber.org/papers/w10313.pdf?new_win- dow=1 last accessed: 12–19. 2013.
Huntington, S.P. 1996. The Clash of civilizations and the remaking of world order. New York, Simon and Schuster.
Ilić, V. and Keveždi, M. 2012. Temerin – sadašnjost ili budućnost Vojvodine (Temerin - present or future of Vojvodina). Zrenjanin, Centar za razvoj civilnog društva, 72 p.
Jenkins, R. 1997. Rethinking Ethnicity. Arguments and Explorations. London–Thousand Oaks–New Delhi, SAGE Publications.
Kocsis, K. 2006. Adalékok az etnikai térszerkezet változásaihoz a mai Vajdaság területén a 15. és a 18. század vége között i időszakban (Supplement for the changes in ethnic structure of the present day territory of Vojvodina between the end of the 15th and 18th centuries). In A Délvidék történeti földrajza. Ed. Kókai, S. Nyíregyháza, Nyíregyházi Főiskola Földrajz Tanszéke, 125–133.
Kocsis, K. and Kicošev, S. 2004. Ethnic map of present territory of Vojvodina. Budapest, MTA FKI, MTA Kisebbségkutató Intézet.
Kocsis, K., Bottlik, Zs. and Tátrai, P. 2006. Etnikai térfolyamatok a Kárpát-medence határainkon túli régióiban (1989–2002). (Ethnic spatial processes in the regions of th Carpathian basin beyond the borders of Hungary (1989–2002). Budapest, MTA FKI, 197 p.
Kymlicka, W. 1998. Ethnic Relations and Western Political Theory. In Managing Diversity in Plural Societies: Minorities, Migration and Nation-Building in Post-Communist Europe.
Ed. Opalski, M., Ott awa, Forum Eastern Europe, 275–322.
Kymlicka, W. 2007. Multicultural Odysseys. Navigating the New International Politics of Diversity. Oxford University Press, 374 p.
La Porta, R., Lopez de Silanes, F., Shleifer, A. and Vishni, R. 1999. Quality of Government.
Journal of Law, Economics & Organization 15. (1): 222–279.
Leigh, A. 2006. Trust, Inequality and Ethnic Heterogeneity. The Economic Record 82. (258):
268–280.
Léphaft, Á. 2011a. A recens magyarellenes incidensek területi összefüggései a Vajdaságban.
(Spatial context of recent anti-Hungarian incidents in Vojvodina). Mediterrán és Balkán Fórum 5. (1): 17–25.
Léphaft, Á. 2011b. Szerb térnyerés a Vajdaságban. (Serbian expansion in Vojvodina). Közép- Európai Közlemények 4. (3–4): 109–115.
Lőrincz, L. 2007. A járadékszerzés elmélete (Theory of rent seeking). Kormányzás, Közpénzügyek, Szabályozás 2. (1): 105–125.
M. Csaszar, Zs. and Mérei, A. 2012. Ethnic-homogenization processes in the most developed region of Serbia, the multiethnical Vojvodina. Historia Actual Online 27: 117–128.
Magurran, A.E. 2004. Measuring Biological Diversity. London, Blackwell Publishing.
Majer, J. 1993. Az ökológia alapjai (Basics of ecology). Pécs, Szaktudás Kiadó.
Mauro, P. 1995. Corruption and Growth. Quarterly Journal of Economics 110. (3): 681–712.
Montalvo, J.G. and Reynal-Querol, M. 2005. Ethnic Diversity and Economic Development.
Journal of Development Economics 76. (2): 293–323.
Nagy, I. and Tátrai, P. 2013. A migráció hatása Temerin népességnövekedésére és etnikai szerkezetének átalakulására. Tér és Társadalom 27. (3): 134-146.
Németh, Á. 2013. Ethnic Diversity and its Spatial Change in Latvia, 1897–2011. Post-Soviet Aff airs 29. (5): 404–438.
Németh, Á. 2014. Etnikai homogenizálódás, fragmentálódás és polarizálódás a XX–XXI. századi Baltikumban (Ethnic homogenization, fractionalization and polarization in the Baltic region in the 20th–21st centuries). PhD thesis, Pécs, University of Pécs, Doctoral School of Earth Sciences, 195 p.
Németh, Á. and Šolks, G. 2012. Alteration of the Ethnic Diversity and Ethnic Segregation Index in Latvia during the First and Second Independence Periods. The Romanian Journal for Baltic and Nordic Studies 4. (1): 9–33.
Pap, N. 2001. Törésvonalak Dél-Európában (Faultlines in Southern Europe). Pécs, PTK TTK FI.
Putnam, R.D. 2007. E pluribus unum. Diversity and Community in the twenty-fi rst Century.
Scandinavian Political Studies 30. (2): 137–174.
Quillian, L. 1995. Prejudice as a Response to Perceived Group Threat. Population Composition and anti-Immigrant and Racial Prejudice in Europe. American Sociological Review 60. (4): 816–860.
Reilly, B. 2000/2001. Democracy, Ethnic Fragmentation, and Internal Confl ict: Confused Theories, Faulty Data, and the “Crucial Case” of Papua New Guinea. International Security 25. (3): 162–185.
Reményi, P. 2009. Etnikai homogenizáció a volt Jugoszláviában (Ethnic homogenization in former Yugoslavia). Balkán Füzetek, 1. különszám, 122–129.
Tavares, J. and Wacziarg, R. 2001. How Democracy Aff ects Growth. European Economic Review, 14. (8): 1341–1378.
Taylor, C. and Hudson, M.C. 1972. The World handbook of Political and Social Indicators. 2nd ed. New Haven, CT, Yale University Press.
Tolsma, J., Van Der Meer, T. and Gesthuisen, M. 2009. The Impact of Neighbourhood and Municipality Characteristics on Social Cohesion in the Netherlands. Acta Politica 44. 286–313.